
INDUSTRY UPDATE: A World of Executive Opportunity
The Big Picture
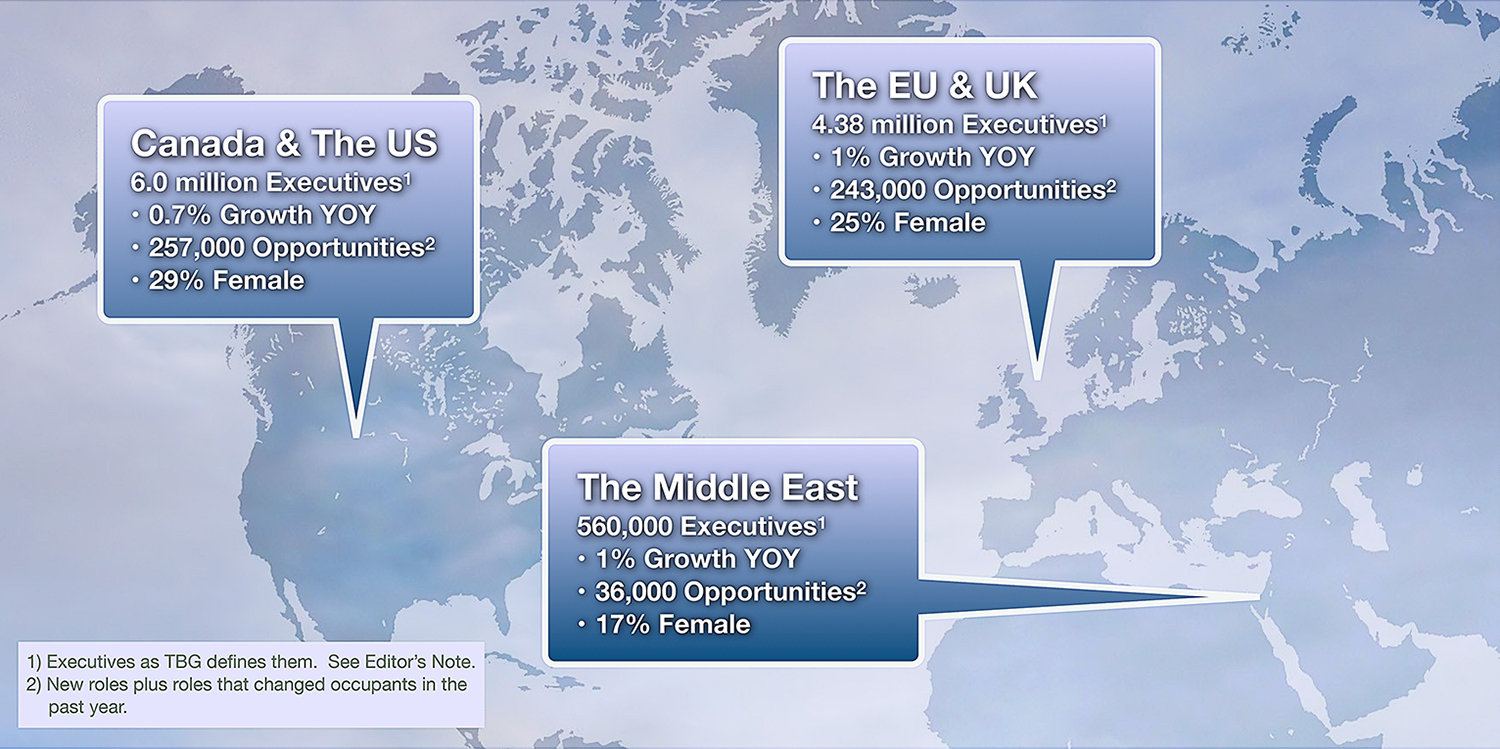
Between the stock market’s gyrations, flaring violence on Europe’s eastern border and in Gaza, vitriolic politics, and macroeconomic upheaval, it would be easy to assume that the market for executives is holding its breath at the moment. That does not seem to be the case. The Barrett Group (TBG) serves executive clients mainly in the US, Canada, EU, UK, and Middle East and sees only vibrant activity in this market of approximately 11 million executives as we define them. (See the Editor’s Note for details.)
The graphic below provides an overview of TBG’s world. It highlights executive opportunities, by which we mean newly created executive positions plus the exchange of incumbents when one person leaves and another is hired. In total, this “churn” represents more than 500,000 executive positions each year. The regional markets are also growing at somewhat different rates. But more striking than that is the lingering gender bias whereby females occupy 29% of executive positions in the US and Canada, 25% in the EU and UK, and just 17% in the Middle East.
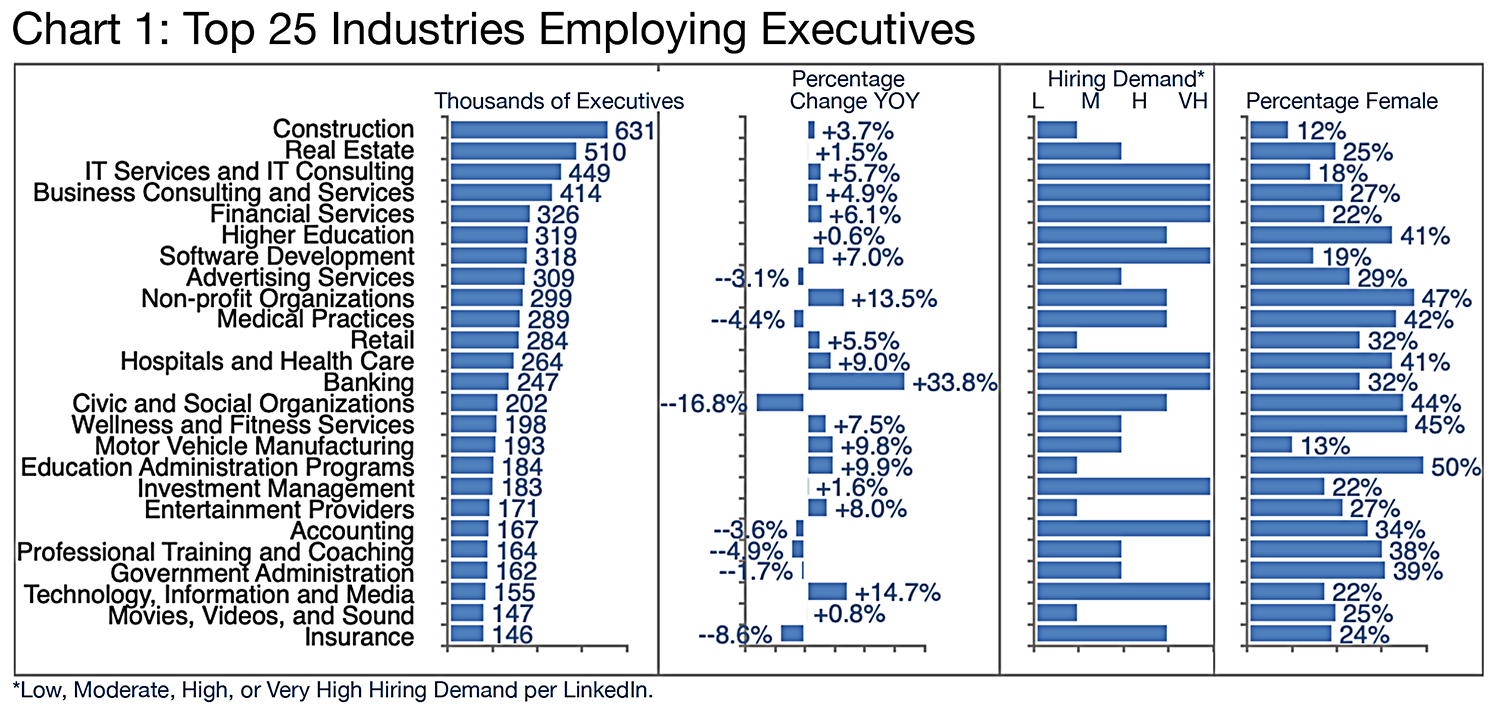
Clearly industrial dynamics have an enormous impact on executive employment. Chart 1 provides an overview of how the largest segments are faring with respect to their stock of execs.
Take Construction, for example. In this period at least, this sector has added 3.7% more executives, reaching a total of 631,000. But the forward-looking hiring demand is low according to LinkedIn, and the share of female executives is very low at just 12%.
Contrast that with the Banking sector. It appears to have grown by almost 34% while experiencing very high hiring demand and employing a relatively average share of female executives at 32%. To understand why banking is growing, one might look to the big players. They did relatively well in the latest period, but the top growth in executives was actually elsewhere according to LinkedIn, including Banc of California (+47.7%), Société Générale (+41.9%) and PKO Bank Polski (+21.3%). Among banks, Vice Presidents, Directors, Senior Vice Presidents, Managing Directors, Presidents, and CEOs drove the growth in executive headcount.
| The Barrett Group sees only vibrant activity in the executive market. |
Alternatively, consider Civic and Social Organization’s dramatic -16.8% decline. What is driving that? Here’s one perspective:
[…] civic associations have radically declined in number and reach in the last decades. As documented in Robert Putnam’s Bowling Alone, this decline began in the 1960s and has since accelerated. Many causes he cites—two-career families, the rise of individuated mass entertainment, and more recently the ubiquity of social media—will not reverse themselves and indeed are likely to grow stronger in force. [See source.]
Industries Where Executives Are in Demand
Several industries stand out with very high hiring demand per LinkedIn. They include IT Services, Business Consulting, Financial Services, Software Development, Hospitals and Health Care, Banking, Investment Management, Accounting, and Technology, Information and Media.
Female executives achieve their highest shares in Education Administration Programs (50%), and Non-profit Organizations (47%).
Naturally, there is only so much room to go into the major trends in a summary document such as this. However, TBG’s clients benefit from significant research support whether at the early, screening industry stage, or later in their career change processes as they prepare for critical interviews and require in-depth profiles of target companies and/or hiring managers.
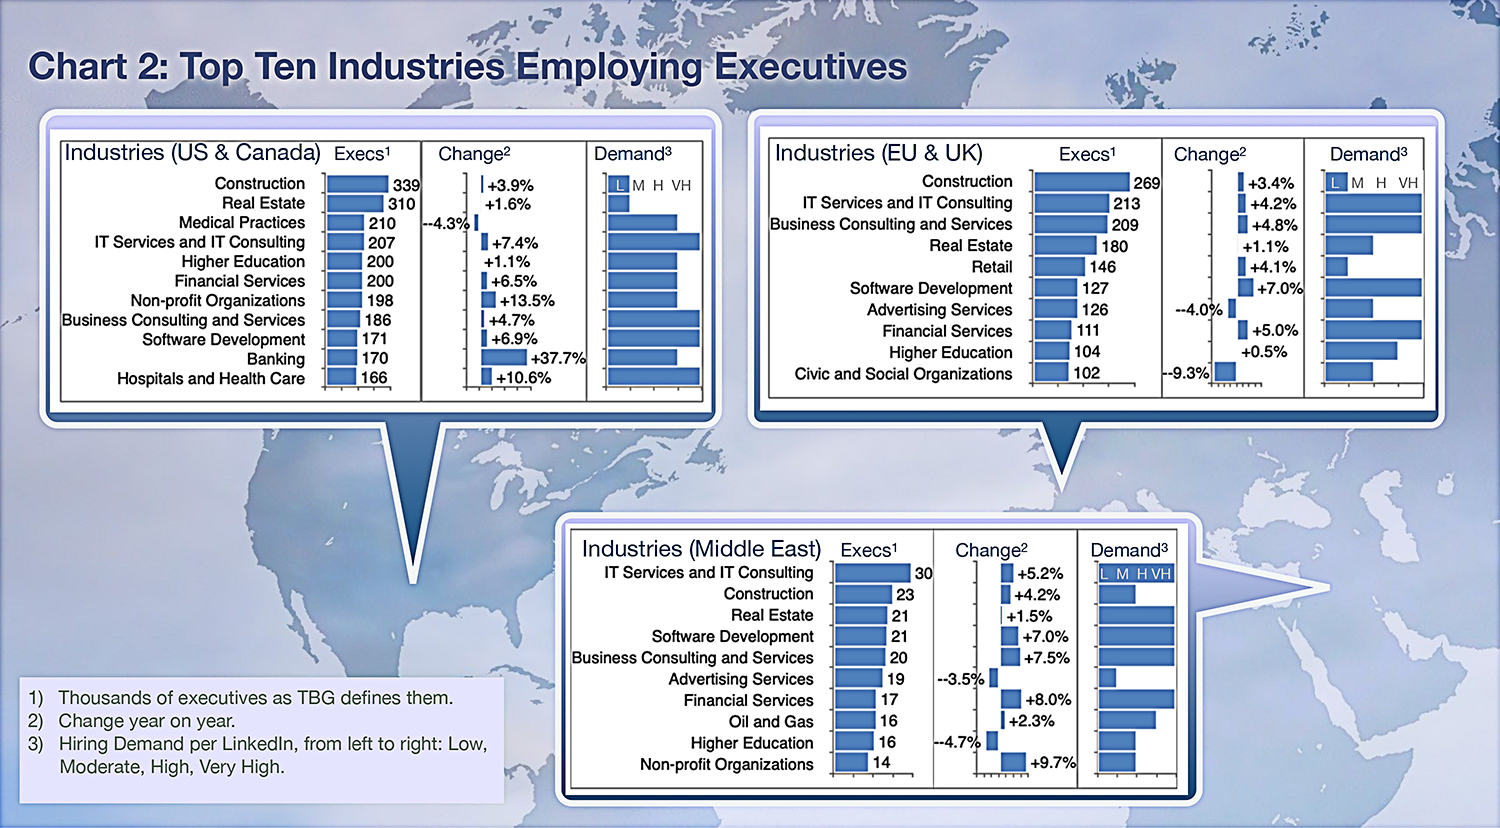
Chart 2 explores some regional variation in the top industries employing executives, their rates of growth and the future-oriented hiring demand as forecasted by LinkedIn. By way of explanation, Construction, for example, shows 3.4% or 3.9% growth in the EU/UK and US/CA cohorts respectively. But in both cases there is a low hiring demand outlook. In the Middle East, on the other hand, growth in this vertical is a little more robust (+4.2%) and the hiring demand is rated as moderate. The extreme growth in the banking sector also seems to be driven out of the US and Canada.
Executive Specializations
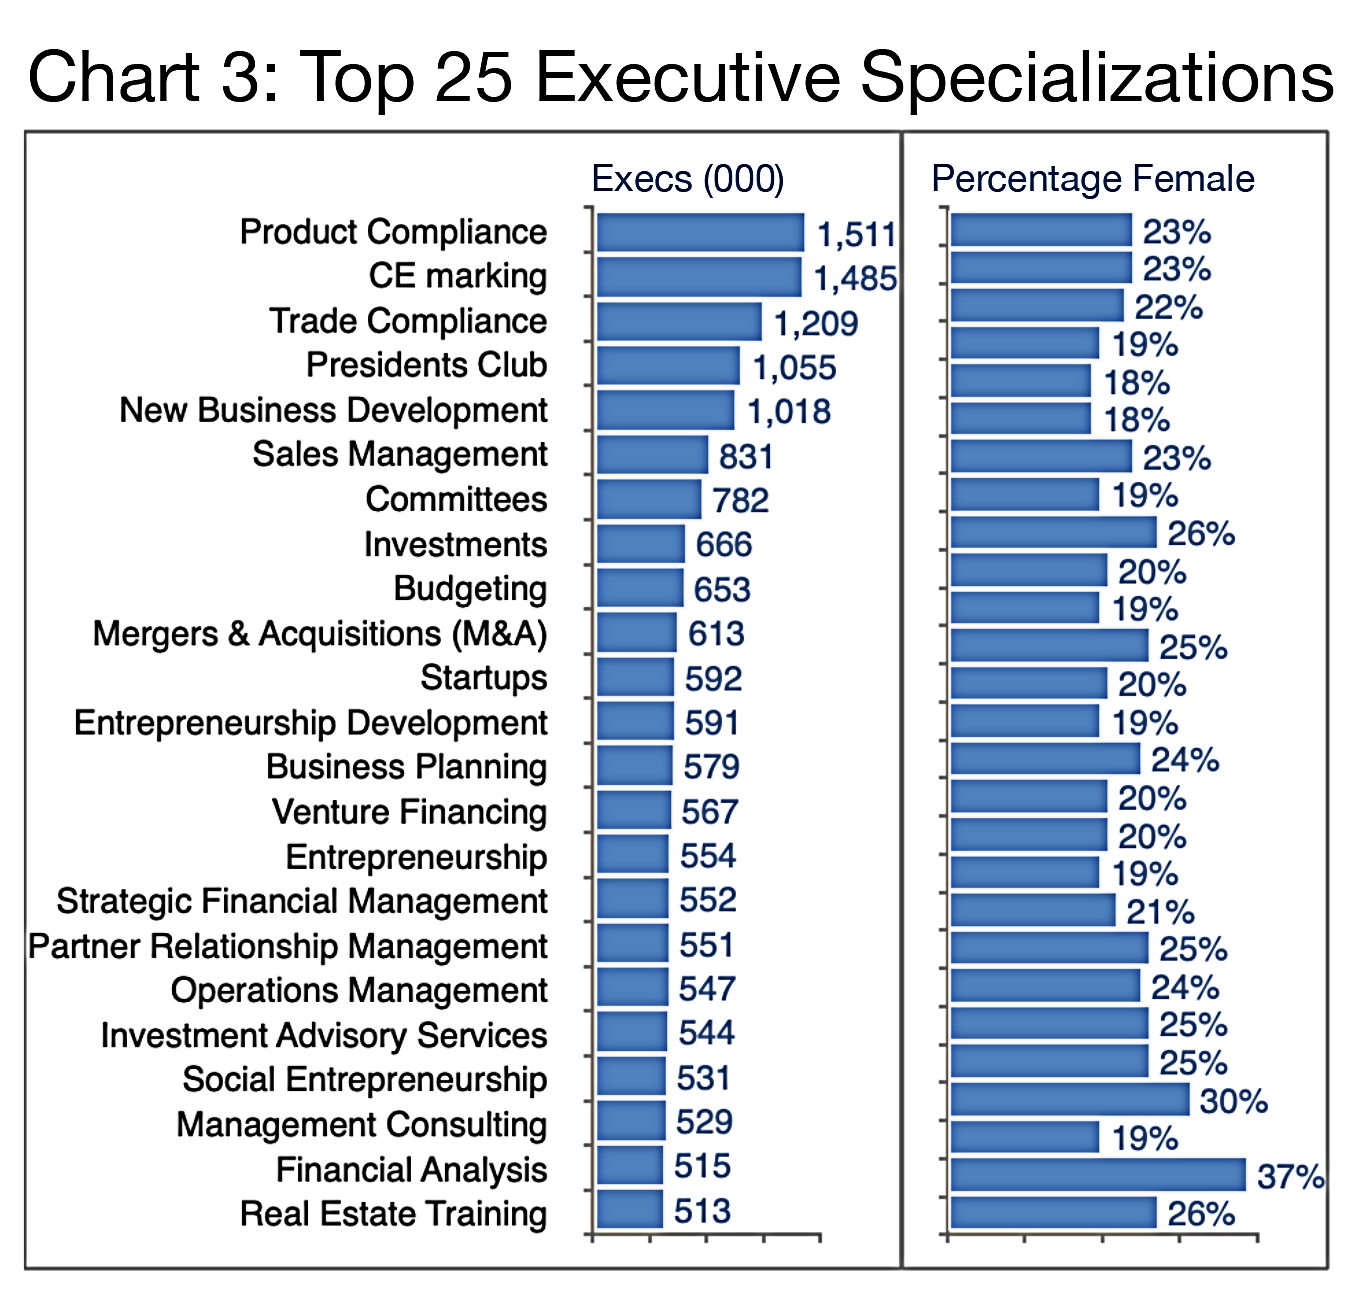
Beyond their primary career industry, executives also list numerous specializations or skills on their LinkedIn profiles. Chart 3 offers an overview of these in aggregate. Unfortunately, LinkedIn only hints at the relative demand in this sector by highlighting the number of help-wanted posts (on LinkedIn) per specialization. The top areas per this metric include Analytical Skills, Finance, and Budgeting, followed by Accounting and Risk Management.
Of course looking only at the help-wanted ads is like judging an iceberg without considering the mass below the waterline. TBG finds that 75% of our clients land new executive positions through the unpublished market. That is three times larger than the published market (want ads) and the recruiter market combined. [Read more about the unpublished market.]
| TBG’s clients benefit from significant research support whether at the early, screening industry stage, or later in their career change. |
Also in Chart 3 we highlight the relative share of female executives in each of these verticals, which, beyond the regional variation noted earlier, varies also considerably from a high of 37% (Financial Analysis) and 30% (Social Entrepreneurship) to a low of 18% (New Business Development or Presidents Club). There is nothing objectively constraining these shares. Cultural bias seems to drive these ratios more than anything else. [Read more about Female Executives.]
At the outset of each executive’s program TBG always encourages clients to take a broader look at their careers and consider where else their skills and experience may be more valuable or more in demand. The process of rendering an executive’s experience transferable is one of our many specialties. [Read more about transferability.] It is also key as we watch some industries flourish while others wither. Over our 34 years of helping executives transform their careers we have seen enormous change. And there is clearly more to come. Take the prospect of ubiquitous and inexpensive electricity, for example. How will that affect your industry and role? [Read more about electricity’s future.]
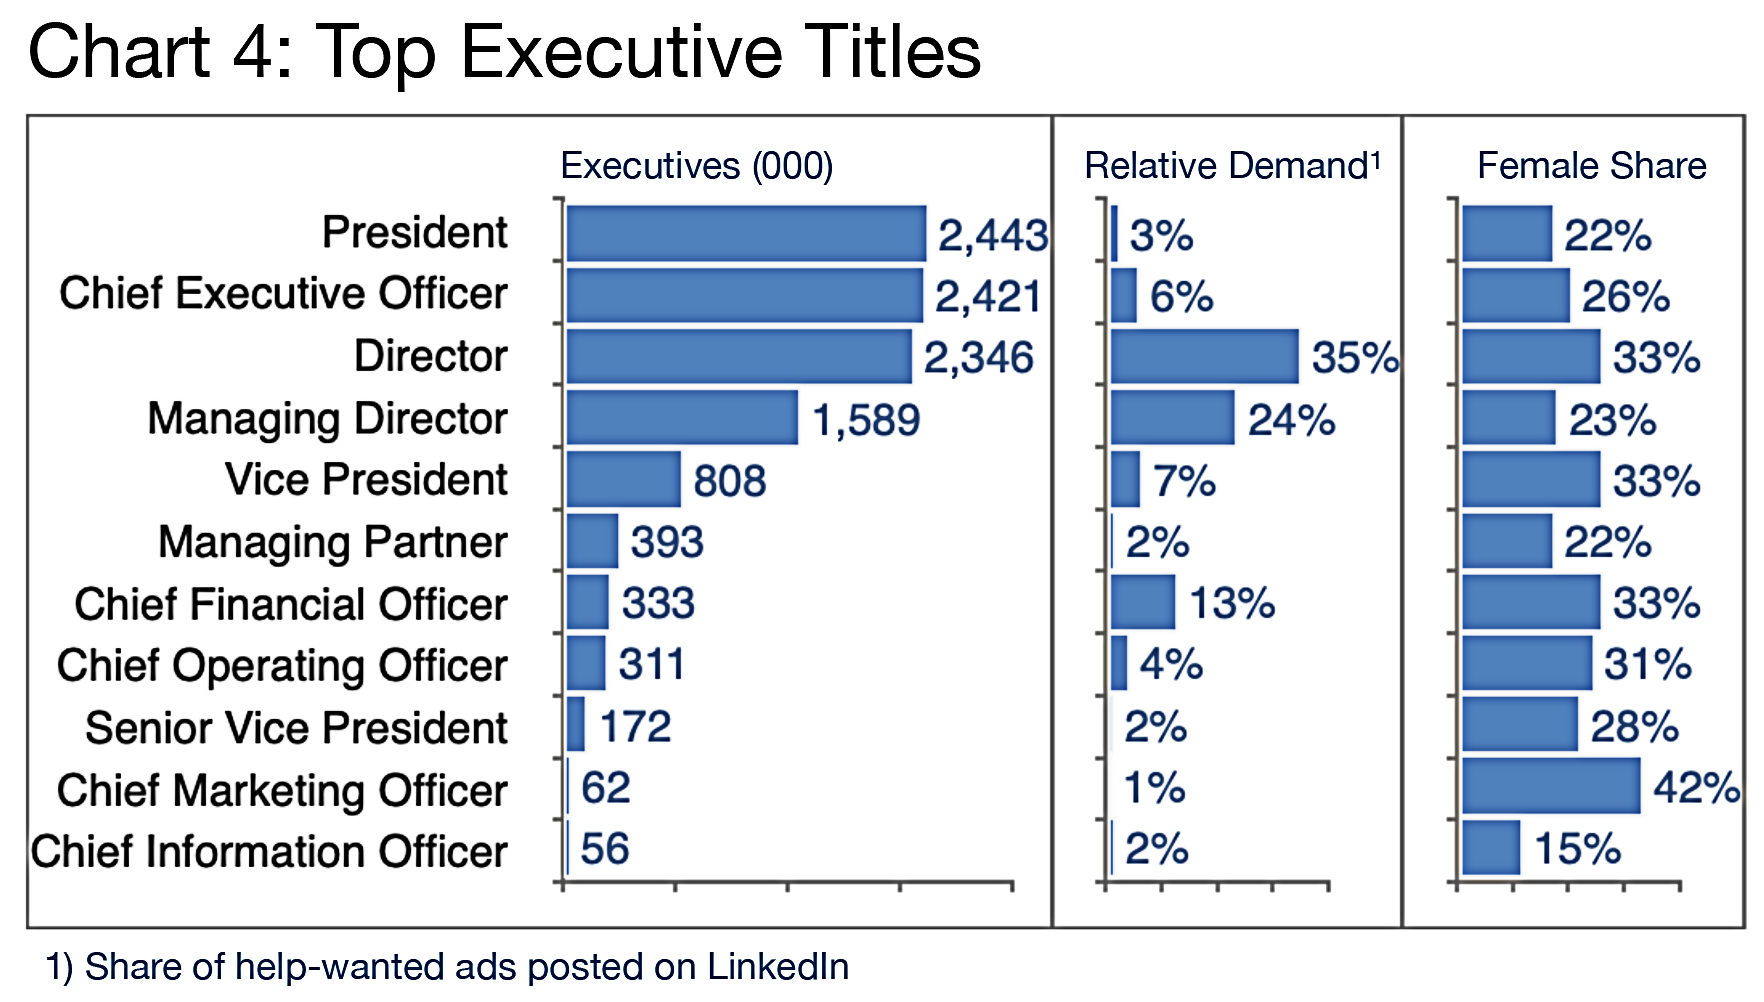
In Chart 4, one wonders why there are so many Presidents and CEOs in this cohort versus Directors or VPs. The answer is that much of this mixed industry group is comprised of smaller companies that may not have a Vice President level at all—smaller, flatter companies, so to speak. This is also one of the reasons they are hiring relatively a lot at the Director and Managing Director level. Though here too this demand is predicated only on the published market (want ads) whereas the actual market is usually as much as five times larger.
Industries Where Executives Are Landing
We also see consistent demand across virtually all industries for CFOs and financial and analytical skills in general. Though this, also, may be driven less by growth and more by a lack of qualified candidates.
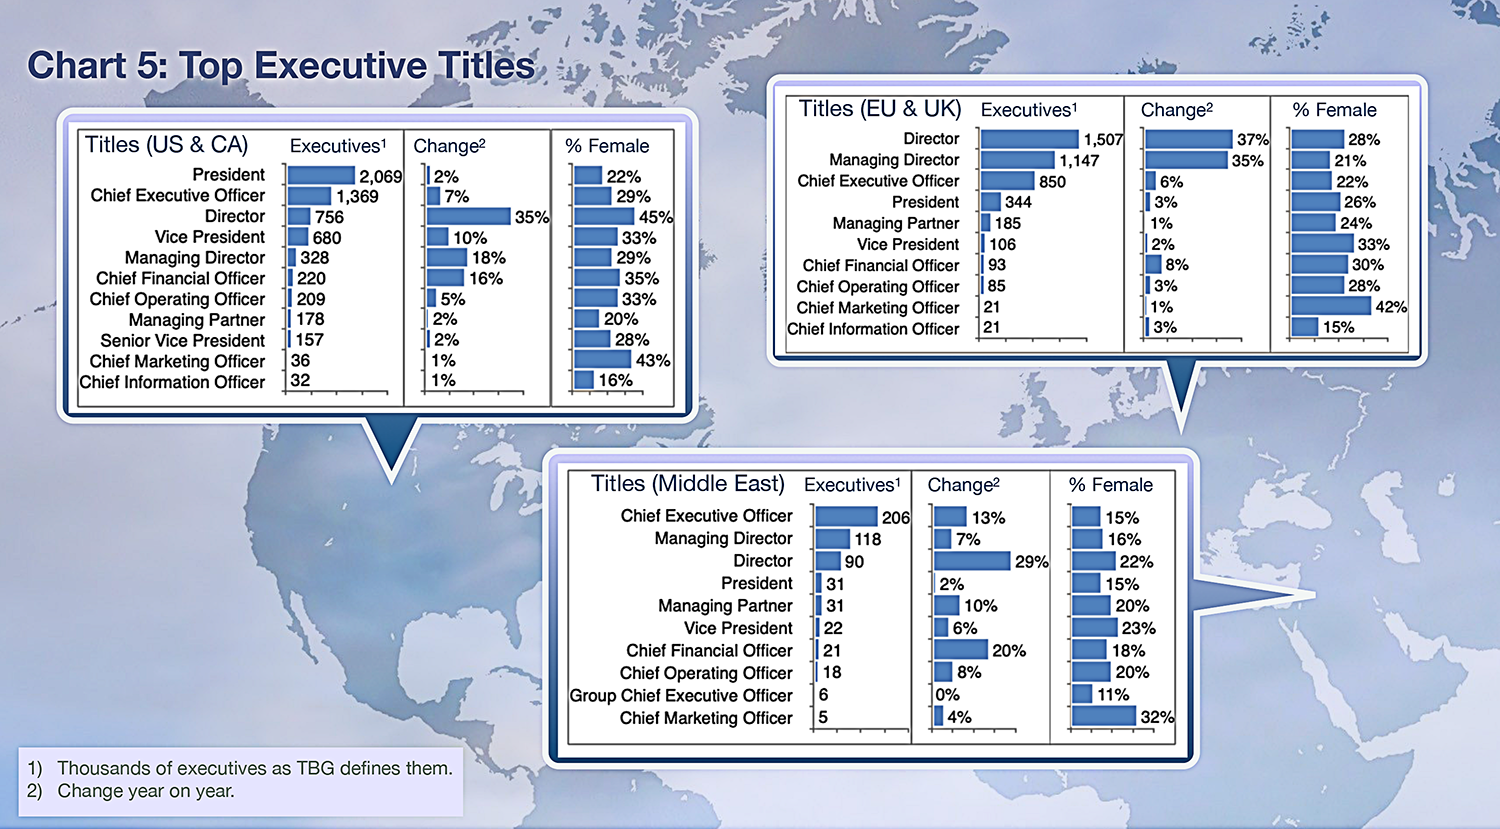
Clearly, women play an important role in the executive management of this cohort, reaching a peak in the Chief Marketing Officer role (42%) per Chart 4, but also in positions not specifically shown on the chart including Chief Human Resources Officer (66%), Co-President (41%), and Board President (38%). As we will see on Chart 5, there is considerable regional variation in these share, too. For example, according to a recent survey: “With an EU-wide average of around 35 per cent, only one in three management positions is held by a woman. In Germany, the proportion was even lower than the average, at just under 29 per cent.” [See source.]
Example Recent ResultsUnique in the industry, TBG publishes our clients’ successes each week on the Front Line Reports page where you can see exactly how our clients are interviewing, obtaining offers, and landing positions. Here is a snapshot as of August 2024 summarizing their achievements. About 45% of our clients so far this year are clearly senior management, being either C-level, VP of one flavor or another, Heads of functions, Managing Directors, General Counsels, or General Managers. Directors and Managers make up another 37%. [Read more about clients landing.]
|
Executive Titles
Comparing macro-regions, we see the relative concentration of the industrial landscape in the EU/UK (i.e., a lower number of CEOs and Presidents versus a higher number of Directors) versus the US and Canada where Presidents and CEOs predominate due to the prevalence of smaller firms. Of the 33.2 million companies in the US, for example, only 20,000 have more than 500 employees. [See source.] The Middle East also exhibits a smaller company structure with a high share of CEOs relative to other positions. There certainly seems to be growth at the Director level in all cases and to a lesser extent in the CFO role. As noted previously, female executives appear particularly common in the Chief Marketing Officer role, as well as at the Director level in the US and Canada.
Executive Geographies
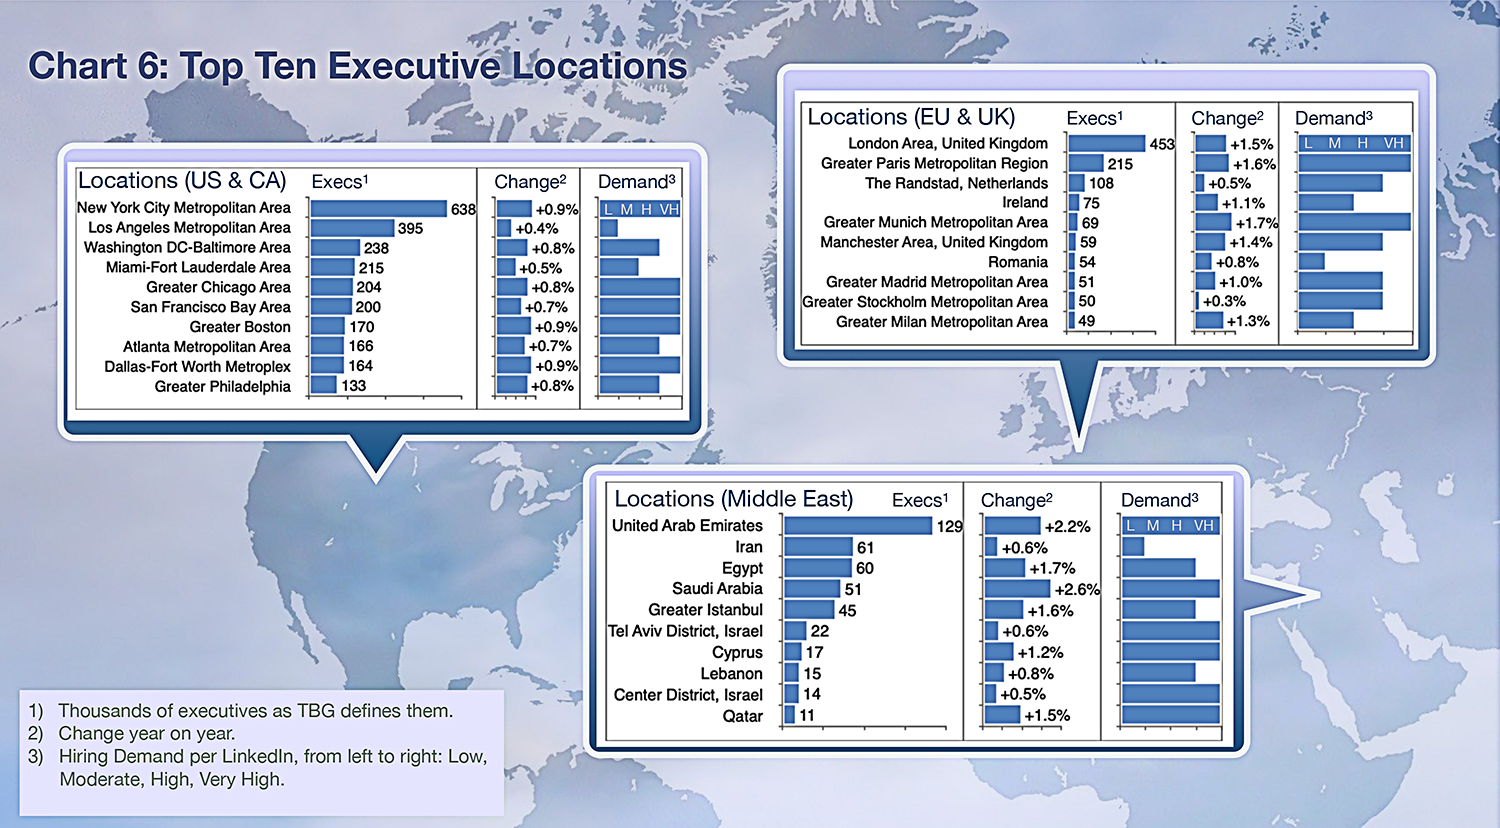
Locations (Chart 6) may be more a consequence than a driver for many executive positions, although with remote and hybrid positions growing rapidly, that may change over time. In fact, industry verticals themselves, and the top employers in each actually drive executive opportunity. We offer a short list of our latest Industry Updates below hoping that readers may also find these useful.
Editor’s Note:In this Update “executives” will generally refer to the Vice President, Senior Vice President, Chief Operating Officer, Chief Financial Officer, Managing Director, Chief Executive Officer, Chief Marketing Officer, Chief Information Officer, Managing Partner, General Counsel, Head, President and Director titles principally located in the US, Canada, Europe, the UK, and/or the Middle East. Unless otherwise noted, the data in this Update will largely come from LinkedIn and represents a snapshot of the market as it was at the time of the research. Is LinkedIn truly representative? Here’s a little data: LinkedIn has more than 1 billion users. (See source.) It is by far the largest and most robust business database in the world, now in its 20th year. LinkedIn Talent Insights data is derived by aggregating profile data voluntarily submitted by LinkedIn members. As such, LinkedIn cannot guarantee the accuracy of LinkedIn Talent Insights data. |
Peter Irish, Chairman
The Barrett Group
TBG’s Most Recent Industry Updates
Click here for a printable version of INDUSTRY UPDATE: A World of Executive Opportunity 2024


