
INDUSTRY UPDATE: Construction & Real Estate
Introduction: Construction & Real Estate
No doubt it would be possible to segment Construction and Real Estate as separate industries, however, the flow of executives back and forth between these spheres of activity means that from an executive market point of view, they are effectively one market with many pockets of specialization. That is why The Barrett Group (TBG) reports on them as one unified cohort.
Worldwide, the real estate market is expected to grow 3.9% to reach a value of $638 trillion in 2024, the largest segment being the residential sector at $519 trillion versus $119 trillion for commercial real estate. Total market value has grown an impressive 45% since 2020, in part due to post-pandemic recovery. Looking ahead, growth projections suggest a 3.4% CAGR (compound annual growth rate) through 2028, leading to a value of $729 trillion in that year (65% higher than in 2020). China leads the demand growth (with a market value of $136 trillion in 2024) but the US is also experiencing higher demand in the suburbs as remote working continues to gain traction. [See source.]
The US housing market remains constrained as higher prices and mortgage rates, low inventory, reluctant sellers, and frustrated buyers characterize the current conditions. “Existing-home sales in February were up 9.5 percent over January, but that still represented a 3.3 percent drop year-over-year.” Housing inventory stood at a 2.9 month supply in February, a value characteristic of a sellers’ market. An eventual reduction in realtors’ commissions due to a recent court case may offer some degree of liquidity, but a drop in interest rates if and when it comes would certainly stimulate the market. [See source.]
As a result, new home construction in the US has heated up despite higher interest rates. “Single-family housing starts nationwide are forecast to increase 4.7% this year and another 4.2% in 2025, reaching a pace of 1.3 million units, according to NAHB. […] Eighty percent of builders anticipate starting more homes this year, and 51% expect starts to increase more than 10% compared to 2023.” [See source.]
Not all sources are equally sanguine on the market’s prospects, however:
The Economist [Housing and climate change, April 13, 2024] points out that real estate as an asset class is the most important in the developed world, underpinning many financial markets. One source suggests it represents as much as 70% of the average investor’s portfolio. [See source.] As climate change turns the world’s property markets on their heads, this may represent a profound source of risk going forward. “At present the risks of climate change are not properly reflected in house prices. A study in Nature, a journal, finds that if the expected losses from increased flooding alone were taken into account, the value of American homes would fall by $121bn-237bn.” [The Economist, April 13, 2024].
Commercially, office space vacancy rates may well continue to sag, from a current 13% in the US as demand remains constrained due to remote working. One source suggests there could be some deep discounting in this market during 2024 with private equity snapping up attractive properties in key regional locations such as New York and Los Angeles. [See source.]
Retail space may fare better per this source as consumers in the US continue to spend blithely. Construction may slow but rents should hold up or even rise. Industrial and logistics space will probably cool off a little from 2023 as the last of the pent-up demand from the pandemic subsides. Data centers and energy projects will likely remain hot, driving new construction as well, powered in many locations by generous tax incentives. Apartment building in the US is seeing a surge in 2024 that will keep overall rent growth on the modest end of the spectrum. [See source.]
In Europe, there was virtually no growth in construction volume in 2023 (+0.1%) as high interest rates and a weaker economy constrained home buyers and the building sector. In 2024 there may be little immediate change, but order books in the EU construction industry remain strong with an average of 9.1 months of work and no visible decrease [See source]. Renovation and sustainability investments may well be filling in the gaps left by a lack of new projects.
After a period in the doldrums, house prices are also rising again in the EU, except for Germany, with the highest increases visible in the Netherlands, Spain, Poland and Austria among major markets. Tight demand and the passing through of inflation-driven cost increases seem to be driving this trend. [See source.] The same source also notes that construction costs apparently have slowed their rate of increase and appear to be leveling off. However, the next bottleneck may well be the forward-looking issuance of building permits which declined 14% in Q4 2023, for example, as builders remained reluctant to commit due to the uncertain market circumstances. Longer term, the endemic housing shortage in Europe and eventual easing of interest rates should help this overall market return to growth by 2025 at the latest. [See source.]
Germany remains a special case in Europe at the moment with construction spending falling for the first time since 2009.
“Construction volume will shrink by 3.5% in 2024 to 546 billion euros ($597.38 billion) before recovering slightly with a 0.5% increase in 2025…” Despite the first decline in residential price houses in decades, economic optimism fell in the most recent survey period: “…sentiment in residential construction dropped to -56.8 points in December, worse than -54.4 points in November. It was the lowest level since Ifo began tracking the index in 1991.” [See source.]
Infrastructure remains a bright spot in the EU, driven in part by economic stimulus investments:
The infrastructure sector is more resilient to the economic cycle as investment mainly comes from local or central governments. The EU infrastructure volumes have shown moderate growth in 2022 (2.4%) and 2023 (3.2%) which supports total construction volumes. And the subsector benefits from needed investments in the energy transition, especially for new power grids and investments in digital infrastructure such as fibre to the home. Challenges also arise in the field of drinking water, as population growth and climate change lead to more frequent dry periods in many places. [See source.]
In the Middle East, infrastructure projects are also driving a regional industry worth $87 billion to grow at an anticipated 5.29% (CAGR) through 2028. [See source.]
Economic conditions are priming the market for a construction boom but are also creating challenges including fluctuating costs and shortages of skilled labour. […] In the United Arab Emirates, the number of construction projects being released for tender continues to rise steadily. This is in part driven by a planned 34% increase in government spending on construction for 2024, and specifically, a shift towards greater investment in energy and public infrastructure projects, such as Al Maktoum Airport, Dubai Metro Blue Line, Hessa Street improvement, and Etihad Rail. Construction growth will boom in KSA too, with the implementation of the Saudi Arabia Giga Project program. [See source.]
Indeed, there is no shortage of infrastructure projects in the Middle East—including the Riyadh Metro, the Al Dhafra Solar Photovoltaic Plant, Expo 2020 Dubai, the Dubai’s Museum of the Future, King Salman Energy Park, etc. [See source.] This market will also be affected by broader trends in the Construction industry that one source summarizes as follows:
- Commitment to sustainability,
- Adopting AI and advanced technologies,
- Continued labor shortages,
- Unprecedented public spending,
- Elevated market uncertainties,
- Diversity, and
- Implementing advanced safety measures [See source.]
Deloitte, for example, offers this outlook for the US Construction industry addressing a number of the trends bulleted above:
[…] there could be a boost to construction associated with manufacturing, transportation infrastructure, and clean energy infrastructure, as funds from three key pieces of legislation passed in 2021 and 2022—the Infrastructure Investment and Jobs Act (IIJA), the Inflation Reduction Act (IRA), and the Creating Helpful Incentives to Produce Semiconductors (CHIPS) Act—are expected to flow into the industry.[…] As such, construction confidence remains high, with the Associated Builders and Contractors (ABC) identifying expectations for an increase in profit margins and staffing levels, particularly in the first half of 2024.[…] [See source.]
Staffing remains a key constraint on the Construction industry as remote work and high employment mean employees have more choice. The industry is responding with flexible working arrangements (per the “gig” economy), higher wages, cross-training and up-skilling initiatives, heavier focus on safety measures, and better use of robotics and automation. Additionally, “hiring a diverse workforce and attracting prospective employees from new sources of talent, including veterans, persons with disabilities, and returning workers, in addition to women and underrepresented ethnic groups, will widen the talent pool.” [See source.]
Sustainability is apparently not just a buzzword to attract investors but is making its way into the very substance of building materials according to Forbes. Developments include the use of concrete to capture carbon, eco-friendly building material (e.g., turning algae into limestone), reuse of industrial by-products in cement (e.g., steel slag), reusable construction materials, and 3-D printed construction components. Beyond material advances, real-time monitoring of projects helps eliminate waste and assure higher efficiency thanks to process digitization and the Internet of Things. [See source.]
Of course, artificial intelligence (AI) will likely also impact the Construction industry. How? Here are a few examples:
- AI may micro-optimize room layout to perfect specific metrics (air flow, energy use, natural light, etc.) either at the pre-design stage or later during actual construction;
- wearable technology allows AI to monitor worker behavior and avoid dangerous practices, enhancing worker safety;
- drones provide oversight on larger projects that AI can use to compare to plans and identify deviations and/or required changes ever earlier; and
- AI-aided autonomous equipment can automate repetitive tasks and better utilize human operators’ valuable time. [See source.]
As usual, change is the one constant governing the complex Real Estate and Construction industry. However, change means opportunity for executives as they consider what they want to do for a living. At TBG we help executives move fluidly between industries, roles, and geographies as their needs and desires evolve. Please bear that in mind when we now turn our attention to the men and women who guide and drive this dynamic marketplace.
The Market for Executives: Construction & Real Estate
Almost 1.3 million executives work in this industrial sector, up slightly (+0.3%) in the past year while some 31,000 changed jobs. That means 70,000 positions were either created or changed hands in this industry in the past year—a significant volume of executive opportunity! The US and Canada accounted for about 750,000 (+0.0%) executives and nearly half of the job changes. The EU and UK comprised 500,000 (+0.7%) and another 45% of the job changes. And the Middle East cohort numbered 51,000 (+0.4%) and a further 2,100 changes of role.
Men dominate this segment where only 17% of the roles are held by women (19% in the US and Canada, 16% in the EU and UK, and 12% in the Middle East). For all the discussion of diversity at the corporate level, change seems very slow in this sector. Perhaps the difficulty in hiring qualified staff will accelerate this evolution.
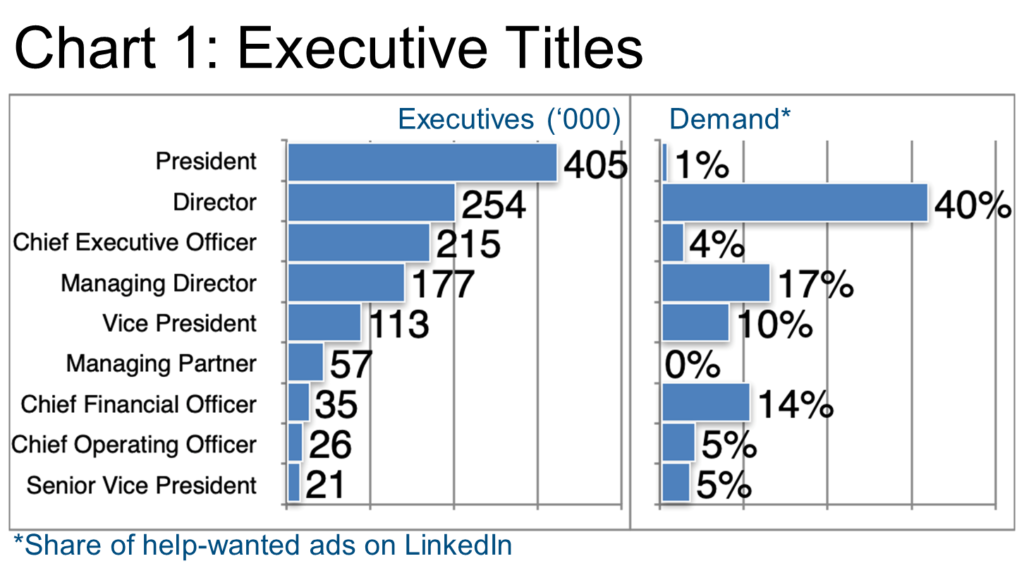
Chart 1 explores the titles these executives hold. When Presidents outnumber Vice Presidents readers will recognize that this industry is relatively unconcentrated (featuring lots of smaller companies). Nevertheless, the demand was principally for Directors, Managing Directors, and CFOs, the latter being the only role held substantially by women (34%) in the entire executive suite. Please note that “demand” in this context reflects only the published market on LinkedIn. Typically, TBG finds that this is as little as 15% of the total market. Most TBG clients land via unpublished opportunities with all the attendant advantages of more self-determination, higher compensation, and less competition.
Construction and Real Estate executives, of course, may be employed in other industrial sectors, for example, a retail chain will often have a commercial real estate executive responsible for its portfolio of locations. Charts 2A and 2B explore these sub-sectors.
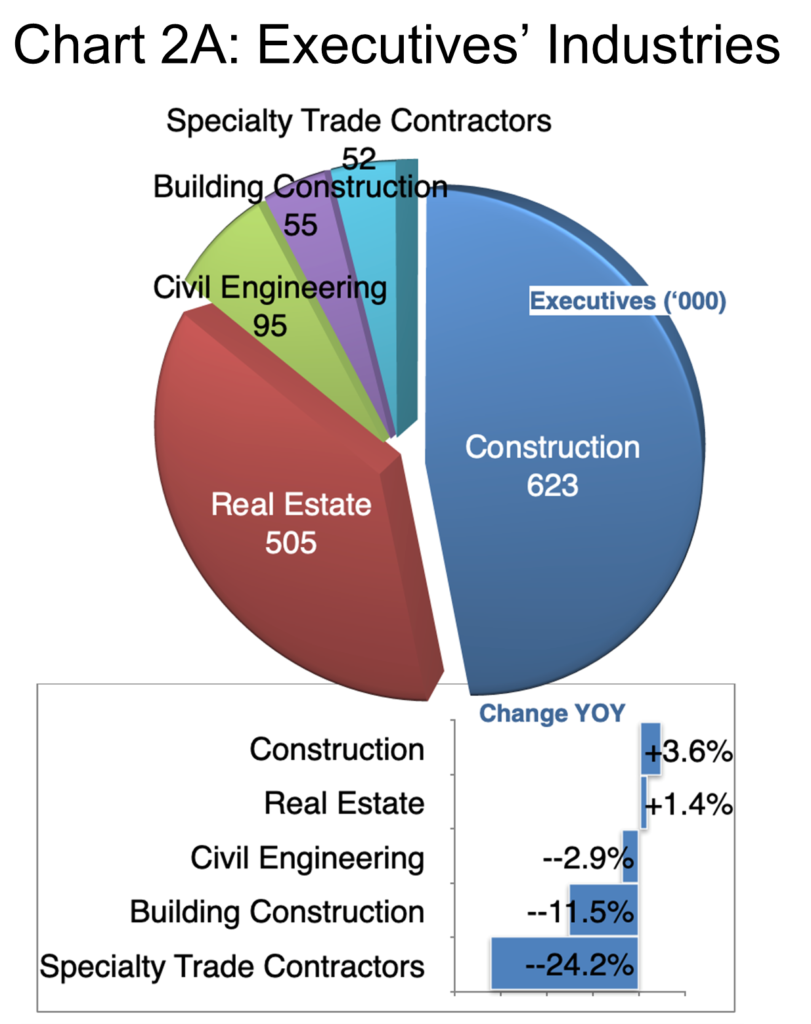
Chart 2A shows at a high level the largest segments in this overall market. Some 623,000, for example, work directly in Construction, a segment that grew by 3.6% in the past year. Apparently Building Construction and Specialty Trade Contractors had a particularly difficult year last year, shrinking by 1.5% and 24.2% respectively, though, no doubt, their skills were reabsorbed elsewhere. Additionally, contractors have been hit particularly hard by labor shortages and customers “passing the buck.” [See source.]
Per Chart 2A, the largest employers of executives in Construction include Turner & Townsend (UK), Gleeds (worldwide), and Ance (Italy); in Real Estate, JLL (USA), CBRE (USA), and Colliers (Canada); in Civil Engineering, Aecom (USA), Tetra Tech (USA), and Mott MacDonald (UK); in Building Construction, D.R. Horton (USA), Skanska (Sweden), and Turner Construction Company (USA); and in Specialty Trade Contractors, BlueSky Restoration Contractors (USA), PCL Construction (Canada), and Ellis Don (Canada).
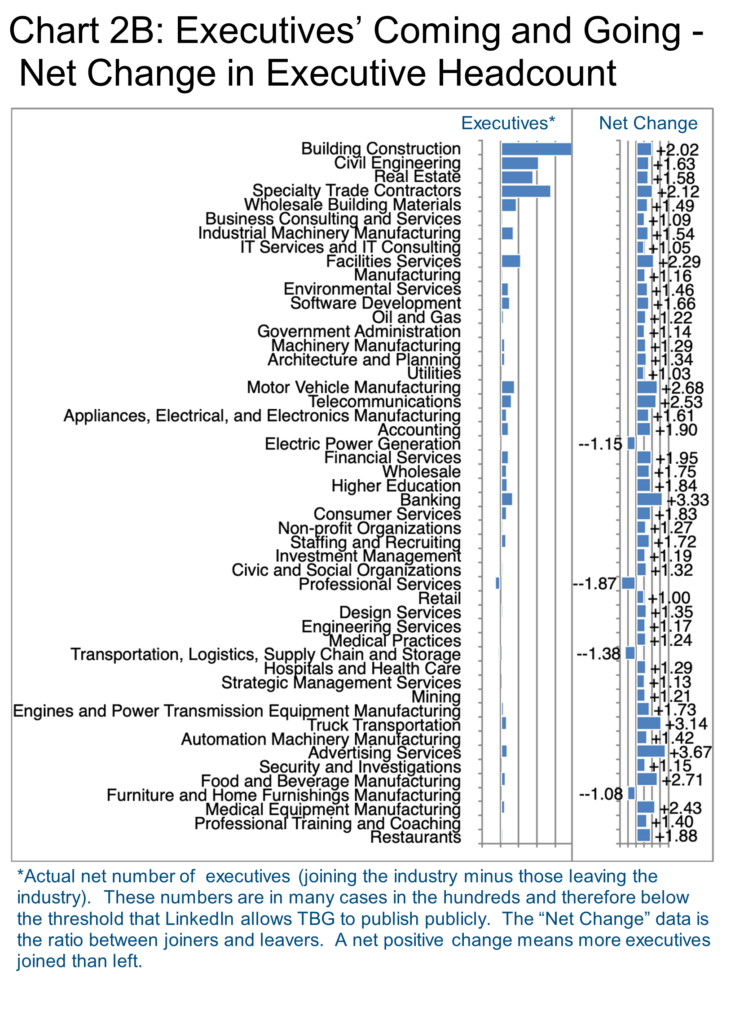
Chart 2B examines the net change in sub-sectors relevant to the Construction & Real Estate industry according to LinkedIn. Perhaps it is simpler to focus on the net negatives in this list because there are so many net positive changes. For example, Electric Power Generation, according to LinkedIn, saw a loss of 26% of its executives in the last year (roughly 5,000) who moved to other industries including Utilities, Engines and Power Transmission, and Oil and Gas, among others. The other industries with negative net changes are simply too amorphous to characterize at this high level. In other words, there were lots of smaller idiosyncratic changes without a simple, collective explanation.
It may be important for readers to realize that these Industry Updates are necessarily high-level, reporting on aggregate data to provide the “big picture.” TBG’s clients on the other hand receive access to literally millions of data points as part of their research service, typically first in the form of industry screening data to select candidate employers, and then increasingly detailed information as they home in on target companies and even hiring executives’ biographies ahead of key interviews.
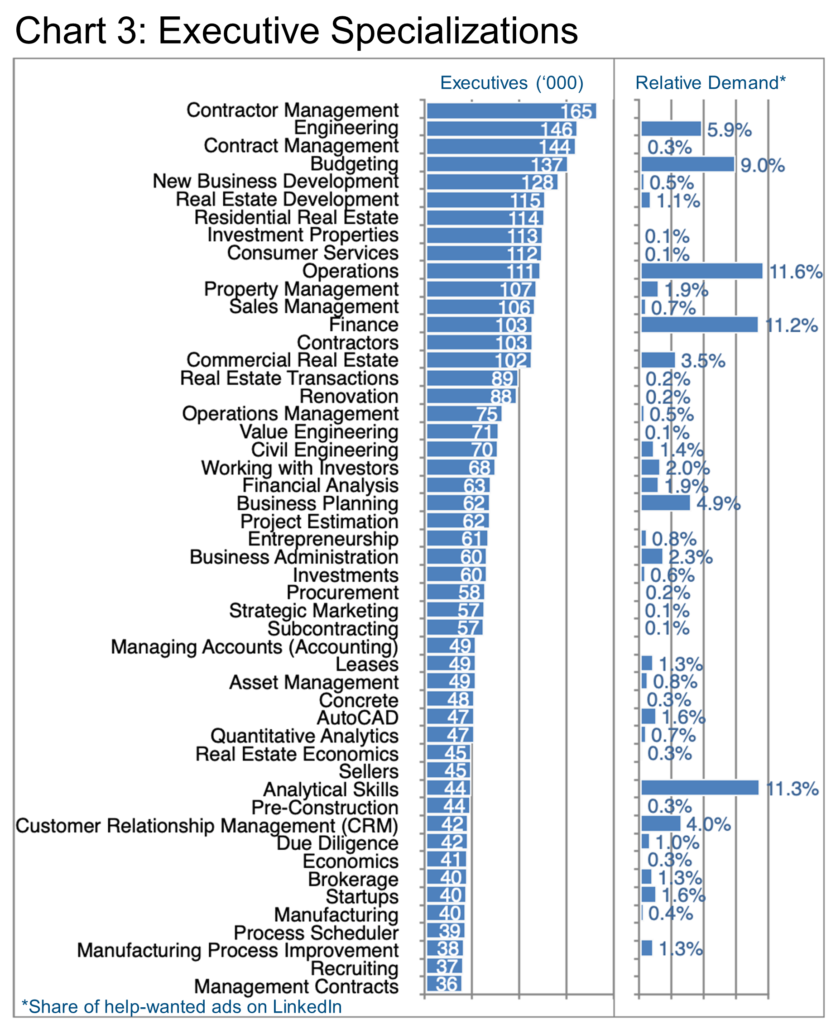
Chart 3 presents the special skills that executives cite in their LinkedIn profiles in this industrial segment, excluding the obvious such as “Construction” or “Real Estate”. Contractor Management, for example, was the single most common skill, with some 165,000 executives citing this in their profiles. Interestingly, this skill was not in high demand per LinkedIn, at least there were zero help-wanted ads noted during the past year for this skill as indicated in the “Relative Demand” column. Please note, that help-wanted ads are part of what TBG calls the published market. They are only about 15% of the total demand—far smaller than the unpublished market where most of TBG’s clients land. See the Success Story of one such Construction industry client (Kwasi Asare) below who also landed through the unpublished market.
Lately, there is some consistency across industries in the demand for specializations. Budgeting (9% of relative demand), Finance (11.2%), Business Planning (4.9%), and Analytical Skills (11.3%) are all representative of this almost universal demand for numerate executives with analytical skills. This suggests that executives with such skills can change industries with relative ease if they are supported by TBG who brings more than 30 years of experience to bear in repackaging executives’ skills so that they are clearly transferable from sector to sector.
Other skills in Chart 3 are more industry-specific, such as Engineering (5.9% of relative demand), Operations (11.6%), and Commercial Real Estate (3.5%). Remember, this is only the published market demand!
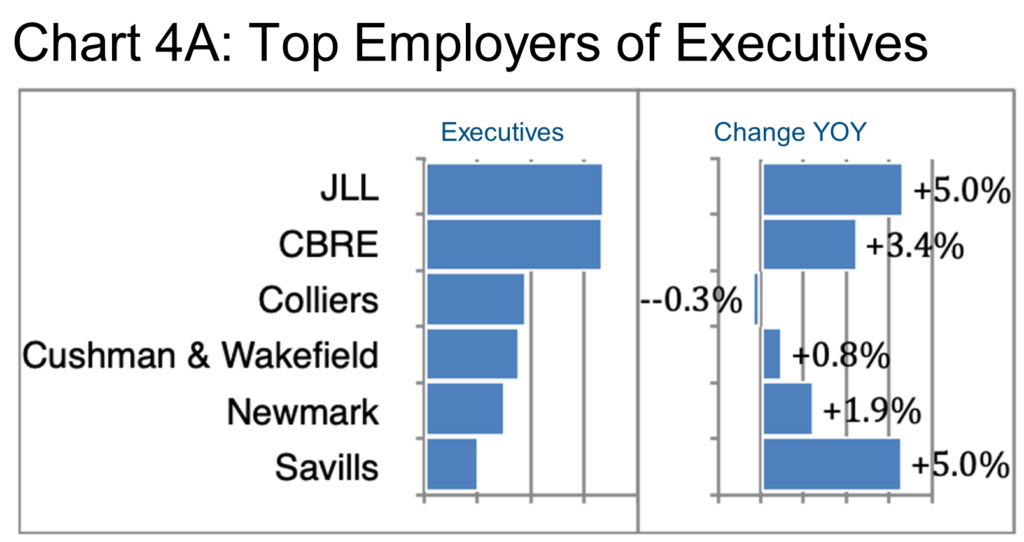
Now let us consider who employs all of these executives. Six top employers have between one thousand and three thousand executives each (Chart 4A). Digging deeper, it would appear that JLL’s (Chicago, USA) focus is on being recognized as a sustainable and ethical company based on their most recent press releases [See source.]. Their 2023 financial results suggest they are also navigating the industry’s pitfalls skillfully:
“JLL’s fourth-quarter and full-year 2023 operating results reflected strong growth within our resilient business lines in the face of the market-wide pullback in transaction activity and elevated geopolitical uncertainty. With a focus on operating efficiency, we drove improved cash generation while continuing to invest in our platform,” said Christian Ulbrich, JLL CEO. [See source.]
Continuing down the list in Chart 4A, CBRE (Dallas, USA) offers rather similar accolades to JLL, focusing also on sustainability and ethical practices, touting itself as “the world’s largest commercial real estate services and investment firm” based on 2023 data. CBRE is also actively acquiring, most recently, J&J Worldwide Services, a provider of hospitals and clinics which “primarily serves the U.S. Department of Defense through long-term, fixed-price contracts.” [See source.]
Apparently layoffs were common among real estate brokerages in 2023, and Colliers (Toronto, Canada) incurred $27.7M in restructuring costs in 2023 as it sought to tighten its belt. [See source.] For the full year 2023, “revenues were $4.34 billion, down 3% (3% in local currency) and adjusted EBITDA (note 1) was $595.0 million, down 6% (6% in local currency) versus the prior year.” Their full release catalogs changes in the Americas, EMEA, and Asia Pacific illustrating the joys and sorrows of operating as a multi-national, worldwide enterprise. [See source.]
Cushman & Wakefield (Chicago, USA) saw revenues decline in 2023: “Revenue of $9.5 billion and service line fee revenue of $6.5 billion for the year ended December 31, 2023 decreased 6% and 10%…” Their CEO had this to say about the performance: “To strengthen the core of our business and position the Company for long-term growth, we completed two debt refinancings, improved free cash flow, and reduced costs. We remain focused on unlocking meaningful value in 2024 and beyond by continuing to provide insightful advice, specialized expertise and disciplined execution for our clients.” [See source.]
Newmark (New York, USA) also saw revenues decline in 2023, down 8.7% on prior year, apparently weighed down by its investment (-37.1%) and commercial real estate operations (-22.1%). Their CEO nevertheless struck a bullish note, commenting “Already in 2024, we hired the preeminent affordable housing team, some of the most prolific and experienced debt and structured finance professionals, as well as one of the most innovative and active U.S. leasing teams. By empowering our extraordinary talent with world-class research, data analytics, and technology, they bring their best to Newmark’s clients. We refuse to let complacency impede progress in this rapidly evolving industry, we champion the entrepreneurial spirit.” [See source.]
Lastly on Chart 4A, Savills (London, UK) reported a modest decline in total revenue for 2023 (-2.6%). Their Chairperson summarized the results as follows, “…the strength of our less transactional businesses underpinned Savills performance overall, growing revenue by 7% to £1.5bn. Prime drivers of performance were Consultancy and Property Management, which performed well, growing revenue by 4% and 11% respectively. […] The Group’s Transactional business experienced a 17% drop in revenue during the year as global market conditions remained extremely subdued for longer than anticipated at the start of 2023. This was the primary cause of the 42% reduction in the Group’s underlying profit of £94.8m…” [See source.]
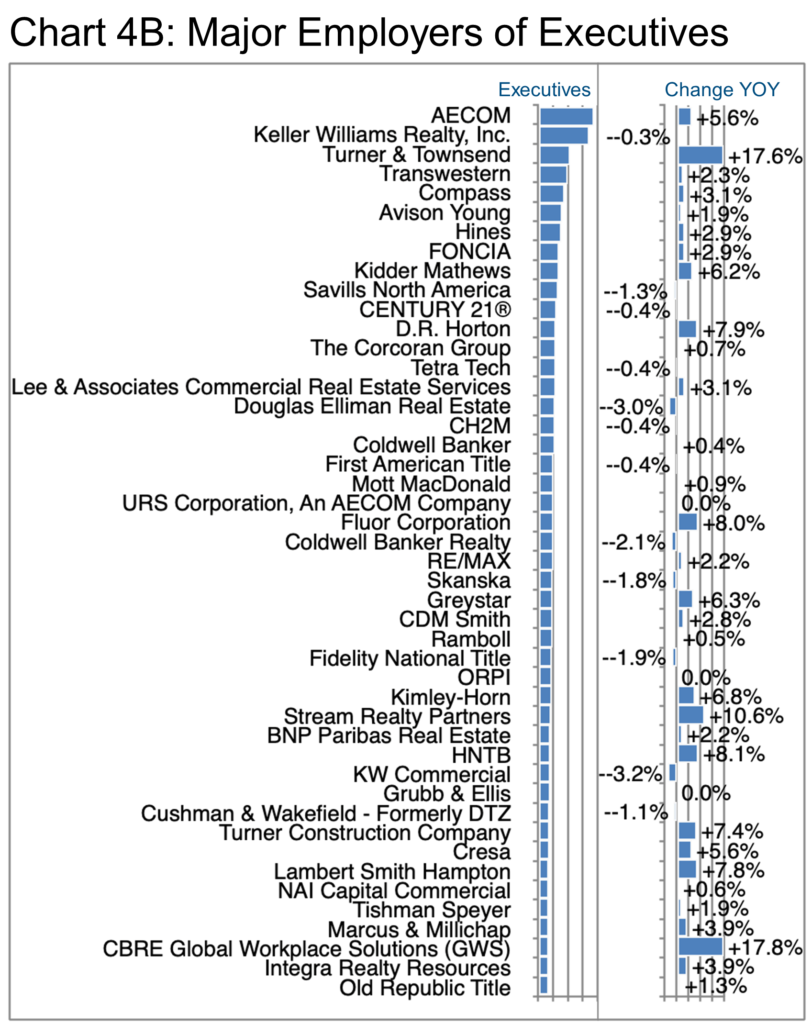
Chart 4B adds the remaining major operators in this industry whose executive ranks typically lie below 1,000 (for which reason TBG is not at liberty to reveal the specifics in a publicly available form). Still, readers can easily glean an understanding of who is who and how their respective executive ranks have developed over the past year.
Turner & Townsend (Leeds, UK, 60% acquired by CBRE) stands out in Chart 4B, as do their 2023 results: “Turner & Townsend’s income broke the £1bn mark in 2023, with the consultant’s turnover and profit both growing more than 30%. Global turnover for the year ending 30 April 2023 was up 39% to £1.2bn, while pre-tax profit hit £155m – up 37% from the £114m recorded the year prior.” The company reports that, “Work in the natural resources market accounted for the highest year-on-year growth – up 53% – reflecting significant renewable energy and decarbonisation projects.” [See source.]
Stream Realty Partners also added significantly to their executive ranks, claims it had its best year ever in 2023, and has continued to invest in its executive team while improving diversity. “Stream has further strengthened its executive team through key strategic hires. Ariella Middlebrook steps in as the new Chief Financial Officer, while Kate Lengyel assumes the role of Chief Human Resources Officer.” [See source.]
Finally, on Chart 4B, CBRE Global Workplace Solutions added 17.8% to its executive team in the last year. Acquired by CBRE in 2015 and merged with CBRE’s internal Occupier Outsourcing services business, the unit became one of three strategic divisions for CBRE in 2019, and now provides outsourced services to CBRE’s tenants, among other services. [See source.]
In an interesting piece of research, the company writes: “…office space utilization rates, which measure the actual use of space, remain under 40%, a 45% decrease from the pre-pandemic global average of 64%. This suggests that office attendance has plateaued, exposing an imbalance of space supply and demand that will not simply resolve itself without purposeful action such as well-communicated changes to hybrid policy, workplace experience improvements that attract more employees to the office or further reductions in portfolio size.” [See source.] No doubt part of the implied right-sizing exercise for many occupants will be the utilization of outsourced resources instead of funding their own headcount.
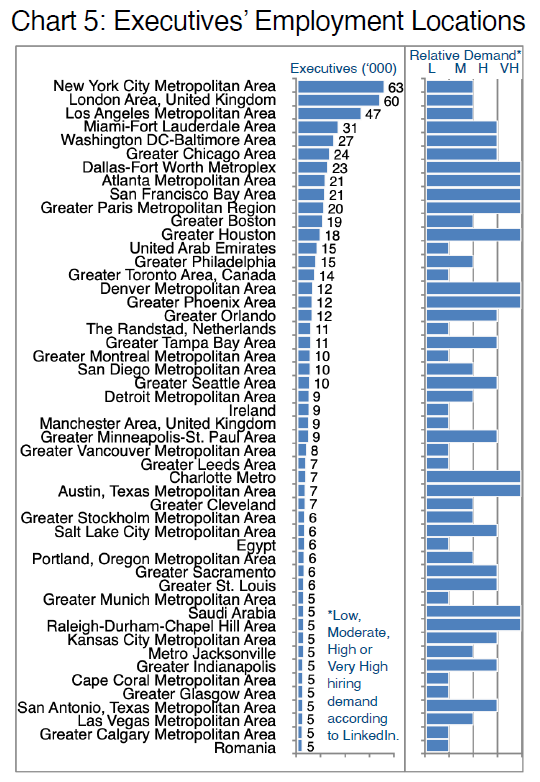
Chart 5 opens the subject of where executives are employed. Note that the CBRE source quoted above also says that many companies who insist on employees being in the office a minimum number of days per week do a poor job of enforcing this policy. In other words, the phrase, “location of employment” should perhaps be taken with a grain of salt, so to speak.
New York also features the top three employers of executives in this industry (JLL, Newmark, and CBRE) as the largest in this location. The total population did not grow appreciably in the past year and the hiring demand is rated by LinkedIn as moderate.
In London, Savills, JLL, and CBRE top the bill, but again, the location shows little recent growth in executive headcount and only moderate hiring demand. Los Angeles also offers CBRE, JLL, and Newmark as the biggest executive employers, little immediate growth, and moderate hiring demand.
Miami has also not grown recently in total, though it does show a high hiring demand. It adds Colliers in third place behind JLL and CBRE in the employers’ ranking. Washington DC and Chicago also rate high on hiring demand and have had roughly 1% growth in the past year each. JLL, Cushman & Wakefield, and CBRE top the employers’ list.
Dallas, Atlanta, San Francisco, and Paris all report very high hiring demand though probably for very different reasons. Remember please that demand can be due to growth or to constrained supply. In these cases, it looks rather like the latter. Briggs Freeman Sotheby’s International Realty in Dallas join the top employers ranking behind JLL and CBRE. In Atlanta and San Francisco, the ranking shows CBRE, JLL, and Cushman & Wakefield as the top employers, while in Paris, FONCIA, ORPI, and Egis lead the ranking.
Houston, Denver, and Phoenix all show similar very high demand and a very familiar list of top employers (CBRE, JLL, Newmark and Cushman & Wakefield in various sequences).
A Tale of Two Cities
Property development strategies matter enormously to society.
In the 20-teens, San Francisco focused on attracting businesses through tax breaks and incentives to help the city thrive. [See source.] While the stimulus worked in the short term, when Covid arrived things quickly went into reverse. The city has seen property values plummet due to the pandemic, the rise of remote work, an office space glut, and a general exodus from the state which has lost 1.5 million inhabitants since 2020.
The median price of single-family houses In San Francisco dropped to $1.45 million in December [2023], down by 29.6%, or by $610,000 from the nutty peak in March 2022, and below the Decembers in 2022, 2021, 2020, 2018, and 2017, which was six years ago… [See source.]
San Francisco’s office vacancy rate hit yet another record high this month [March 2024], climbing to 36.6%, as leasing activity remains muted. The vacancy rate was up 1 percentage point from the end of last year and jumped from 29.4% from the first quarter of 2023, according to preliminary data from real estate brokerage CBRE. [See source.]
Detroit, on the other hand, once seen as part of the “rust belt” as manufacturing businesses moved overseas, seems to have found a path to rejuvenation.
[In Detroit] [r]ock-bottom office rents long ago forced developers to come up with other things to build. They added casinos and sports venues and restored aging theaters. That made downtown less office-dependent, an advantage in the age of remote work. [See source.]
The city’s developers converted many commercial properties into apartments. These attracted smaller businesses and cafes.
The city’s residential market is also taking off. Home prices in the area are up 40% since 2020, and last fall had the steepest rise among major U.S. metropolitan areas. The number of apartments downtown has more than doubled to 5,903 since 2010, according to the Downtown Detroit Partnership. [See source.]
Construction Industry Success Story

Kwasi Asare – A 20-year veteran of the company, Kwasi was unprepared for unemployment when the Covid crisis forced corporate restructuring upon the company, eliminating his position.
“I’d never been terminated or laid off. I threw together my resume and sent it to people I had worked with in the past. And I started applying to places and I signed up for help from a bunch of executive search firms. I just jumped into it, ignorant of the process. It was not a coordinated or focused approach.” [Read more.]
Peter Irish, Chairman
The Barrett Group
Click here for a printable version of Construction & Real Estate 2024
Editor’s Note:
In this Update “executives” will generally refer to the Vice President, Senior Vice President, Chief Operating Officer, Chief Financial Officer, Managing Director, Chief Executive Officer, Chief Marketing Officer, Chief Information Officer, Managing Partner, General Counsel, Head, President and Director titles principally located in the US, Canada, Europe, the UK, and/or the Middle East. Unless otherwise noted, the data in this Update will largely come from LinkedIn and represents a snapshot of the market as it was at the time of the research.
Is LinkedIn truly representative? Here’s a little data: LinkedIn has more than 1 billion users. (See source.) It is by far the largest and most robust business database in the world, now in its 20th year. LinkedIn Talent Insights data is derived by aggregating profile data voluntarily submitted by LinkedIn members. As such, LinkedIn cannot guarantee the accuracy of LinkedIn Talent Insights data.


