INDUSTRY UPDATE: Private Equity & Venture Capital
Introduction
There is no question that 2023 has been a complicated year for the Private Equity (PE) and Venture Capital (VC) industry. Here are a few headlines from S&P Global for the first nine months of 2023 [See source.]:
- “Global private equity fundraising remained sluggish as total capital raised in the first nine months of 2023 amounted to $675 billion, a 14% decline compared to the same period last year.”
- The value of intra-regional deals announced fell by 39% in 2023 vs. 2022 to $232.8 billion while the announced deal volume fell by about 38% to 9,595.
- Of the top three sectors, Information Technology’s deal volume declined by 49% to 4,794, Health Care by 39% to 1,937, and Industrials by 33% to 1,819. Real Estate fared the worst, down by 68% to just 90 deals.
Deal value looked quite different, though:
- Information Technology attracted $106.7 billion—down 46%,
- Industrials received $56.1 billion—down 49%,
- Health Care absorbed $48.9 billion—off 47%,
- Financials stayed relatively strong at $46.2 billion—down just 22%,
- Communication Services attracted $22.6 billion—off 47%, and
- Consumer Discretionary was down by 63% at $18.1 billion.
- At 36% versus prior year, Real Estate collected $7.4 billion, and
- Energy received $5 billion—down 50% on prior year.
The same source reports on principal emerging sectors in 2023 that are attracting more investment, including Artificial Intelligence and Machine Learning, Fintech, Oncology, Network Security, and Web3 in the top ranks with some variation between macro-geographic regions. Somewhat surprisingly, electric automobiles and energy storage only placed in the top fifteen sectors in one region—Asia.
Ernst and Young [See source.] provides a compact sampling of some of the more important trends underlying the results we have highlighted as follows:
- While “take-privates” represented a large share of PE deals in the first half of 2023, corporate “carve-outs” made up one-third of deals in Q3 “…with an aggregate value of nearly US$25b (in contrast, Q1 was just 5% carve-outs). For PE firms — especially the largest funds — these deals can be competitive differentiators, providing opportunities for firms to leverage their scale and their operational expertise to drive value.”
- Two-thirds of PE investors surveyed recently expect deal volumes to accelerate into 2024.
- Technology remains a clear PE investor focus but Health Care is also gaining in importance. Services, too, are attracting attention. The Consumer and Retail sectors appear by the same measure to be the least interesting.
- PE exits have been delayed by the macroeconomic situation leading to longer holding periods so that the focus on operating efficiency has increased, for example, in minimizing working capital: “80% of the PE professionals surveyed indicated they’re paying more attention than usual to helping companies get visibility into cash and liquidity needs.” [See source.]
Needless to say, the results that major PE firms have been able to post recently are deeply affected by their sector exposure.
Here are two examples from the Economist (November 11, 2023):
“Carlyle, a private equity giant, reported a disappointing set of results for the third quarter. Investors have committed less capital than it had hoped to its new buy-out funds. In the three months to September they attracted $6.3 bn of new assets, an 11% decline from the previous quarter. The firm is shedding jobs and has warned staff that “every single expense is on the table.””
“KKR, a competitor of Carlyle, was much more upbeat. It reported an improvement in fundraising during the third quarter, to more than $14 bn, and announced the launch of new buy-out funds in America and Asia. KKR’s share price finished results day 5% higher than it started.”
Private Equity International has this to say about its top 300 list this year [See source]:
“A returning winner takes the PEl 300 crown this year, dethroning KKR after its first win in 2022. Blackstone raised a whopping $125.6 billion over the past five years, marking the sixth time it has come out on top over the past decade. Its total is a 52 percent increase on last year, when it came in $44 billion below KKR’s all-time PEl 300 record of $126.5 billion.”
“The top 300 private equity firms raised $3.13 trillion between them, marking a jump of $530 billion from last year. It’s clear, then, that the fundraising lull ongoing in the private markets hasn’t made a dent in firms’ long-term tallies just yet.”
It seems safe to say that the effects of the 2023 chill in PE fundraising were not equally distributed. There are clear winners and losers. However, let us now turn our attention to how this has affected the executive population working in this dynamic industry.
The Market for Executives
Excluding portfolio companies, some 142,000 executives work primarily in this industry, a group that grew by 3% in the past year while another almost 8,000 changed positions so that the total executive opportunity reached circa 12,000 jobs. LinkedIn cites this group in general as having a very high hiring demand. The industry includes only 24% female executives.
PE & VC executives in the US and Canada number 104,000, in the UK and EU, 33,000, and in the Middle East almost 5,000, the latter territory exhibiting an over-proportionate 7% growth from a small base. Of course, these tallies exclude another significant group of executives who actually operate PE & VC portfolio companies. Last year we attempted to quantify that executive population, too, and concluded that “we arrive at approximately 75,000 executive positions. Keep in mind this covers only the top 300 PE companies who raised at least $1.85 billion in the past year. The total number of executives at PE portfolio companies could well be 3 or 4 times that assumption—a huge population of executives probably with a normal turnover and a faster-than-average growth rate.” [See source.]
In any case, there is unfortunately little qualified and aggregate data available at the portfolio company level, so here we will continue to look only at the executives working at PE & VC companies themselves.
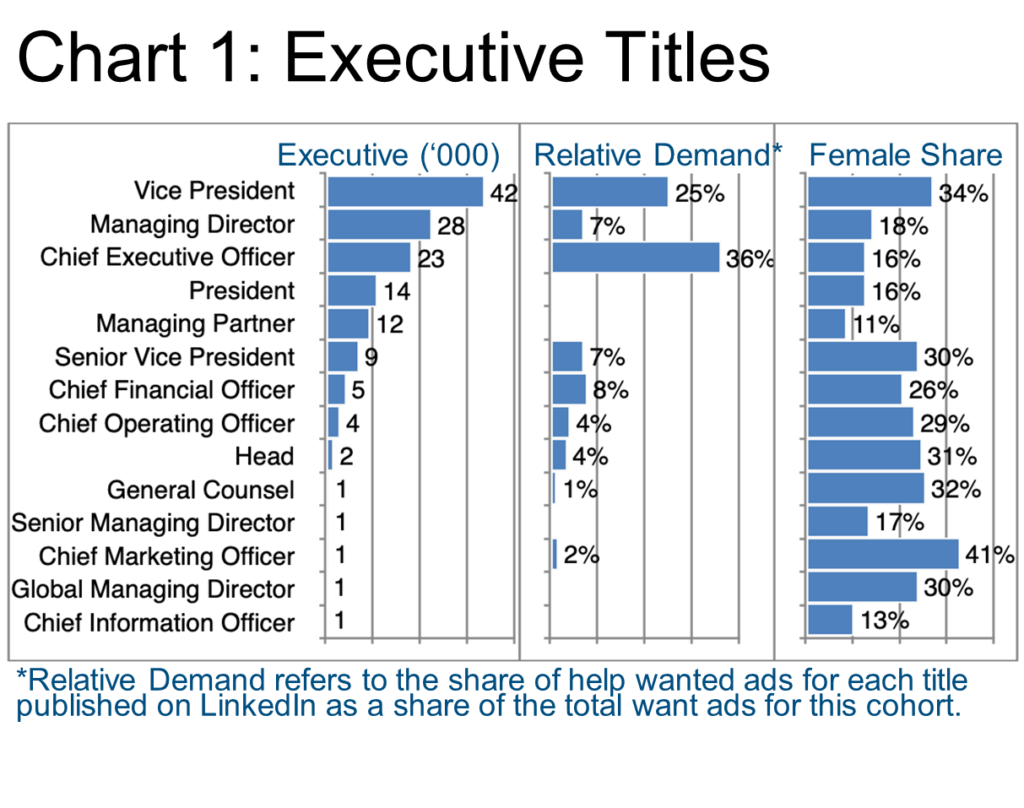
Clearly this is a more concentrated sector than many that we review. The ratio of VPs to CEOs gives this away. There seems to have been significant demand for the top three titles based on the relative demand cited by LinkedIn. The female executive shares still lag other industries here, with the usual exception of the marketing responsible.
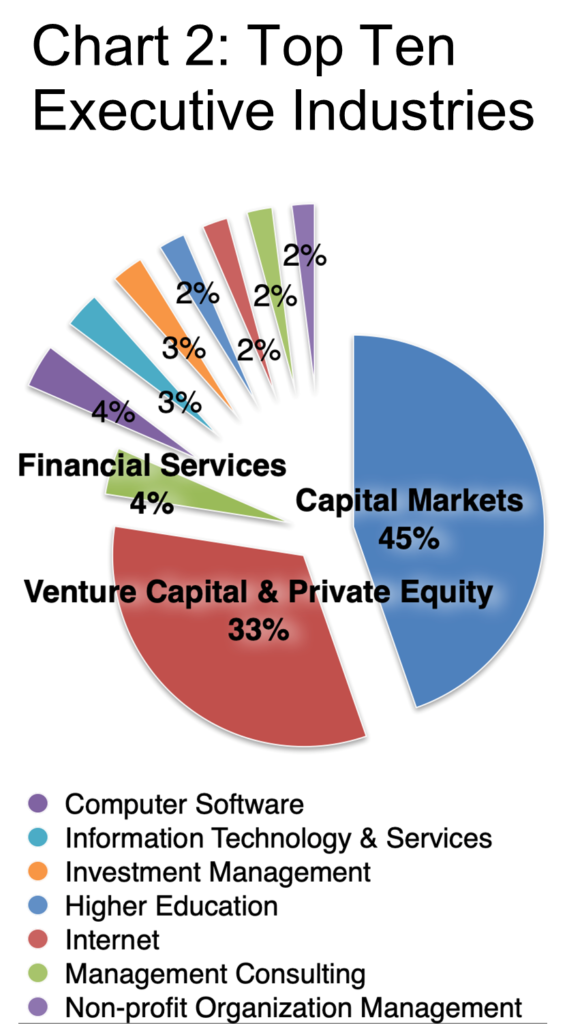
Per Chart 2, clearly Capital Markets and Venture Capital & Private Equity employ the most executives in this cohort while the remainder of the top ten industries range between 2% and 4% of the total.
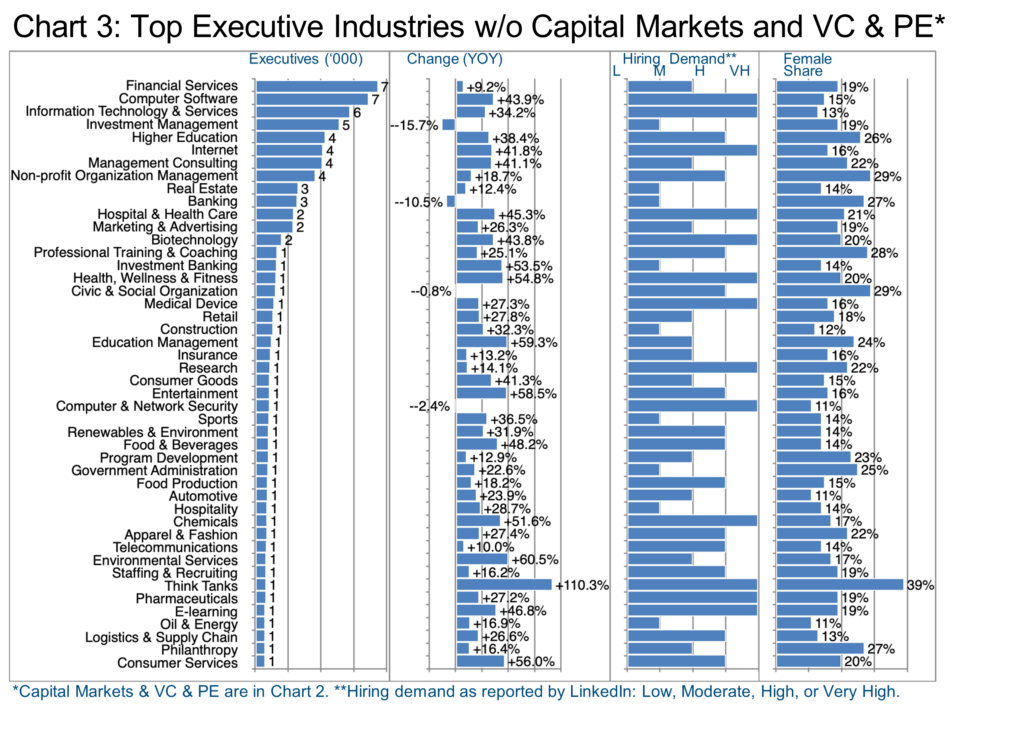
Chart 3 provides a deeper dive on the smaller segments where extreme growth in Think Tanks (+110.3%), for example stands out, but then so do many segments in the +40-60% range. The Hiring Demand column also gives some indication as to whether this growth was a flash in the pan or is sustained. For example, the number of executives in the Computer Software segment grew by 43.9% and is also rated by LinkedIn as having a very high hiring demand, whereas Education Management grew by 59.3% but only rates a moderate hiring demand going forward.
The female share data is not impressive as compared to other industries, though we hope it is improving over time. Large players certainly pay lip service to diversity.
For example, here’s an excerpt from Blackrock’s “Philosophy”:
“Our philosophy of working as One BlackRock is at the core of our commitment to diversity, equity, and inclusion (DEI) across every level of our firm and within every region and country we operate – across gender, race, ethnicity, disability and veteran status, among others. At BlackRock, DEI is a business imperative. We know that a diverse workforce is indispensable to our creativity and success.” [See source.]
The 39% female executive share in Think Tanks (Chart 3) is quite interesting, unfortunately, from a very small baseline. However, a recent more general industry study “…shows that the pipeline for top leadership positions still hasn’t recovered to pre-pandemic levels, and has reduced to just 14-percent and 18-percent female representation at the SVP and VP levels respectively. “Advancing women in leadership is not a formal business priority for the majority of organizations surveyed,” according to the study of 2,500 executives, managers, and professionals, equally split between men and women, from organizations in 12 countries and across 10 industries.” [See source.]
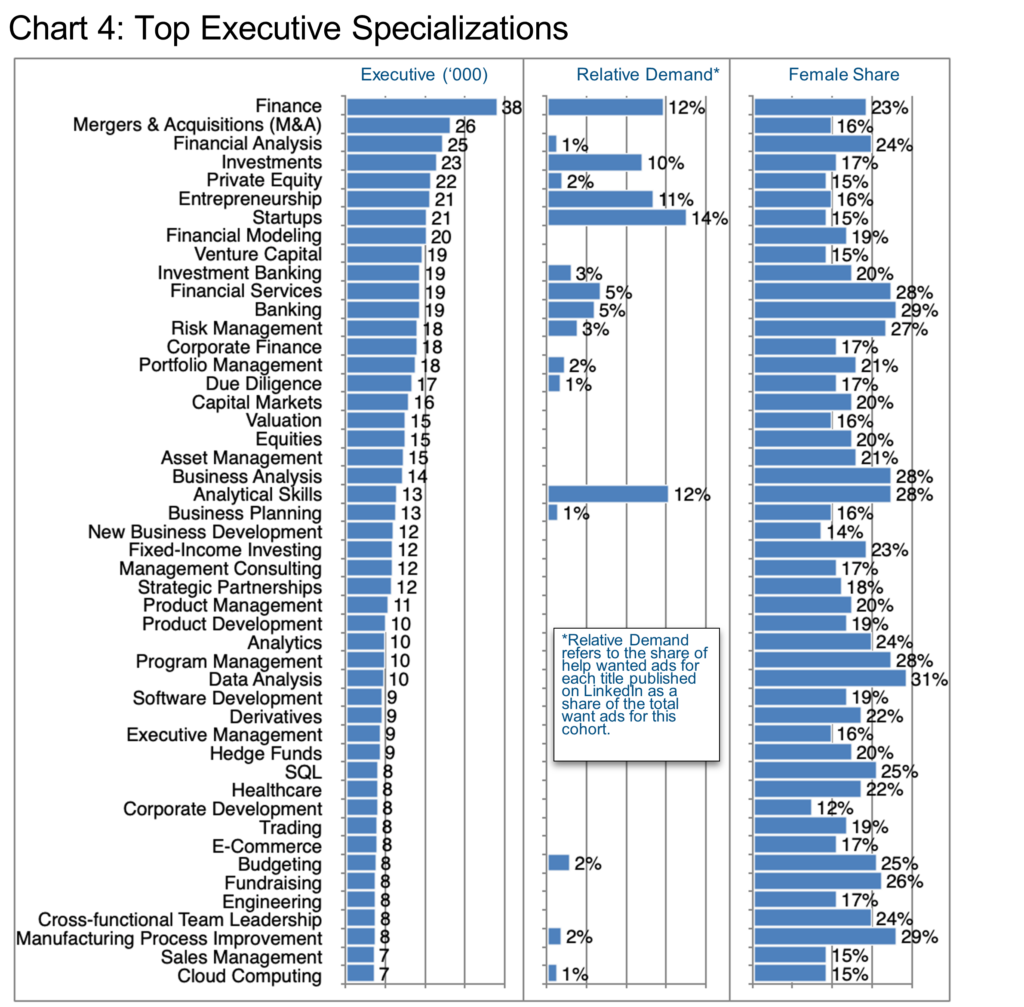
Chart 4 explores the specializations that PE & VC executives list on their LinkedIn profiles. The top spots all seem rather predictable given the highly quantitative nature of the overall industry. However, the Relative Demand shows perhaps better where the most action is occurring. Beyond the seemingly perpetual demand for Finance and Analytical Skills, Startups and Entrepreneurship seem quite transferable from other industries and may represent a route into or out of this segment. The Barrett Group has helped countless executives recognize transferable skills they may have overlooked and thereby discover new opportunity in alternative fields. Take client Jocelyn Hirshfeld, for example, who recently moved into a VP slot in a completely new industry. [Read more.]
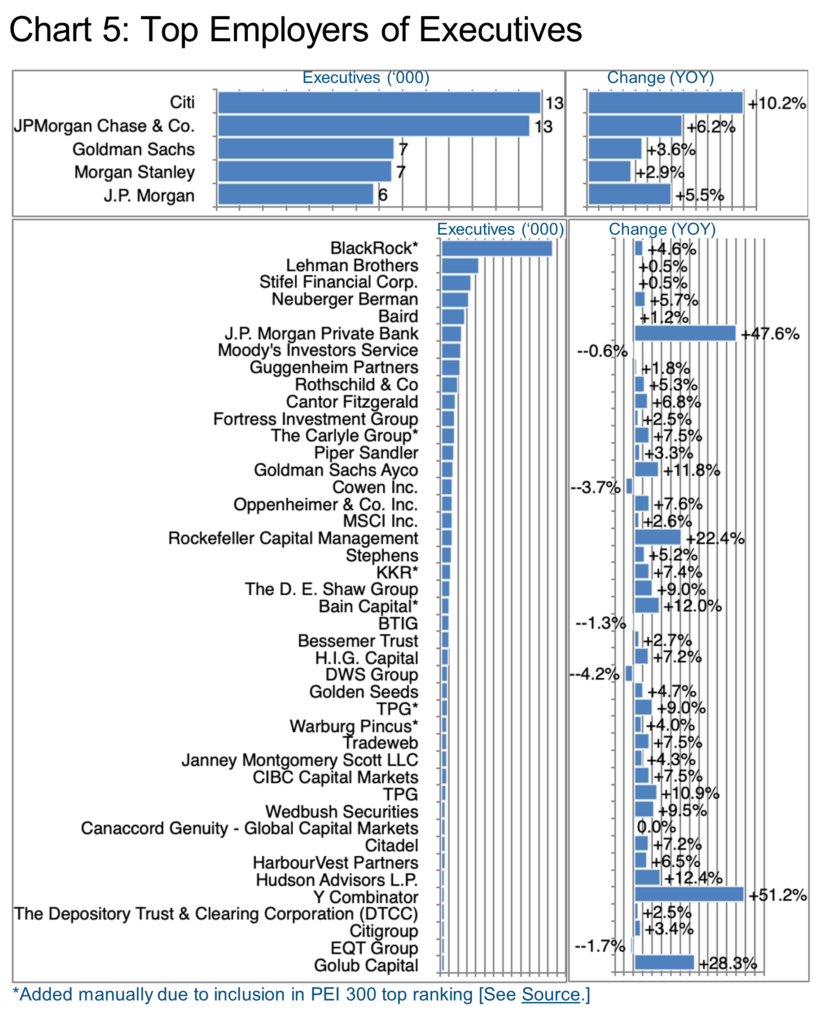
Due to the difference in scale we have divided Chart 5 into the leviathans and the smaller fish, so to speak.
Citi allegedly added more than 200 experts on Capital Markets alone in the last year, borrowing some talent from JP Morgan Chase & Co., Morgan Stanley, Goldman Sachs, HSBC, J.P. Morgan, Tata Consultancy Services, and Deutsche Bank but also from Credit Suisse during its recent restructuring.
JPMorgan Chase & Co. returned the favor, hiring also from Citi, Wells Fargo, Morgan Stanley, Bank of America, and Goldman Sachs, but also significantly from First Republic and Credit Suisse due to their recent trauma. Banking was the prime skill they acquired, followed by Capital Markets, Information Technology & Services, and Investment Management.
Goldman Sachs acquired talent in the Financial Services area but shed executives in Capital Markets, Investment Management, and Banking. Goldman Sachs also acquired NN Investment Partners in the Netherlands, adding to their Asset Management portfolio in the process.
Further down the ranking, JP Morgan Private bank hired strongly in the Banking, Capital Markets, and Investment Management segments, including an asset management team that moved over from Citi, bringing some $2 billion in assets with them. [See source.] Y Combinator also saw a batch of departures earlier in the year but has now “beefed up” its team bringing in talent from Yelp and from its own incubator ranks. [See source.]
Readers should bear in mind that these Industry Updates are intended to provide a high-level understanding of developments in each segment. Our clients benefit from much more granular research as their career change programs progress whether at the initial screening stage, or in preparation for interviews.
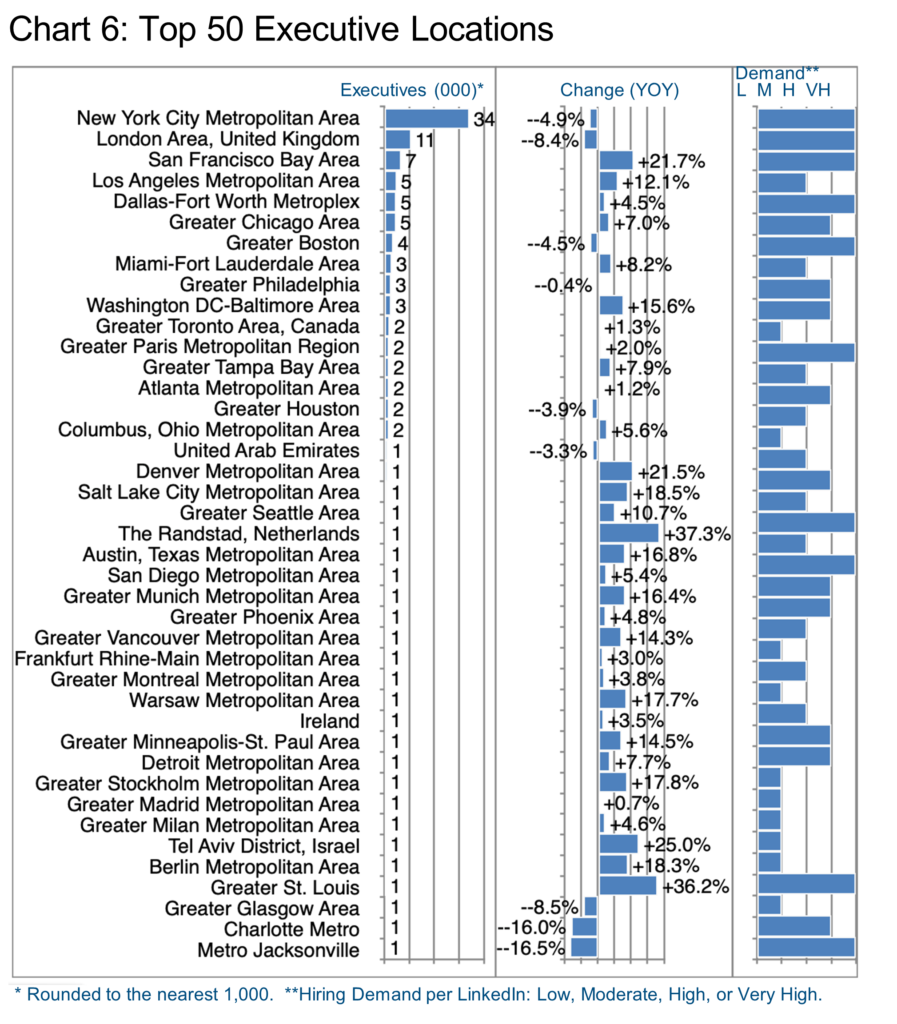
Chart 6 seems familiar, with New York often coming in at the top of the ranking, though it is rare to see the population there actually shrinking, a condition also evidently affecting London and Boston, in spite of which all three cities still experience very high hiring demand per LinkedIn. That may indicate a lack of supply at least for specific disciplines in high demand there.
The list of largest employers in these locations is quite concentrated with Citi, Morgan Stanley, and JP Morgan Chase & Co. covering the top 13 cities before Société Générale breaks in as of Paris at rank 14. Goldman Sachs’ acquisition of NN Investment Partners in the Netherlands explains the strong growth in The Randstad.
Numerous other international locations also show strong growth from a small base including Munich, Warsaw, Stockholm, Tel Aviv, and Berlin.
Peter Irish, CEO, The Barrett Group
Click here for a printable version of Private Equity & Venture Capital 2023.
Editor’s Note:
In this particular Update, “executives” will generally refer to the Vice President, Senior Vice President, Chief Operating Officer, Chief Financial Officer, Managing Director, Chief Executive Officer, Chief Marketing Officer, Chief Information Officer, Managing Partner, General Counsel, Head, and President titles principally located in the US, Canada, Europe, the UK, and/or the Middle East. Unless otherwise noted, the data in this Update will largely come from LinkedIn and represents a snapshot of the market as it was at the time of the research. Is LinkedIn truly representative?
Here’s a little data: LinkedIn has more than 900 million users. (See source.) It is by far the largest and most robust business database in the world, now in its 20th year. LinkedIn Talent Insights data is derived by aggregating profile data voluntarily submitted by LinkedIn members. As such, LinkedIn cannot guarantee the accuracy of LinkedIn Talent Insights data.
Explanatory Note
As readers will see in the Editor’s Note, much of our quantitative data comes from LinkedIn. Occasionally, LinkedIn changes its industrial classifications for various reasons. Previously, Investment Management, Capital Markets, and Private Equity & Venture Capital (PE & VC) were all grouped under one umbrella Private Equity classification. Recently, LinkedIn decided to separate Investment Management which in our view probably belongs more to Financial Services anyway. By virtue of this reclassification, the result is that PE & VC are now significantly smaller than in previous Industry Updates—to the tune of circa 160,000 executives, in fact.
We agree with LinkedIn in this regard and will respect their new definition in this Update although comparison to the previous report then becomes difficult. It may help to think of these reports as snapshots of a constantly changing river as opposed to static data sets.
