
INDUSTRY UPDATE: The Market for Executives in 2027
The Executive Market In 2027
According to LinkedIn, the executive market today comprises approximately 8.4 million professionals in the US, UK, EU, and Middle East. This market has grown by about 0.9% in the past year. Meanwhile circa 316,000 executives have also changed jobs. In total, there were about 390,000 executive opportunities in the past year available to career changers.
This executive market is approximately 25% female—well behind the general population from a gender point of view—and regionally quite diverse. For example, in the US this segment numbers about 4.8 million. US numbers grew more slowly at 0.7% in the past year. They showed a modest 3.3% rate of job change and was slightly better in terms of gender balance at 27% female. In the EU and UK, the segment includes 3.6 million executives. These European numbers grew by 1%, sported a brisk 4.3% rate of job change, and weighs in at just 22% female. The Middle East, also grew by 1% to 432,000. 5.1% of which changed assignments during the year, and, predictably, demonstrates the lowest share of female executives at just 17%.
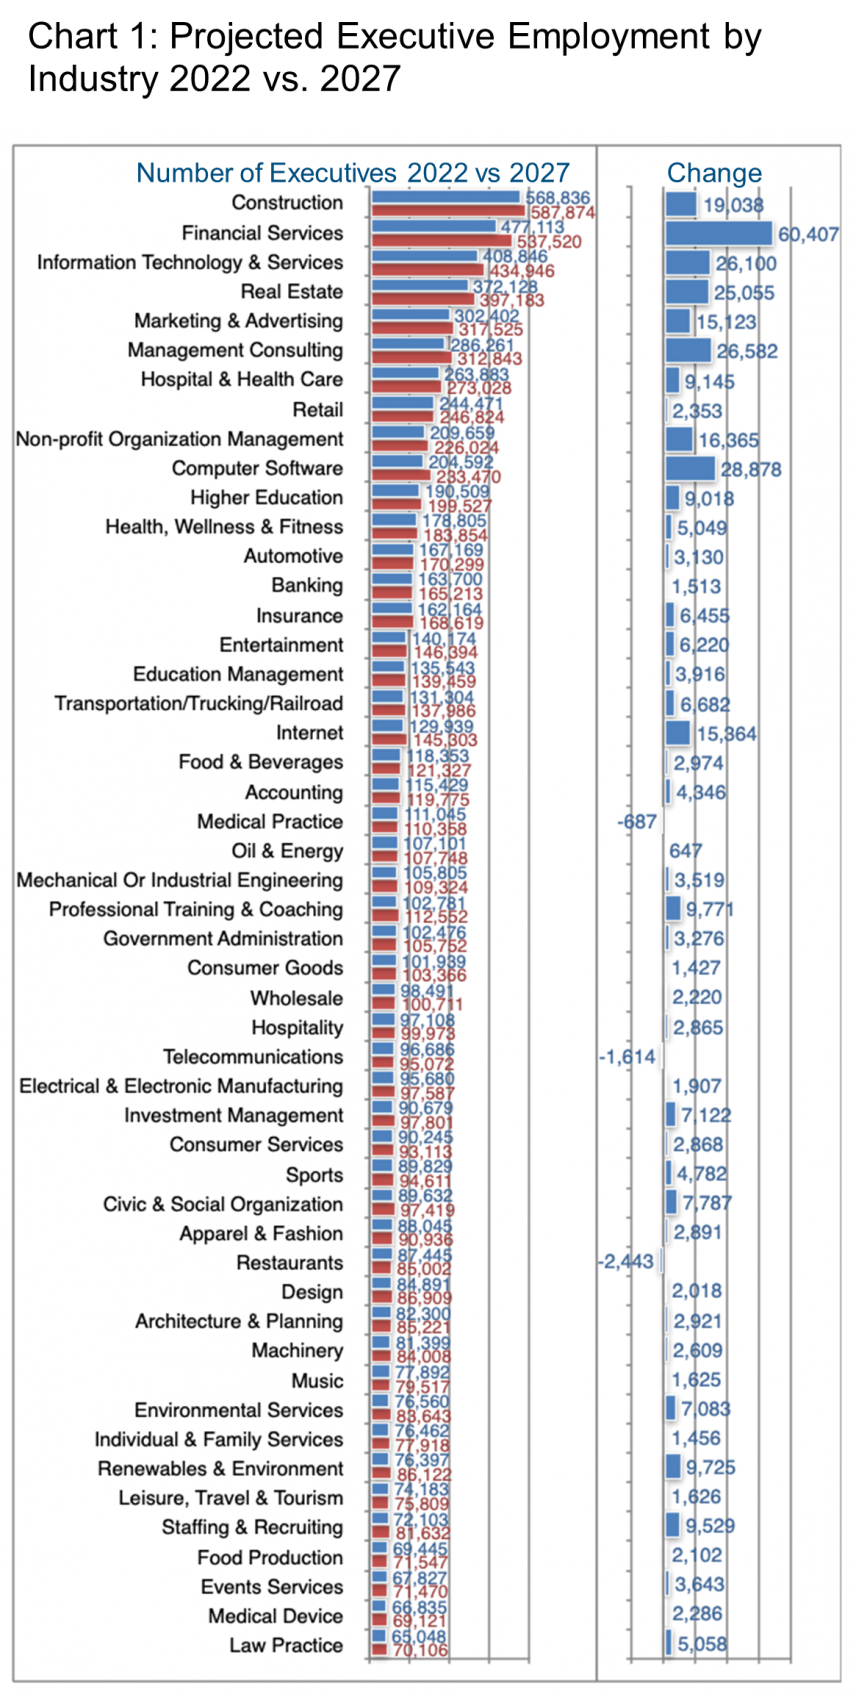
Chart 1 explores the industry implications of how the executive market is likely to evolve.
Granted, many macroeconomic and political factors may deflect the current trajectory. If current trends hold true over the next five years, it is likely that this market will swell by almost 400,000 in total. Some 60,000 of those positions will be in the Financial Services industry which in this case excludes banking (+1,500) and insurance (+6,455). Computer software will also grow significantly, adding another circa 29,000 opportunities. Management consulting will also grow (+26,582). On the current trajectory, the restaurant industry, telecommunications, and medical practice will all lose ground while a broad range of industries will add 9,000 or more positions during this time frame.
Some of these faster-growing segments include high female executive shares. These are, for example, non-profit organization management (45% female), hospitals and health care (39%), and professional training and coaching (38%). However, on balance the continued growth of this total industrial portfolio alone is unlikely to significantly change executive gender shares. Changes in the attitudes and practices of industry leaders will more likely impact this balance going forward. [See our special Industry Update on Female Executives for more information.]
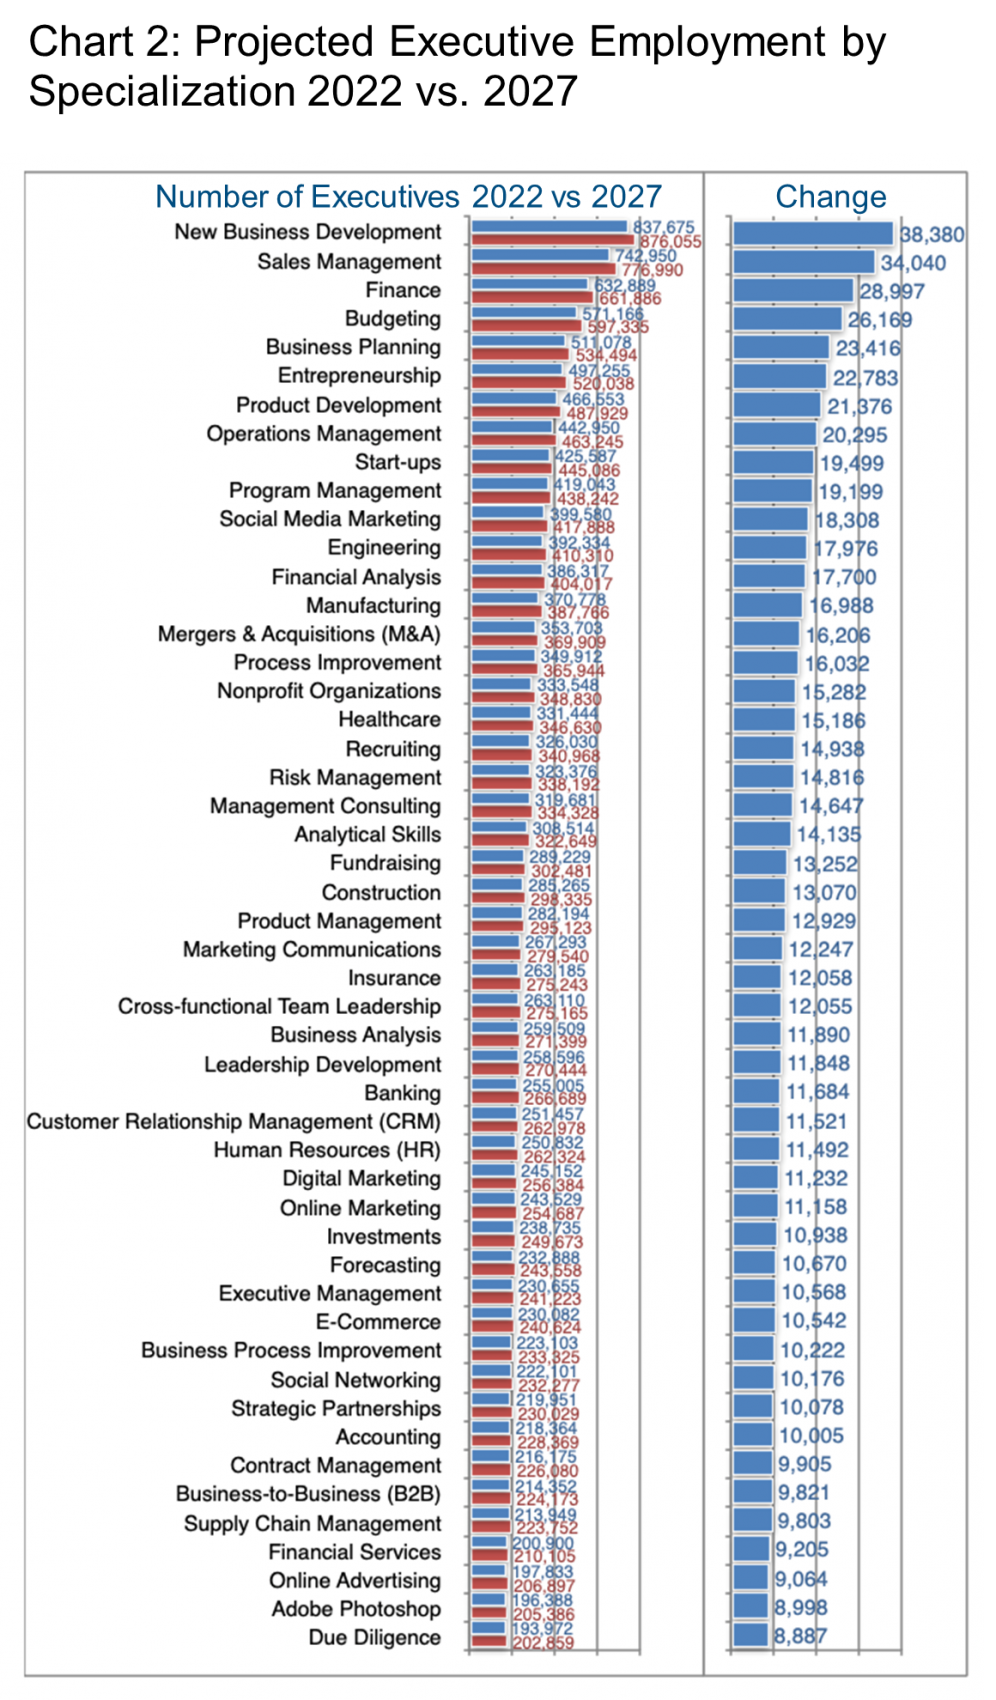
What will executives actually do in the future?
Most executives cite specializations as a way of describing their major areas of focus. Chart 2 illustrates how employment is likely to change within each of these specializations, again, if current trends continue.
As usual, generating new business and the related area of sales management come out on top in this overview. These add 38,000 and 34,000 positions respectively. But budgeting and business planning also seem set to grow significantly, adding another 55,000 executive roles between them. Meanwhile entrepreneurship, product development, and operations management also project the addition of 20,000 or more roles each.
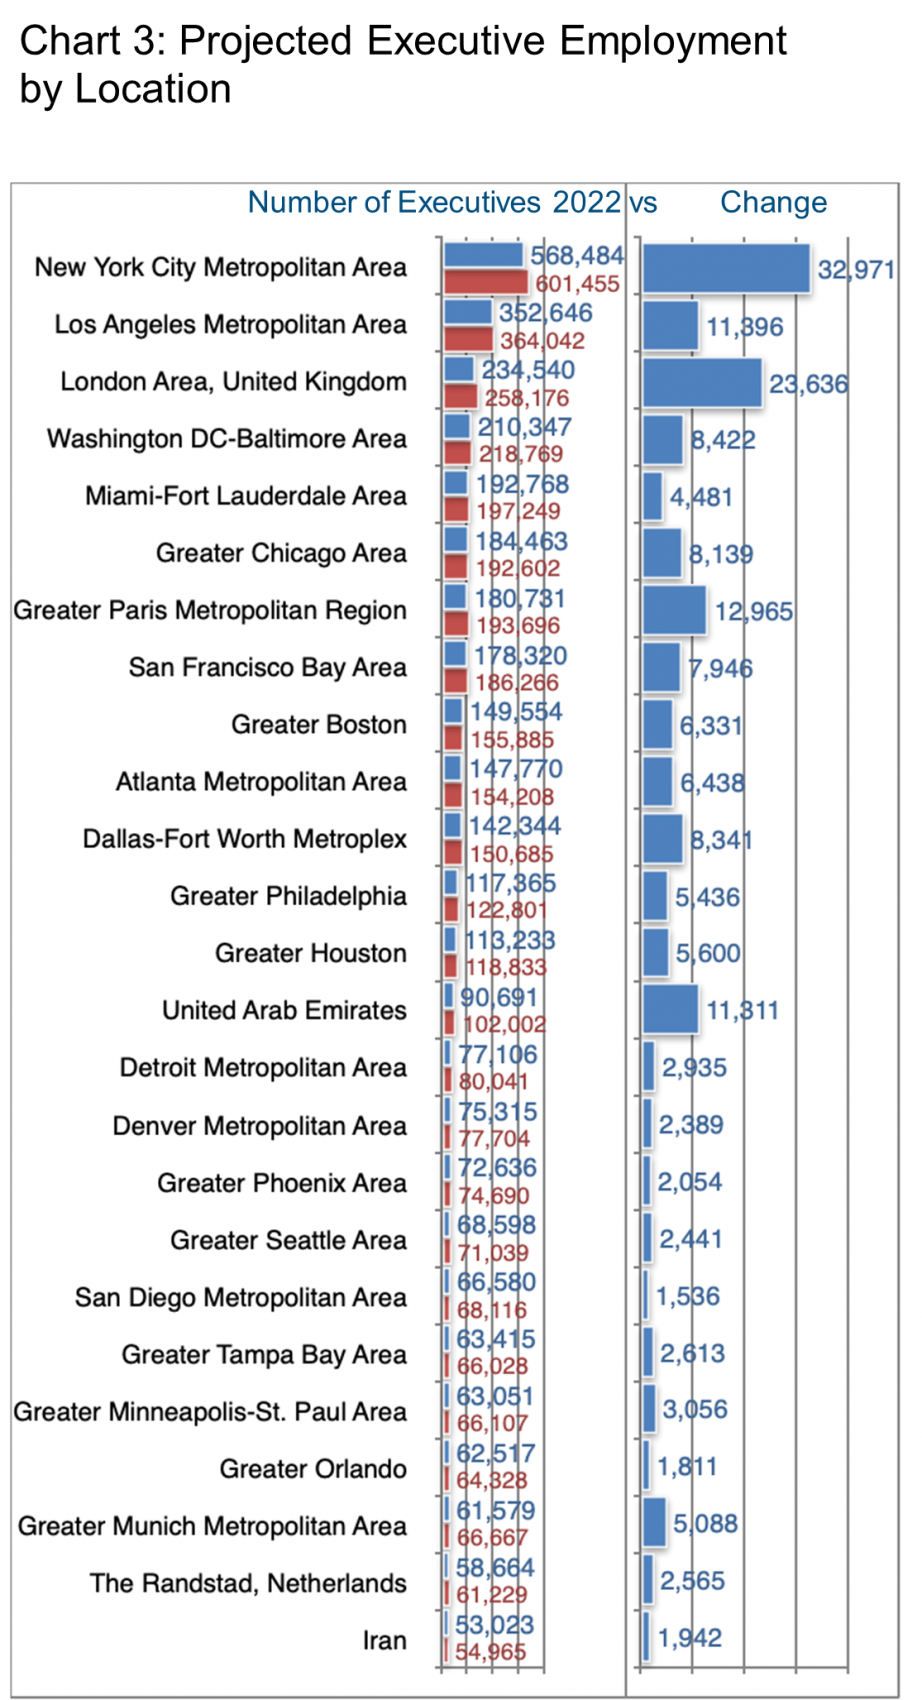
Assuming current trends hold true, New York is unlikely to lose its preeminent position as the top location for the executive market bar none (Chart Three). Because of its size, even a stately growth rate of just 1.1% per annum means it will add more than 32,000 executive positions in the next five years.
Overall, the US executive market population is growing more slowly now so major locations such as Los Angeles, Washington DC, Miami, and Chicago all show increases of 4,000 to 11,000 executives in this time frame. Meanwhile, London (+23,636), Paris (+12,965), and the UAE (+11,311) are all projected to continue to grow at a faster pace.
Now please bear in mind that being employed by a company based in New York does not necessarily mean that you will work in New York. This is especially given the fact that working remotely appears to be here to stay.
How Executives Will Work
Remote Work Is Here To Stay.
As have many other sources, the Economist makes the case that working remotely is here to stay. (See source.)
Here are a few points summarized from their article:
- A monthly survey since May 2020 suggests that 20% of full-time hours in the US are now worked remotely. This total is expected to rise to about 28%—up from just 5% before the pandemic.
- This is partly because the remote experience has been relatively good both in terms of improved work-life balance and the technological developments allowing smooth communication and integration between remote associates.
- The ability to live where you want is also an important factor that seems to be increasingly important in hiring decisions to attract younger employees. This allows employees to live in less expensive areas as well.
- Whether remote working leads to higher productivity, in the long run, is still open. Though, certainly, not having to commute is a boon to both quality of life and productivity.
The Gig Economy Will Move Into The Executive Market Suite.
Although over $600 billion in venture capital funds were invested in 2021—ten times the amount a decade ago—the industry has taken a hit in 2022 (See source.). The “war in Ukraine, China’s purging of its tech industry,” and the rise in interest rates have all cramped VC’s style. Nevertheless, The Economist predicts that VC’s role in powering portfolio companies will continue to accelerate.
The Barrett Group reviewed the subject of VC’s portfolio company executive employment recently and reports:
“In the United States, EU, UK, and Middle East, approximately 24,600 executives as we define them are employed in this sector, a cohort that grew by 8% in the past year, and has seen 1,370 job changes in the same period. They are overwhelmingly male (82%) and LinkedIn cites the hiring demand in general as “very high.” ”
“Please remember that this is just the tip of the iceberg. Every one of these firms has a portfolio of companies in which they are invested and every one of those companies employs further executives. For example and chosen purely at random, Battery Ventures, a US-based, mid-level company in terms of the number of executives directly employed, lists 590 companies in which they are invested. If the same relation were to hold true for all VC and PE companies (which we cannot verify), then just the companies we cite later in this update would cover more than 60,000 portfolio companies.” (See source.)
Imagine that each of these estimated 60,000 portfolio companies has 3 to 4 executives. You will quickly see the potential impact this trend has on executive employment. Gigs at VC companies can be highly lucrative. However, they are typically relatively short, averaging 2-4 years depending on the specialization.
Beyond the VC sphere, the gig executive option is becoming increasingly attractive. This is in times of uncertainty as a company may need a growth specialist at one point or an efficiency maven at another. Hiring gig executives allows flexibility. It avoids commitments to large blocks of fixed cost, a practice gaining currency as “fractional leadership.” (See source.)
Adaptive Compensation Will Increase Complexity And Opportunity In The Executive Market
There was a time when compensation was simple. Large companies had a scale such as Hay points that defined the relative value of a role. These would then correlate to a level of base pay. Some variable elements would then be added on top and perhaps a few specific benefits such as vacation and sick days. Well, life in HR has become increasingly complicated as the search for more efficient and effective compensation has progressed.
At a high level, Equity Methods summarizes four key trends in executive compensation (See source.):
- Growing adoption of relative performance awards.
- Increasing reliance on sector-based comparison groups when issuing relative awards.
- A surge in the issuance of executive mega grants.
- The onset of ESG metrics in annual and long-term incentive plans.
Intense competition for talent and demographics also play a role. We read every day how millennials and still younger generations may value social or cultural aspects of work more than monetary rewards. Deloitte effectively debunks some of this belief (See source.). They reach the conclusion that what motivates employees to join a company may differ considerably from what encourages retention. In any case, according to Deloitte, dissatisfaction with compensation appears to affect millennials, too. Nevertheless, millennials have undoubtedly forced companies to broaden the portfolio of perks and benefits available.
At a micro-level, this complexity breeds opportunity for executives to influence their compensation packages far more broadly than ever before.
ESG Is Likely To Gain Momentum
A recent Economist article reminds us of the importance of these three letters:
“…environment, social and governance (ESG) investing […] has ballooned in recent years; the titans of investment management claim that more than a third of their assets, or $35 trn in total, are monitored through one ESG lens or another.” [Economist, July 23rd, 2022].
Whether through sincere altruism, a desire to protect future generations, self-interest, or due to the threat of expected government regulation, there seems to be definite momentum behind industry efforts to clean up their acts environmentally.
In our Industry Update on Female Executives, we highlighted the social front. The growing consensus is that diversity is important in its own right and not only because of government regulation.
Many corporations are actively adopting guidelines and practices to promote diversity.
For example:
…JPMorgan Chase has eliminated gender-specific language from its bylaws, including replacing “chairman” with “chair” and removing gendered pronouns like “his” and “her.” This announcement is consistent with the bank’s commitment to diversity and inclusion, which includes a $30 billion commitment to advance racial equity and a commitment to expanding a diverse workforce.” (See source.)
Other companies have adopted targets aimed at increasing gender equality in the executive suite. Wells Fargo, for example, has recently stated that “…diversity, equity, and inclusion metrics are integrated into monthly business review meetings.” [See source.]
The impact of ESG is gradual. But it means that executives will require new skills and perspectives to steer through the increasing complexity of cultural measures being created to address these challenges.
Who Will Own The Companies At Which Executives Work?
Private And Public Companies In The US
In the US, there are approximately 27 million business enterprises. Approximately 4,000 of these are publicly traded and another 8,000 are powered by private equity. So the vast majority of US enterprise is privately owned, and relatively small. In fact, small to medium enterprises (SME’s) make up 86.4% of employment at firms with 500 employees or more. You might be surprised at the list of privately held companies compiled by Forbes. These include giants such as Cargill, Koch, Publix, Mars, and HEB as the top five. (See source 1. See source 2).
Private equity is a very active player in this large pool. It is likely to take a larger share of private companies over time. For example, PitchBook has this to say about PE fundraising in 2022:
“Private equity firms are currently in what PitchBook analysts call “perhaps the most crowded fundraising market in history,” according to our latest US PE Breakdown. Firms raised $176 billion across 191 funds in the first six months of 2022, setting a pace that, if sustained, could surpass last year’s total fund value of nearly $340 billion across 577 funds.” (See source.)
According to McKinsey, the number of public companies dropped from about 5,000 to the current number primarily in 2010 and as a result of acquisition essentially in the banking, manufacturing, and technology sectors. Since then, counting IPOs and continuing acquisitions and mergers, the total number of publicly traded companies in the US has remained relatively stable. (See source.) Overall they comprise about one-third of non-farm employment.
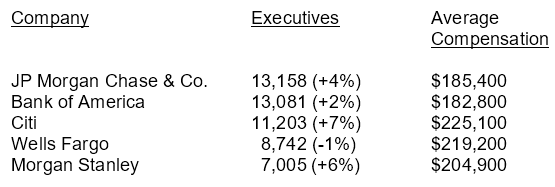
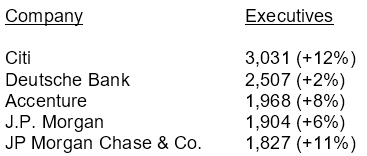
Interestingly, the top ten employers of executives by our definition (see Editor’s Note) are all banks or financial services companies including the following:
It seems safe to summarize that, in the US, the balance between publicly traded and privately owned companies will remain relatively stable over the forecast period. However, private companies will increasingly, if very gradually, be acquired by private equity.
Verizon opines that private companies respond more quickly to challenges and opportunities. And also that private companies are more likely to invest in growth than public companies (See source.). So if that is the culture you are seeking, then being a big fish in a small pond may well be for you. If you go the private equity route, it will be more like a gig—a job defined by a project or achieving specific milestones—versus a more traditional, long-term relationship.
On the other hand, larger companies simply have more executive positions to offer. There is considerable churn in their ranks (attrition ranged between 3% and 6% for the top five companies listed above). So the smaller fish in the bigger pond approach has its benefits, too.
Private And Public Companies In Europe
Europe lists approximately 22.5 million enterprises (excluding financial services) and this number also seems to be relatively stable (See source.). Publicly listed companies in 2020 totaled about 5,688 (See source.) based on listing at the national level with the highest number in Spain (2,711) and the overall average equaling 316 per country. Here again, we see that public companies represent a very small share of total enterprises. In Europe, SMEs (in this case up to 249 employees) cover approximately 64.5% of employment. (See source.).
Although the data is a little out of date, the European Savings Institute offers an interesting illustration of how total share ownership has changed in Europe over recent decades. Households have dropped from 38% to about 15% of equity. Government and insurance funds have also shrunk while investment funds and above all foreign capital have blossomed—more than doubling their share of total European equity during the period. (See source.)
Europe is also seeing record deal-making in the private equity space as reported by PitchBook:
“European PE deal value well surpassed 2021’s H1 figure, with an estimated €463.5 billion transacted across 4,053 deals, representing year-over-year increases of 35% and 16%, respectively. Transactions continue to grow in size, particularly at the top of the range, pushing total deal value upward.”
“The business products and services sector received the largest share of European PE capital in the first half of the year, with €124.2 billion invested—its highest ever H1 figure. Companies in the sector are likely [to] maintain or even grow their revenues as the market becomes more distressed, while its consumer counterpart is expected to continue to struggle.”
Because public stock markets are underperforming at the moment there is a tendency toward “take-privates” rather than IPO-style exits, however, this is probably cyclical and not systemic. (See source.)
As in the US, LinkedIn’s overview of the companies employing the largest number of executives as we define them (see Editor’s Note) includes a large number of financial services companies:
Therefore, in summary, we do expect these trends to continue during the forecast periods with public companies remaining relatively stable in terms of their total share of employment, while private companies constitute the majority of the value creation in the region, increasingly funded by private equity.
Executives in Europe have a clear choice between being smaller fishes in larger pools at the publicly traded companies (see the list of largest employers above) with relatively high attrition rates between (4%-7% for the list above), or joining the large and vibrant ranks of smaller, private companies that drive GDP growth and employment in the region. The latter offer relative stability if not glamour, although, increasing private equity ownership probably means the gig economy will also probably intrude in the executive suite as individuals are hired to execute a specific strategy or achieve a specific set of milestones.
Peter Irish, CEO, The Barrett Group
Click here to download a printable version: Industry Update – The Market for Executives
Editor’s Note:
In this particular monograph, “executives” will generally refer to the Vice President, Senior Vice President, Chief Operating Officer, Chief Financial Officer, Managing Director, Chief Executive Officer, Chief Human Resources Officer, Chief Marketing Officer, Chief Information Officer, Managing Partner, General Counsel, Head, and President titles. Unless otherwise noted, the data in this Update will largely come from LinkedIn and represents a snapshot of the market as it was at the time of the research.
Is LinkedIn truly representative? Here’s a little data: LinkedIn has approximately 830 million users. (See source.) It is by far the largest and most robust business database in the world, now in its 19th year. LinkedIn defines the year-over-year change (YOY Change) as the change in the number of professionals divided by the count as of last year. “Attrition” is defined as the departures in the last 12 months divided by the average headcount over the last year.


