
INDUSTRY UPDATE: Female Executives – March 2022
Introduction
We are often asked questions such as have women made real progress in infiltrating the executive ranks. And what is the prognosis going forward? We thought therefore that it makes sense to see where the female executive ranks stand at the moment so we can take stock in the future.
The Economist recently published their Glass Ceiling Index. (See Source). It provides an excellent gauge for how various countries have developed with respect to female participation. These are specifically in managerial positions, company boards, seats in parliament, etc. And we encourage readers to look into this broader view as their interests may dictate. According to this source, it seems that women are making some progress but that it is uneven at best.
Our focus here will be on executive populations in our target geography (US, EU, UK & Middle East (ME)) as a snapshot with some reflection on growth and participation rates. (See the Editor’s Note for further definition.)
At a very high level, from a target population of 7.86 million executives, only 24% are female. This breaks down to about 4.7 million in the US, of which 27% are female, and 3.2 million in the EU, UK, & ME of which 21% are female. While the overall executive population grew by just 1% in the past year. Almost 248,000 changed jobs—a churn of 3.2%. Including the background growth, there were a total of about 320,000 opportunities for executives to obtain a new role in the past year.
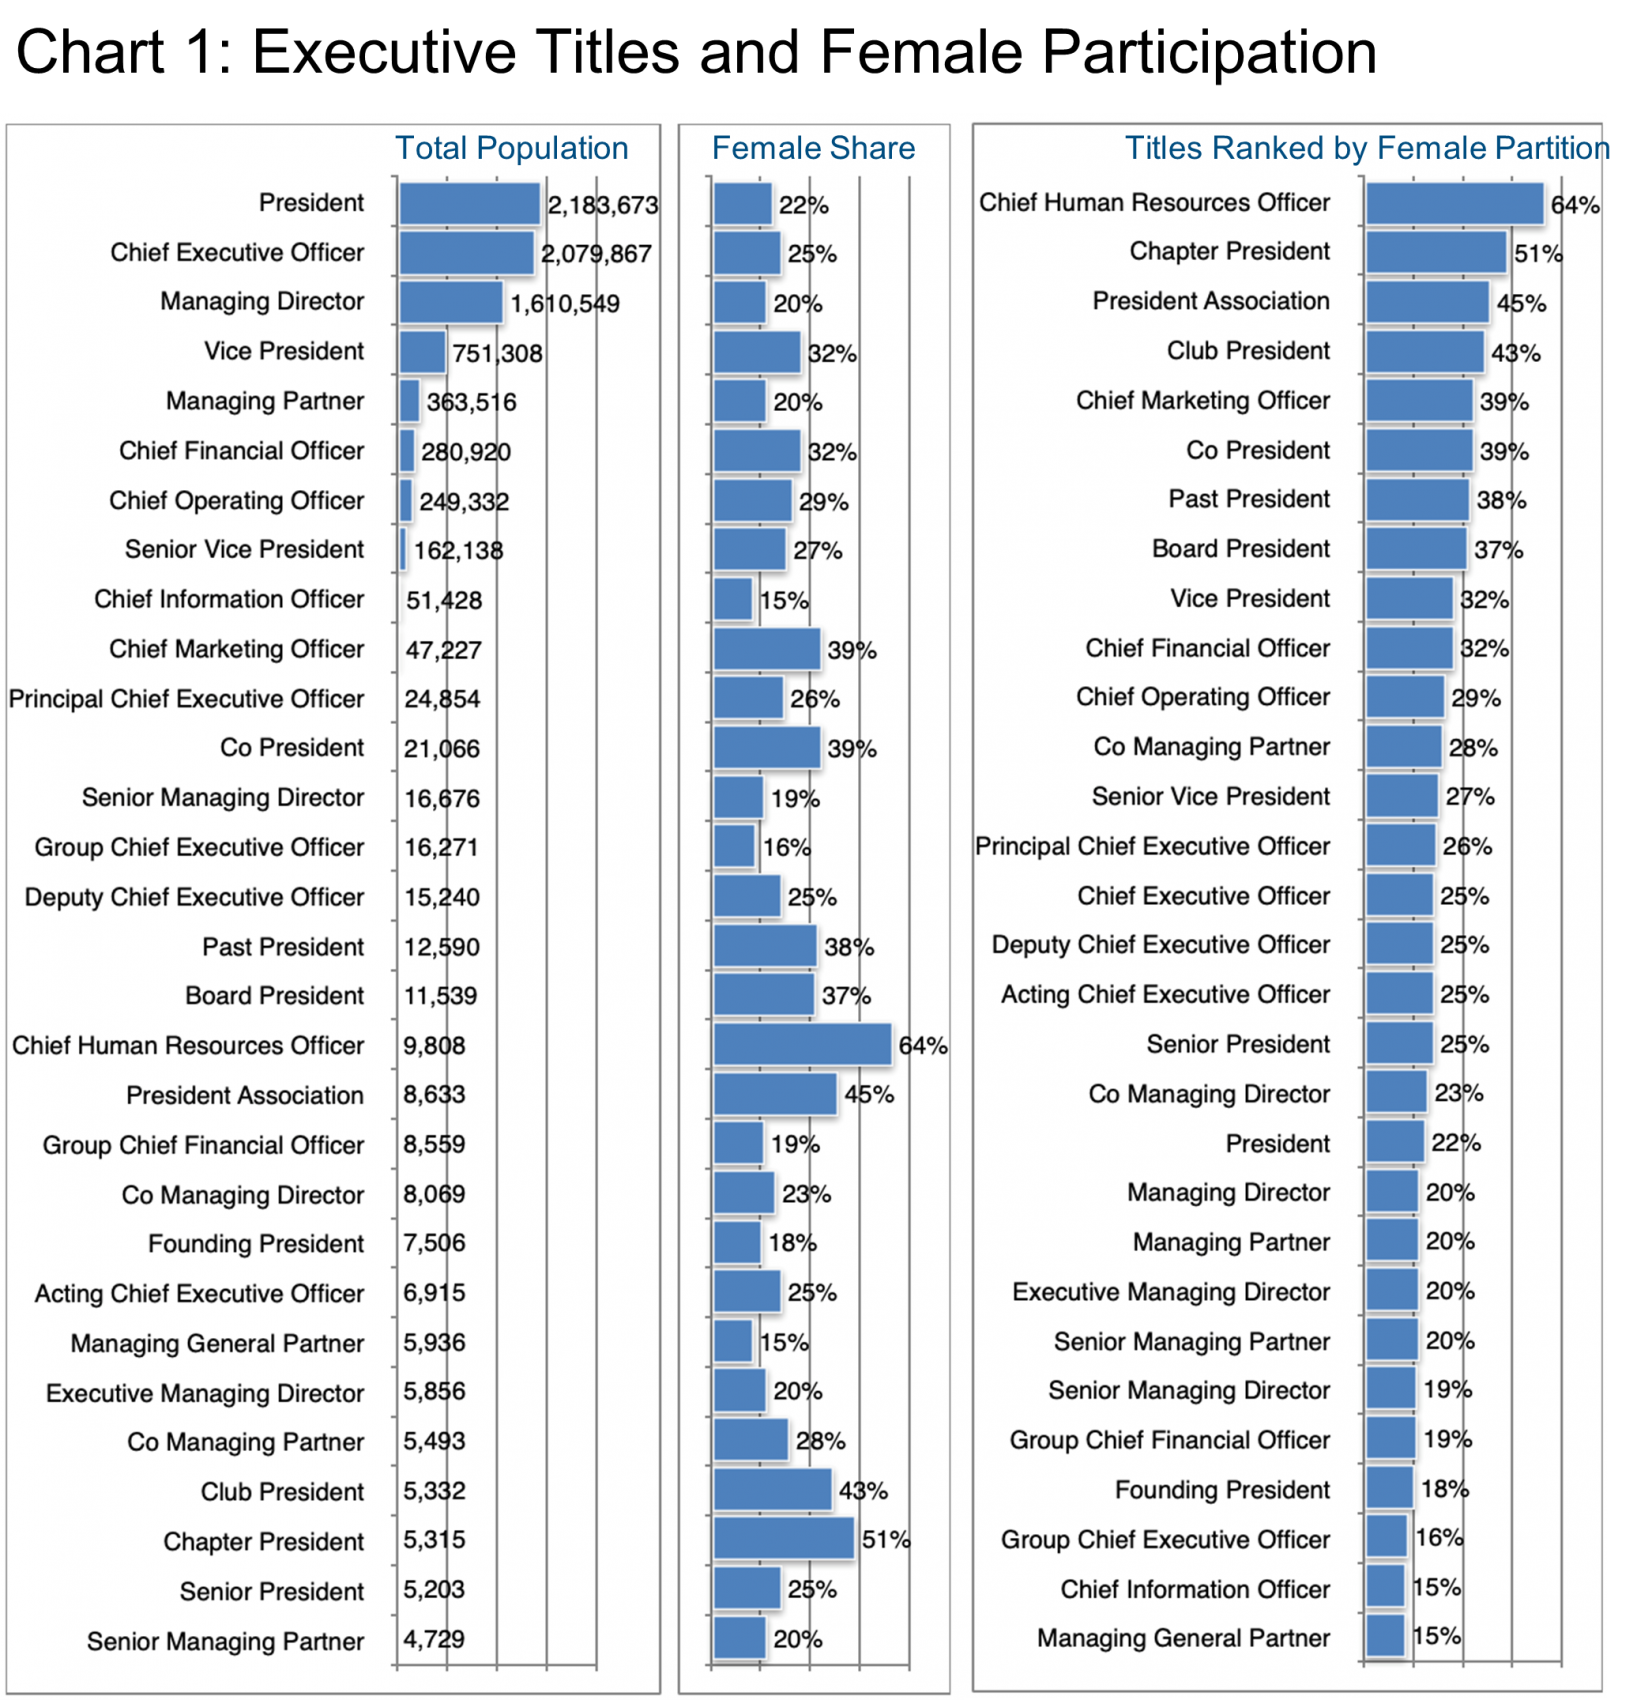
The left-hand portions of Chart 1 provide an overview of the top 50 titles within this population while revealing the percentage of each title that is held by females. The right hand re-sorts the data to show in descending order titles most frequently held by women. It is perhaps not surprising that Human Resources and Marketing figure highly on this ranking. However, the question remains, why are women less frequent in some of the fastest-growing executive roles. And what can women do about that?

Per Chart 2, Construction, Financial Services, Information Technology & Services, and Real Estate comprise the four largest industries. Though these do not show the highest growth rates. On that score, Environmental Services, Internet businesses, Investment Management, and Staffing and Recruiting all show 2.6-2.8% YOY growth in the number of executives employed.
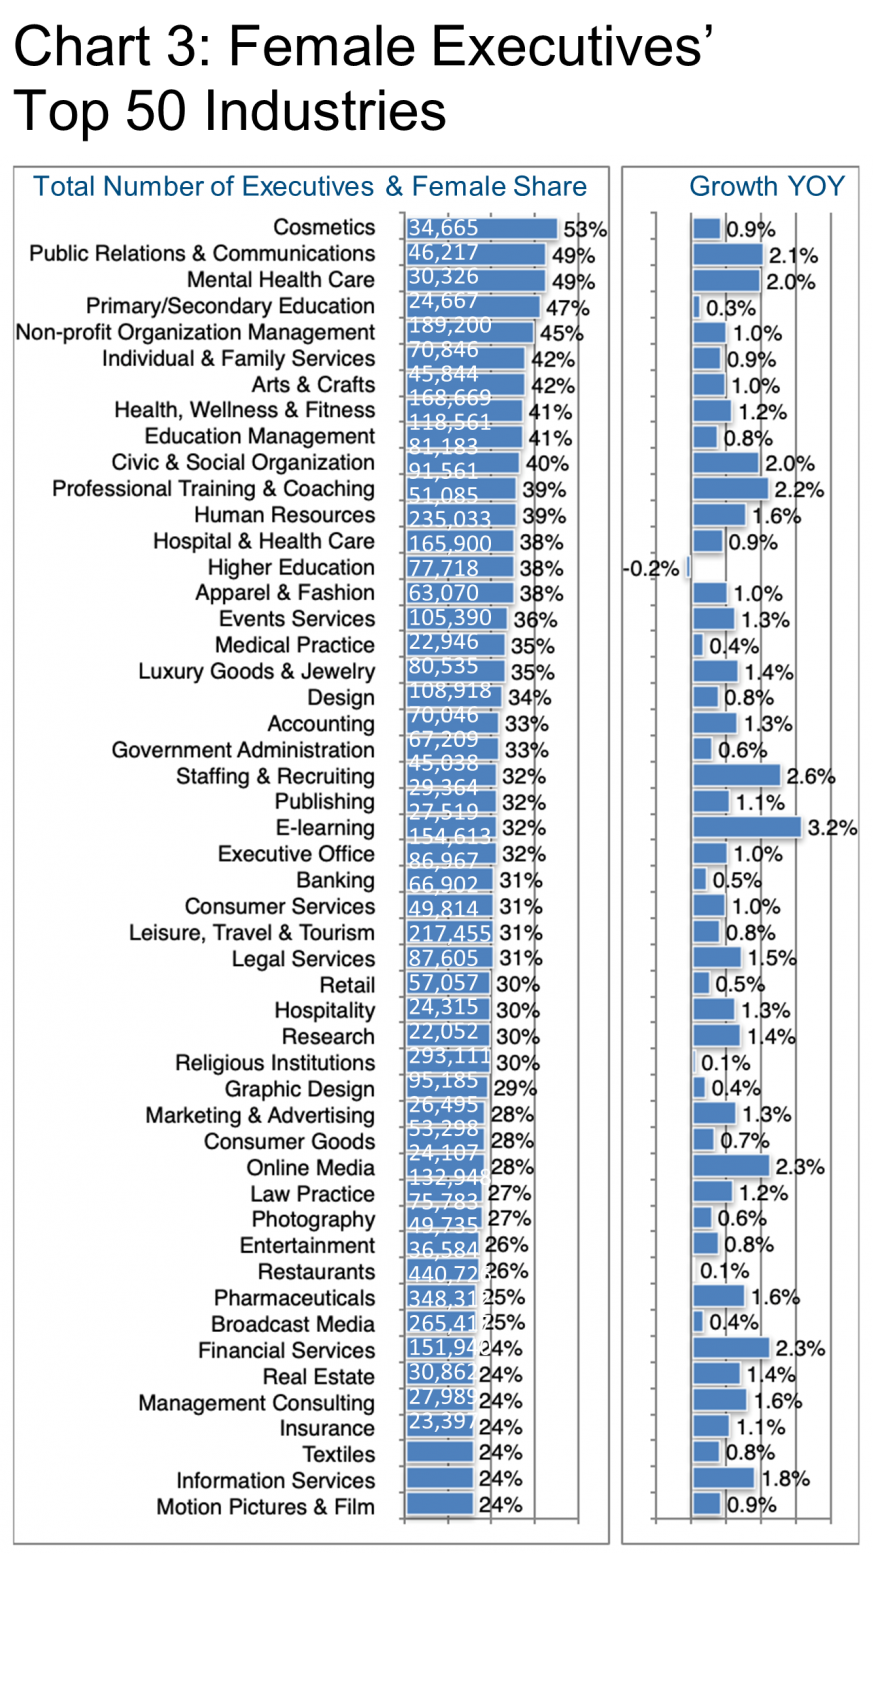
Chart 3 shows the industries with the highest share of female executives. E-learning and again Staffing & Recruiting represent the fastest-growing segments here.
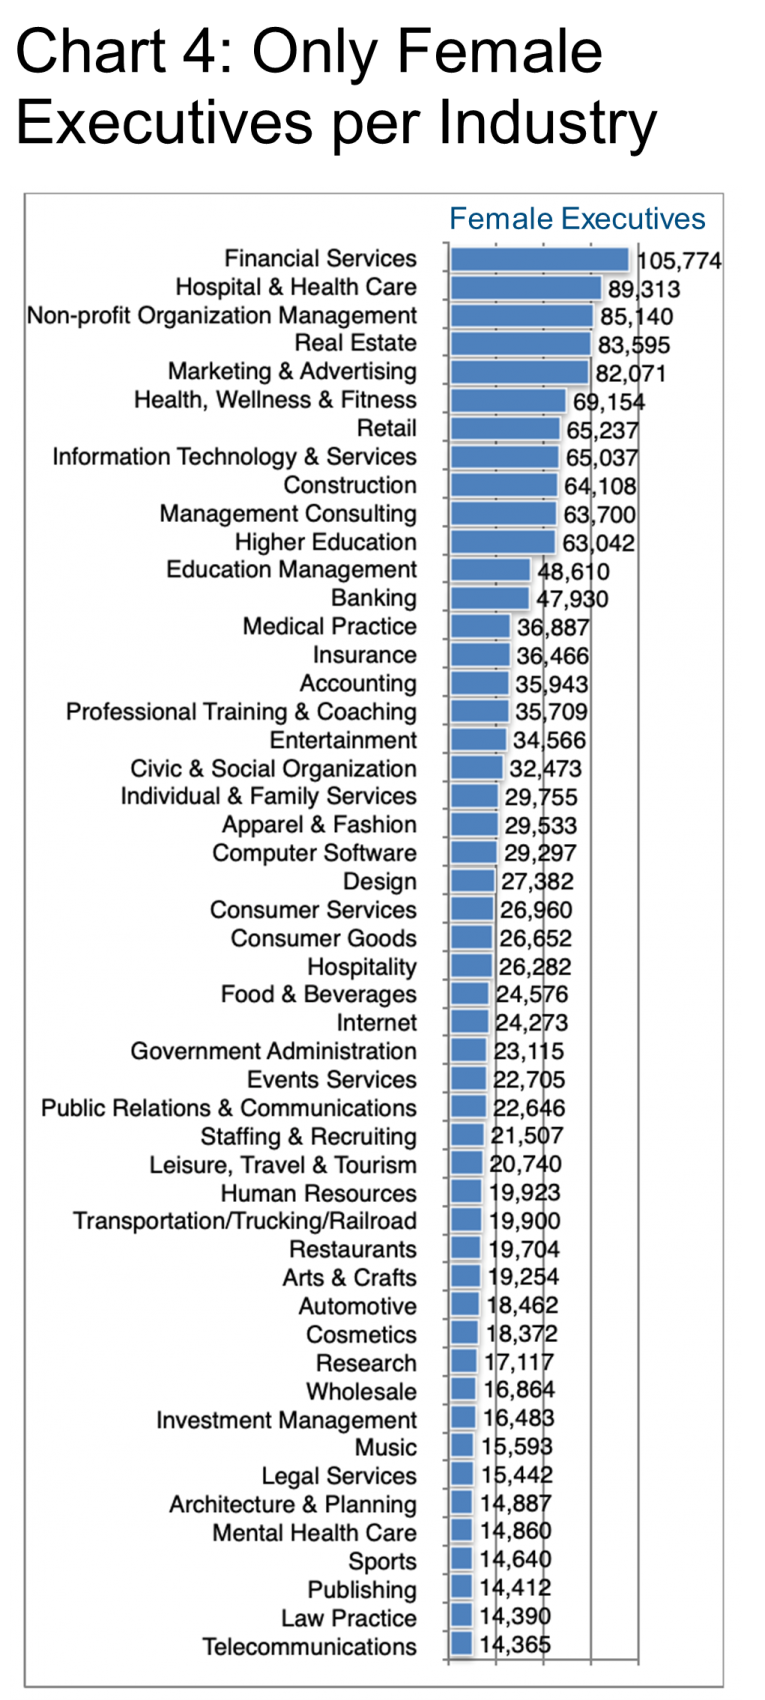
Recalculating the actual number of female executives based on the data in Chart 2, we offer the overview in Chart 4. It provides a ranking of industries employing the most female executives. Within each of the top six industry categories here are the largest employers. Most of these are based in the US unless otherwise indicated:
- Financial Services: JPMorgan Chase & Co., Citi, Wells Fargo
- Hospital & Health Care: Kaiser Permanente, United Health Care, HCA Healthcare
- Non-profit Organization: AIESEC (Canada), Toastmasters International, Future Business Leaders of America
- Real Estate: CBRE, JLL, Newmark
- Marketing & Advertising: “Selbstständig” (self-employed, Germany), Edelman, “Selbstständig” (self-employed, Switzerland)
- Health, Wellness & Fitness: Stay at Home Mom (UK), Cigna, Aetna
To sample what some of these top employers of women executives are saying on the subject of gender equity, we took a look at the prominent players in the largest category: Financial Services.
“As featured last month [March 2021] in Bloomberg Equality, JPMorgan Chase has eliminated gender-specific language from its bylaws, including replacing “chairman” with “chair” and removing gendered pronouns like “his” and “her.” This announcement is consistent with the bank’s commitment to diversity and inclusion, which includes a $30 billion commitment to advance racial equity and a commitment to expanding a diverse workforce.”
“Language is a powerful tool for inclusion. A 2019 Swedish study discovered that promoting the use of gender-neutral pronouns ‘reduces biases favoring men, which encourages more positive views of women, homosexuals, and transgender people…allowing the nonmale group to become more pronounced.’ The gender neutrality conversation is becoming more acknowledged with “about one-in-five U.S. adults knowing someone who goes by a gender-neutral pronoun.” (See Source.)“
Citi also released a “Women in Finance Charter Report” in 2019. It set global gender goals including an increase in the female share of certain executive positions. (See Source).
This seems to be a common approach with Wells Fargo also adding, for example, “…diversity, equity, and inclusion metrics are integrated into monthly business review meetings. (See Source.)“
Within the Hospital & Health Care industry, Kaiser Permanente is one of the largest employers of women. Kaiser Permanente says: “Our boards are 38% women and 38% people of color. In 2020, 53% of the CEO’s direct reports were women. And nearly 43% of the executive medical directors were women. (See Source.)” United Health Care emphasizes the pay equity aspect of their diversity and inclusion policy: “We are committed to and continue to prioritize pay equity for all employees. Fair and equitable compensation practices within a pay-for-performance framework support our culture and are critical to achieving our mission. We continue to work with independent, third-party experts to perform reviews of our compensation practices and evaluate pay equity in several respects, including by gender, ethnicity, and race. (See Source.)“
At least on the surface, it seems that leading employers in these industries have taken the steps to craft policies targeting improved gender balances. Barrett Group clients have access to substantially more information as required to formulate and pursue their career strategies whether at the geographic, industry, or functional levels.
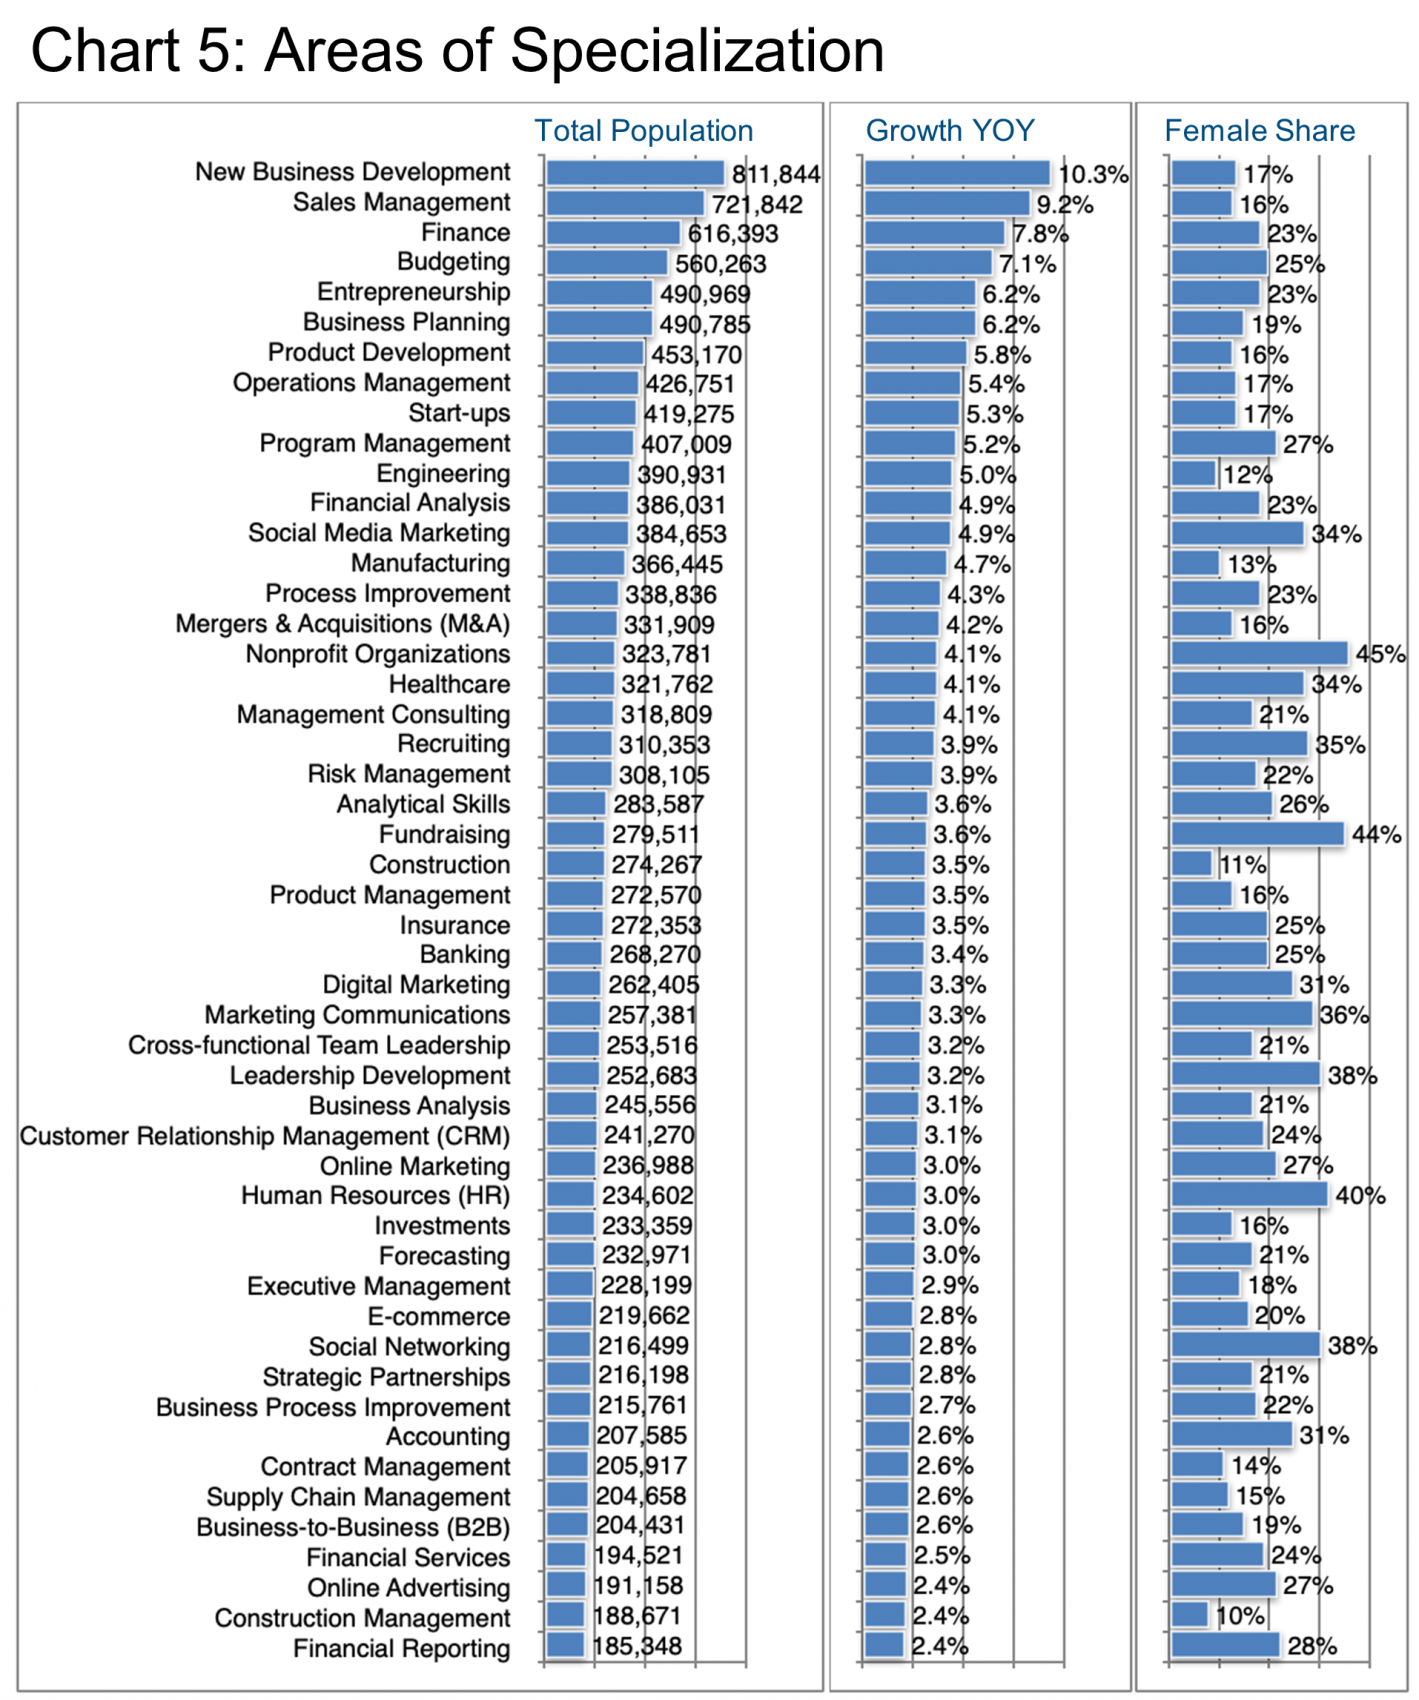
As far as specializations or skills are concerned, Chart 5 offers an overview of how executives characterize their areas of expertise on LinkedIn.
New Business Development and Sales Management come out on top. They are followed by Finance and Budgeting in terms of sheer numbers of executives, altogether representing about 35% of the total. These top-ranked specializations range from 17% female to 25%. Whereas seen from the female share perspective, Nonprofit Organizations (45%), Fundraising (44%), Human Resources (40%), and Leadership Development and Social Networking (38%) constitute the specializations with the highest shares of female executives.
The Economist article highlighted earlier in this Update pointed out on-going pay differentials between the sexes. These may well be improving but are still quite evident. And we would simply add that it is not only the rate of pay that is causing this difference but also the areas of specialization. Typically, sales and business development are among the best-paid roles in many companies and industries. Unfortunately, so far at least, the female share of these best-compensated specializations is still quite low.
We often tend to look at these subjects in isolation, of course. But location, industry, and employer are intimately linked.
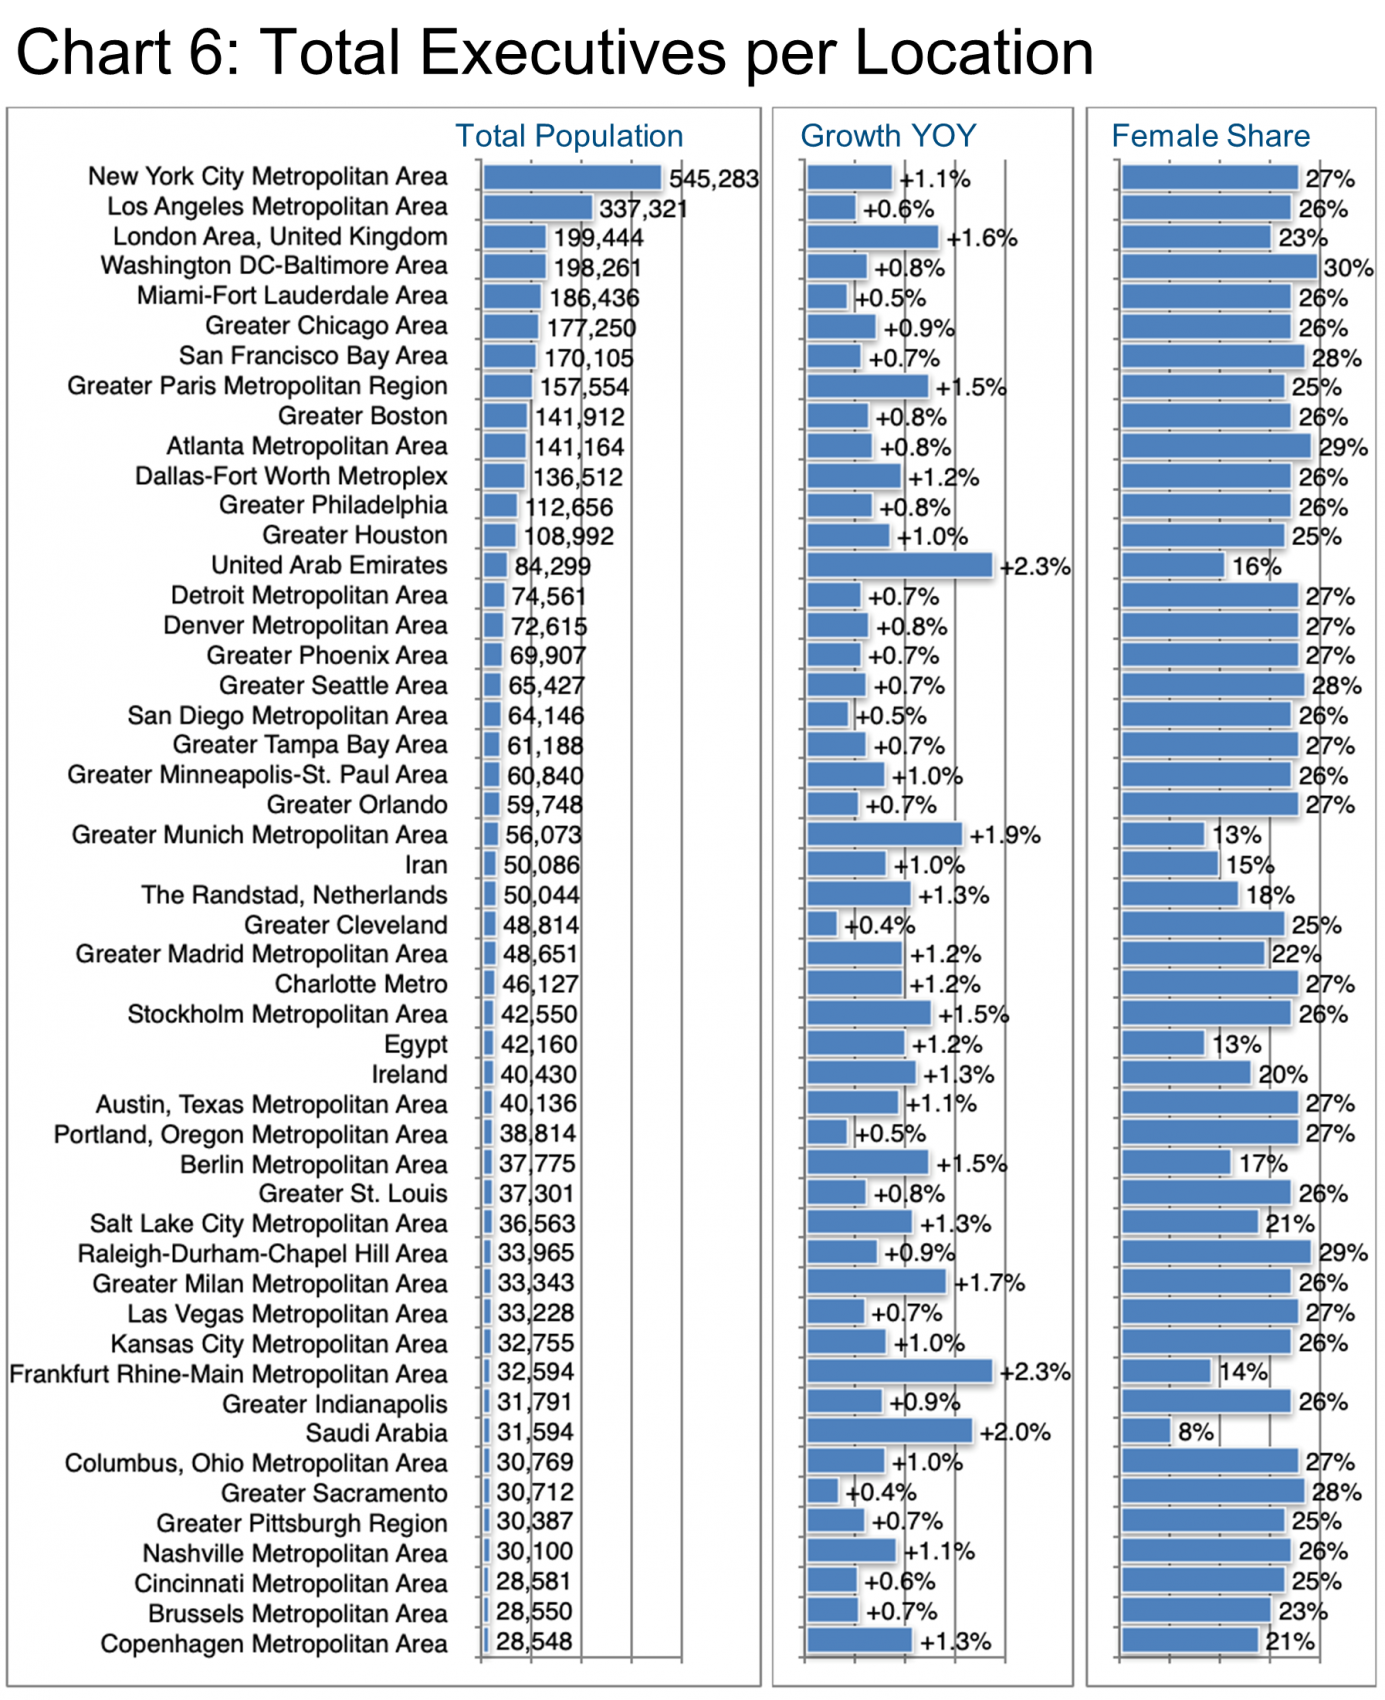
Nevertheless, the mix is apparently distinct per location. See Chart 6. So it is that New York always seems to stand out in terms of the overall number of executives. In this case, New York has a fairly average 27% female share, followed by Los Angeles (26% female), and then London (23%).
In terms of growth, there seems to be an inverse relationship between the highest growth in executive populations YOY and the female share. This is as evidenced by the UAE, Frankfurt, Saudi Arabia, and Munich.
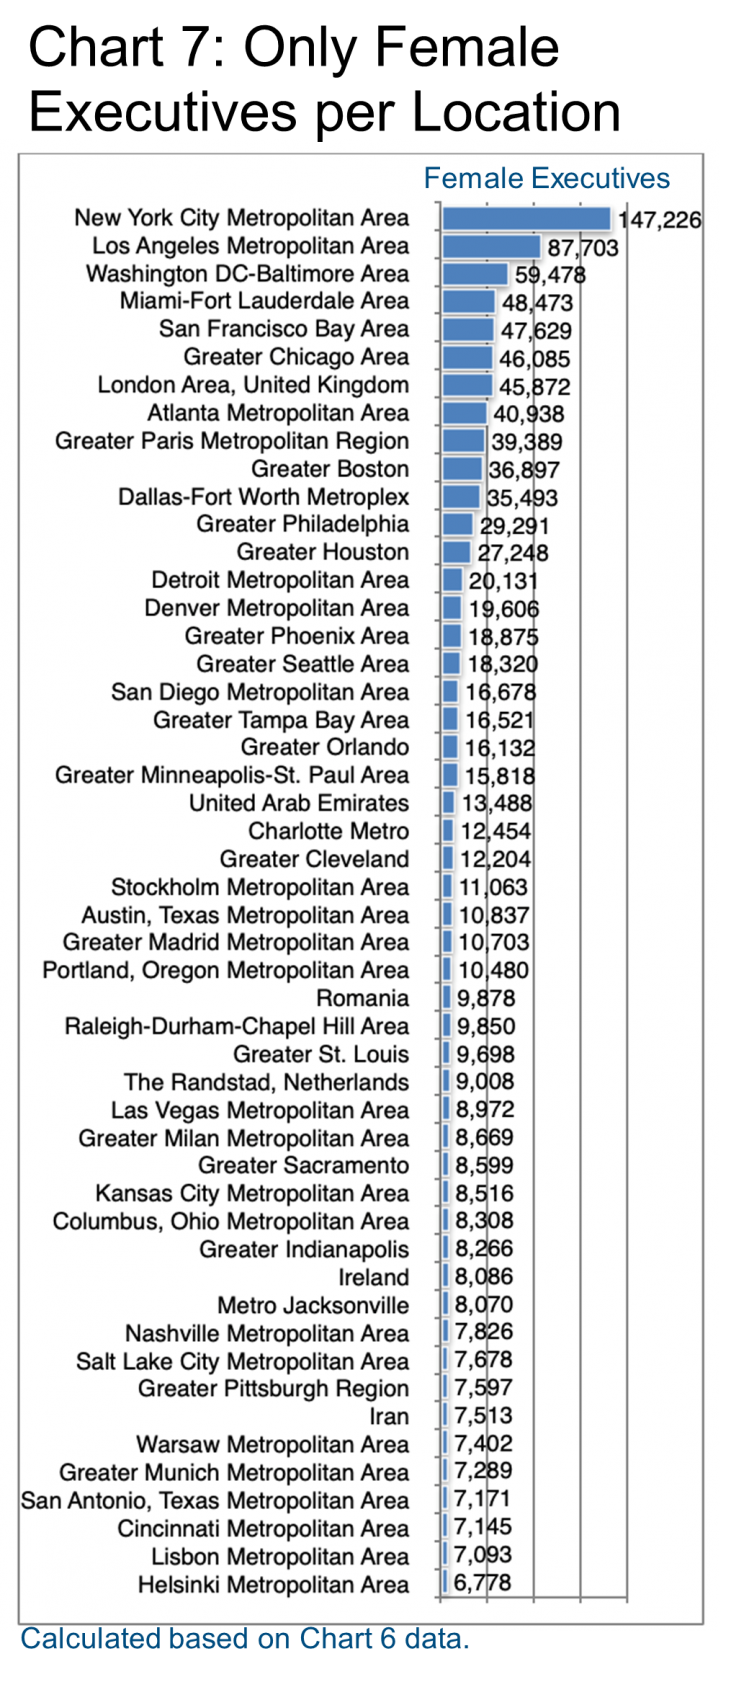
Chart 7 reselects only the female executive populations and re-ranks the locations. Among many other changes, London moves down the ranking while San Francisco moves up.
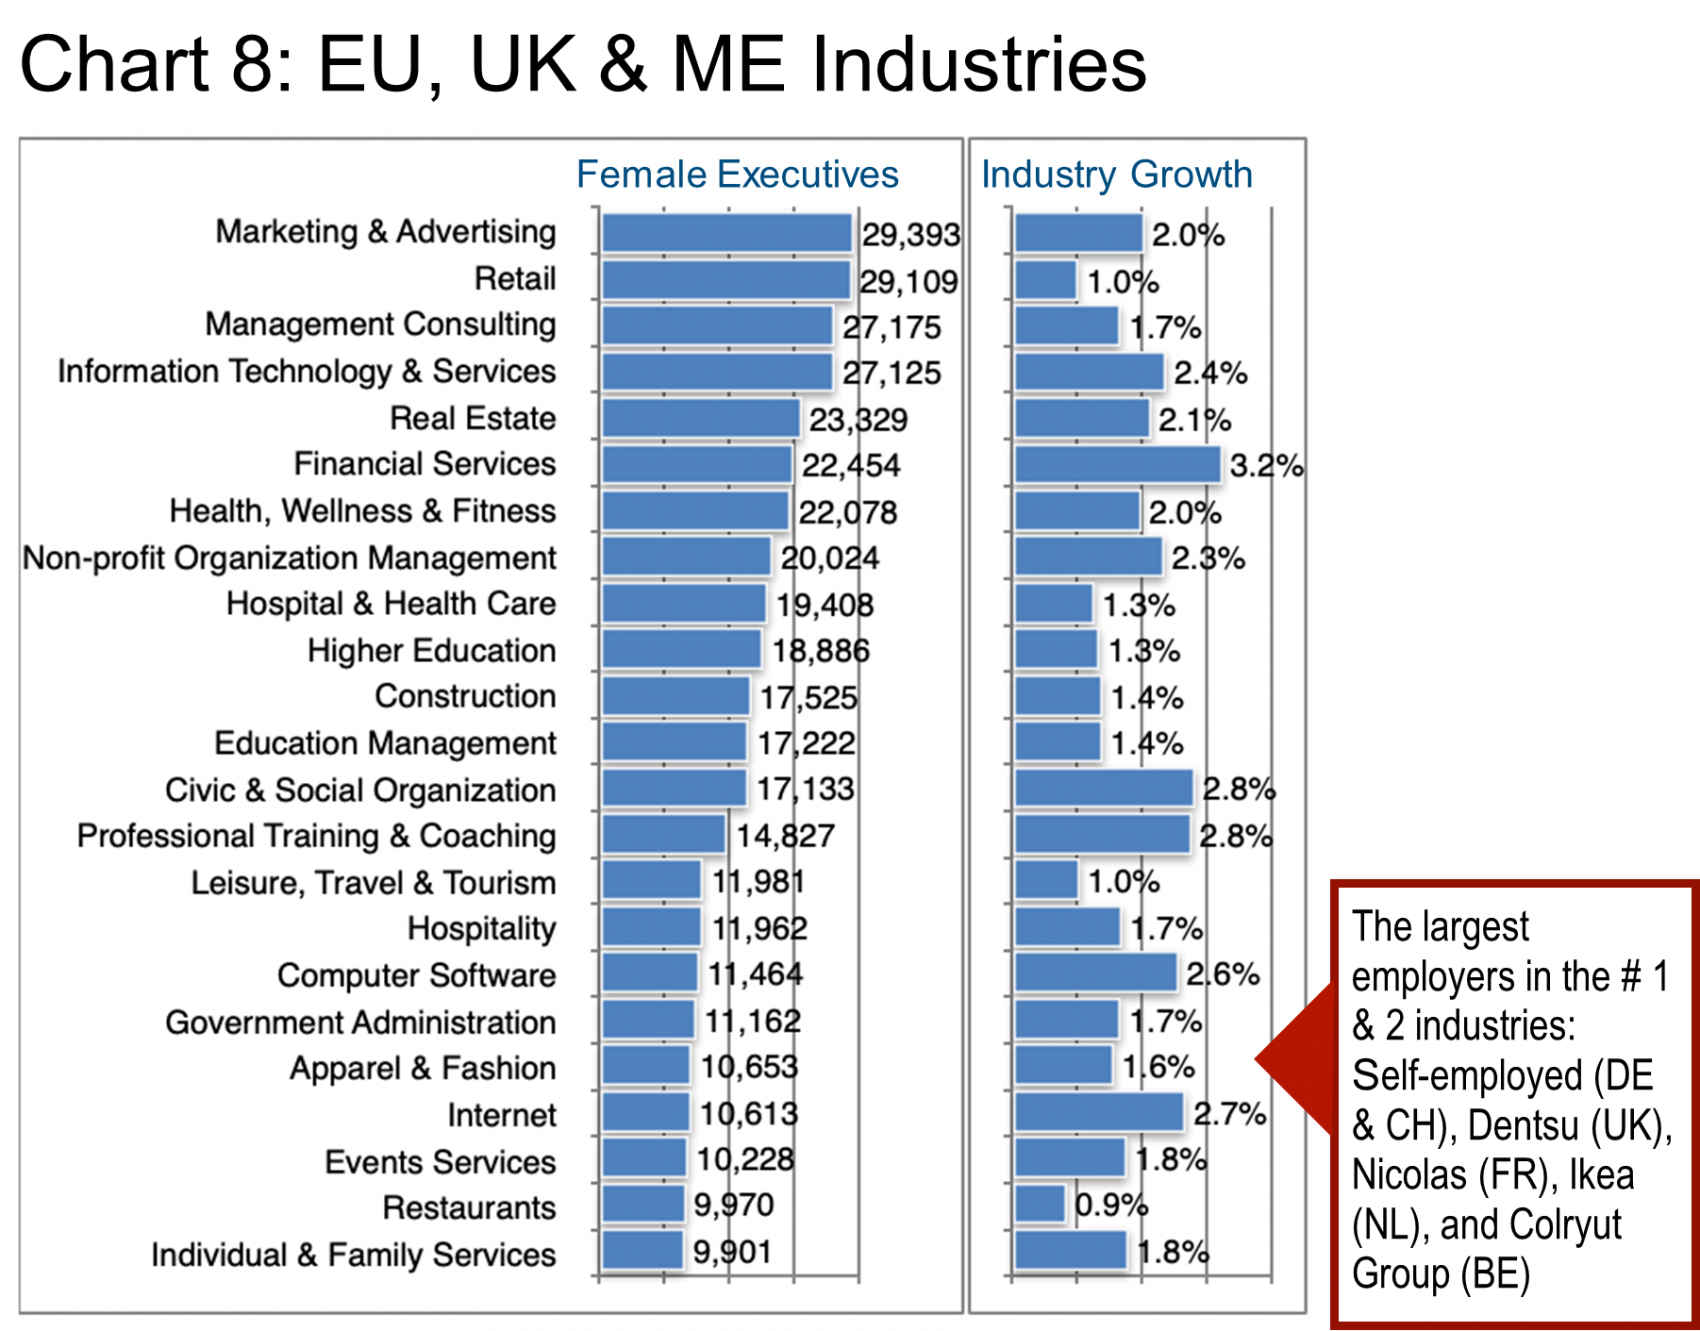
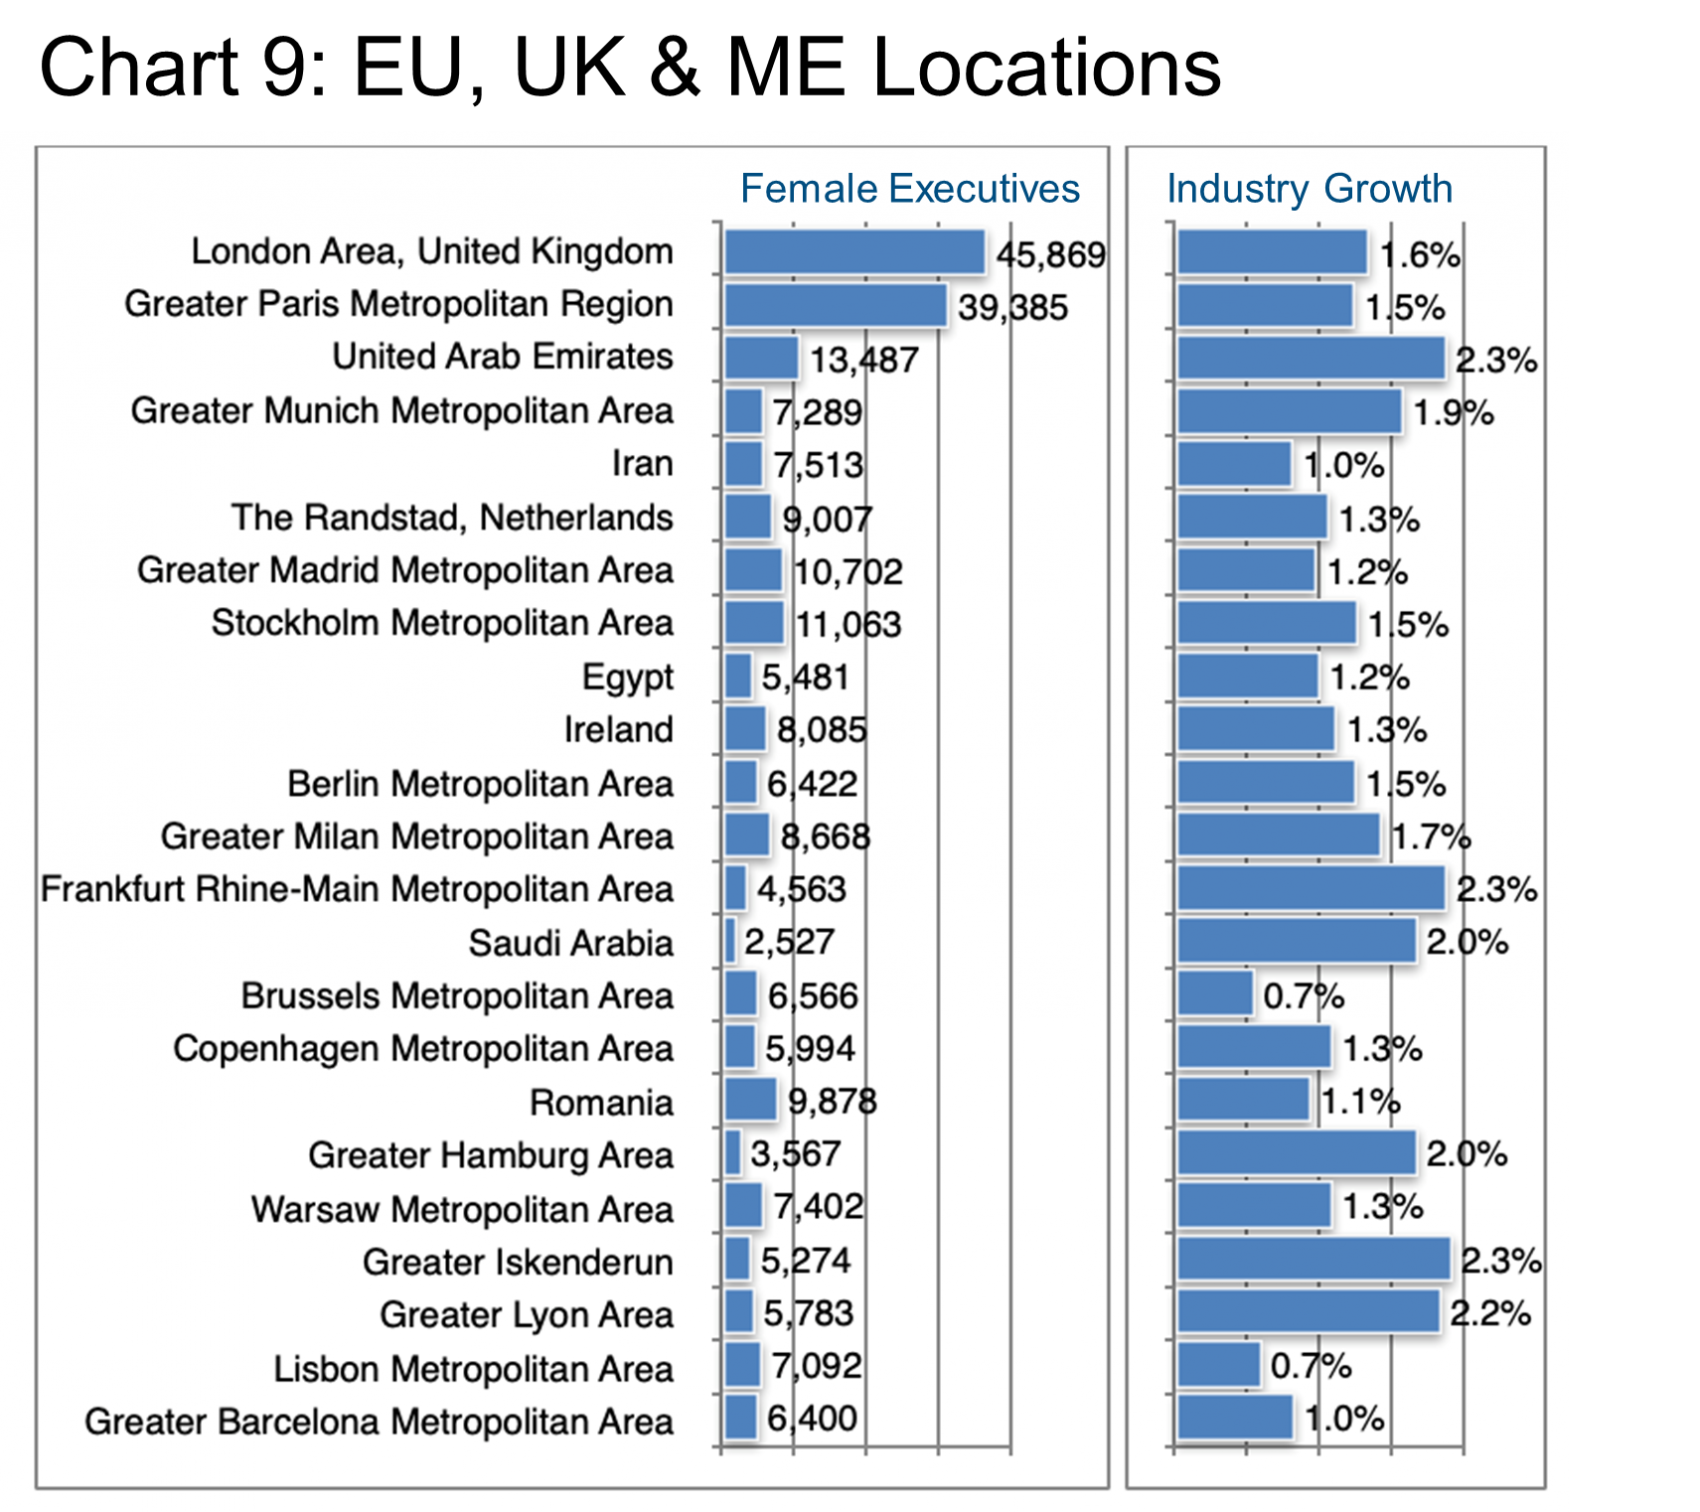
US data may color the prior charts. So let us focus specifically on the EU, UK & ME cohort for a moment and examine the number of female executives who are there by industry (Chart 8) and by location (Chart 9). Here we offer only the top 25 in each case. However, the top five industries now include Retail, Management Consulting and Information Technology. This is quite a change from the overall data on Chart 4. Note that we do not have specific growth rates for the female executive populations. But can only offer industry growth rates. This bodes well though for women executives in the faster-growing industries. These are namely Financial Services (+3.2%), Civic & Social Organization (+2.8%), Professional Training & Coaching (+2.8%), and Internet businesses (+2.7%).
Chart 9 simply underlines the incredible importance of London and Paris in this cohort, particularly for female executives.
Peter Irish, CEO The Barrett Group
Click here to download a printable version: Industry Update – Female Executives
Editor Note:
In this particular Industry Update “executives” will generally refer to the Vice President, Senior Vice President, Chief Operating Officer, Chief Financial Officer, Managing Director, Chief Executive Officer, Chief Human Resources Officer, Chief Marketing Officer, Chief Information Officer, Managing Partner, and President titles. Unless otherwise noted, the data in this Update will largely come from LinkedIn and represents a snapshot of the market as it was at the time of the research.
Is LinkedIn truly representative? Here’s a little data: LinkedIn has approximately 722 million users, 174 million in the US, and 163 million in Europe. (See Source.) LinkedIn is by far the largest and most robust business database in the world, now in its 18th year. LinkedIn defines the year-over-year change (YOY Change) as the change in the number of professionals divided by the count as of last year. “Attrition” is defined as the departures in the last 12 months divided by the average headcount over the last year.