
INDUSTRY UPDATE: Big Tech – September 2021
INDUSTRY UPDATE – Big Tech
Big Tech Companies
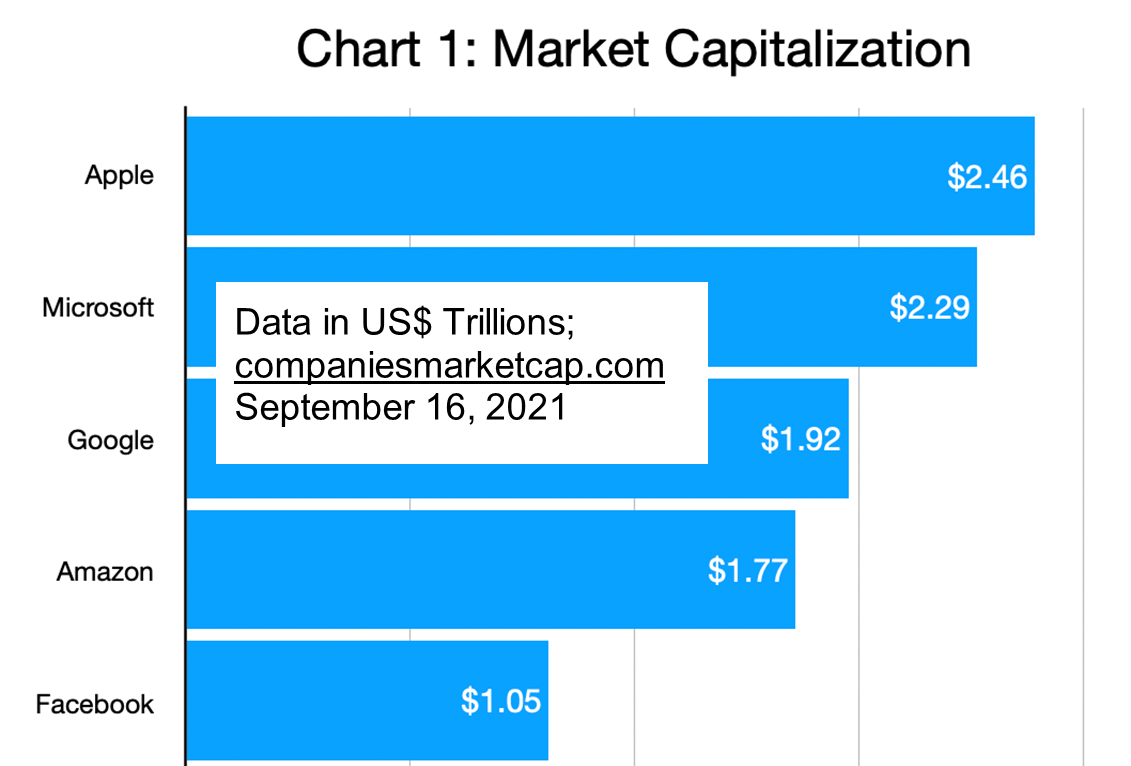
Technology is a big subject and one very close to our hearts here at the Barrett Group, among other reasons because it is the co-equal top industry where our clients land executive appointments (along with financial services). We expect to look into “tech” through a number of different lenses. But let us begin with the undeniable juggernauts in this segment, so called “Big Tech Companies.” Why are they “big?” Well, besides everything else, they have the largest market capitalization of all traded companies. (Barring only Saudi Aramco, that would make the ranking at number 4 but is, of course, not in tech; Chart 1.) They are big in other highly relevant ways, too. For example, in the scope and breadth of the number of executives they employ.
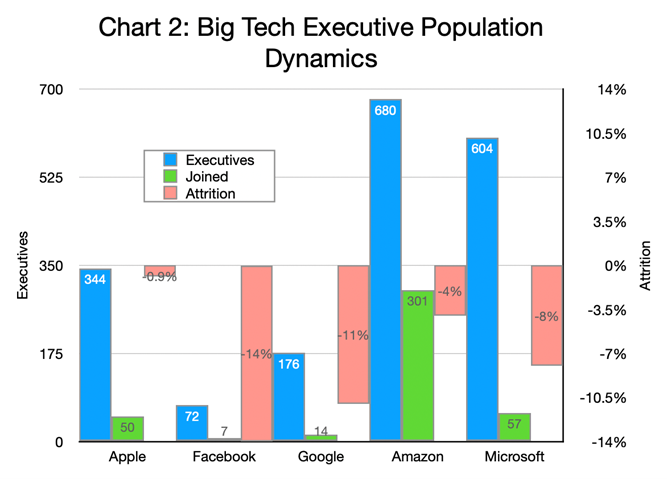
As we define executives below, these companies employed 1,876 such positions and added 429 in the last 12 months (Chart 2). One could philosophize about the number of executives per unit market capitalization. By this measure Facebook looks good and Amazon looks less good. But other measures may be more important. For example, Amazon delivered the lion’s share of executive employment growth in this group (301 executive positions). While Facebook showed the least growth (7 executives). Attrition ranged significantly from a low of 0.9% at Apple to a high of 11% at Google and 14% at Facebook. Please note though that these departures could have been motivated by either the executive or the company.
Editor’s Note:
In this Industry Update “executives” will generally refer to the CEO, CFO, COO, and Vice President titles only. Unless otherwise noted, the data in this Update will largely come from LinkedIn. It represents a snapshot of the market as it was at the time of the research. Is LinkedIn truly representative? Here’s a little data: LinkedIn has approximately 722 million users. 174 million in the US. 163 million in Europe. (See Source) It is by far the largest and most robust business database in the world, now in its 18th year. LinkedIn defines the year-over-year change (YOY Change) as the change in the number of professionals divided by the count as of last year. “Attrition” is defined as the departures in the last 12 months divided by the average headcount over the last year.
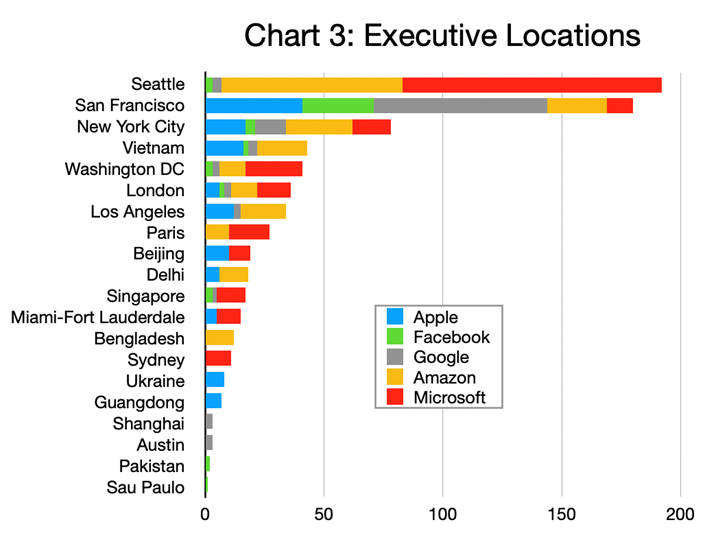
Considering the executive footprint of these companies (Chart 3), Seattle comes out on top followed by San Francisco, New York City, Vietnam, and Washington, DC. Apple’s executive staff focuses on San Francisco, of course, as are Facebook and Google. Amazon and Microsoft favor Seattle.
Per Chart 4, Apple and Amazon secure Vietnam’s place in the chart with high executive growth (45% and 91% respectively). London does well with Apple, Microsoft, and Amazon (50%, 83%, and 40% respectively). And Paris benefits from Amazon and Microsoft (43% and 21%).
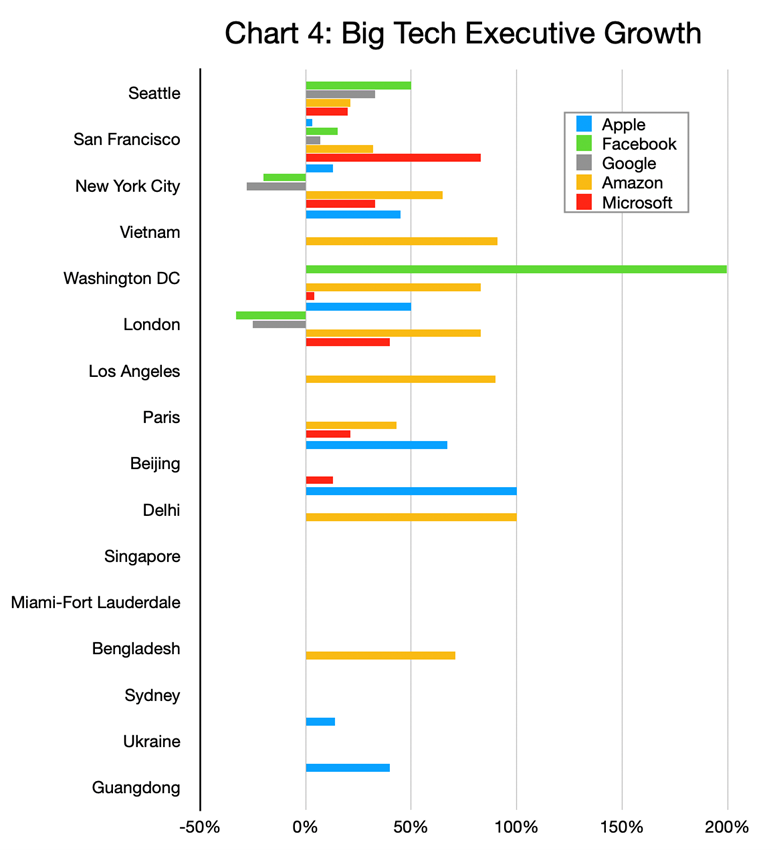
We caution readers not to overreact to the high growth rates as the baselines may be very small. For example, Facebook’s 200% growth in Washington, DC-based executives resulted from the addition of just 3 positions. Another example is Apple in Beijing: 10 employees per this data represent 67% growth and 7 in Guangdong (plus 40%). Amazon seems to have been driving growth on multiple continents while others pursue a focus-at-home strategy.
The executive skill sets that these big tech players employ are both highly diverse and predictable (Chart 5). That Apple focuses on Apple Products for example, or Microsoft on Microsoft Azure is not in the least surprising. What it surprising is the extent to which Microsoft executives have populated this data on LinkedIn versus other companies. So much so that a glance at Chart 5 reveals the weight of the red bars versus all others. We suspect this is culturally driven, but encourage readers, therefore, to consider this data with a grain of salt as it is likely skewed by this phenomenon.
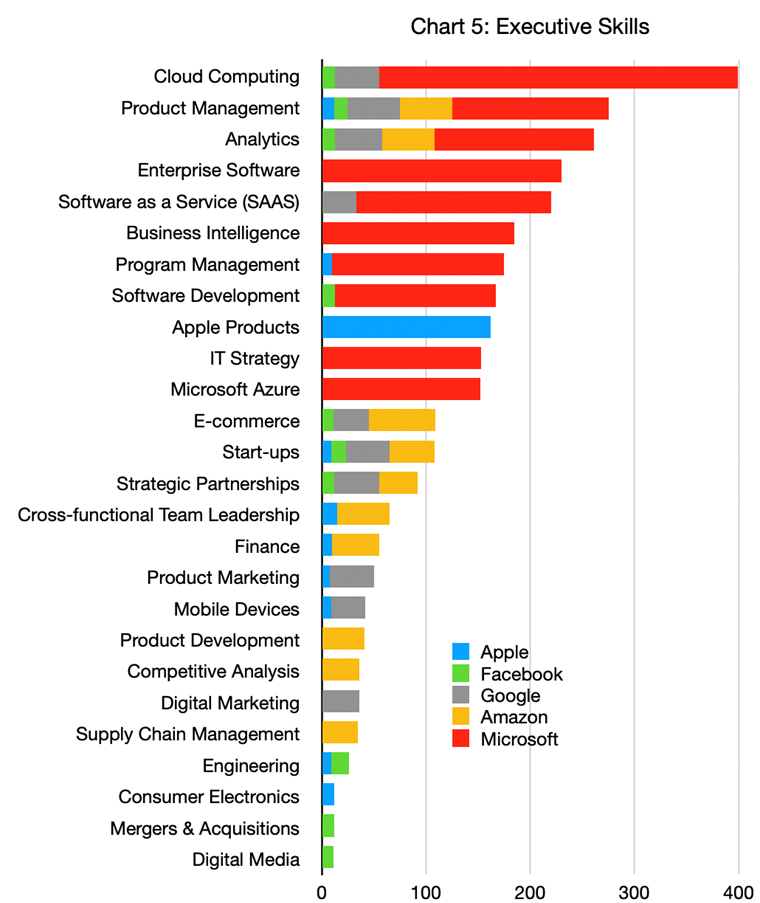
Of course, if you as an executive made your career targeting decisions based on this data alone, you would be guilty of driving by looking in the rearview mirror. These historical data are not necessarily predictive about future hiring practices, though they certainly reveal much about the current footprint, growth dynamics, and skills emphasis so far within these five large employers.
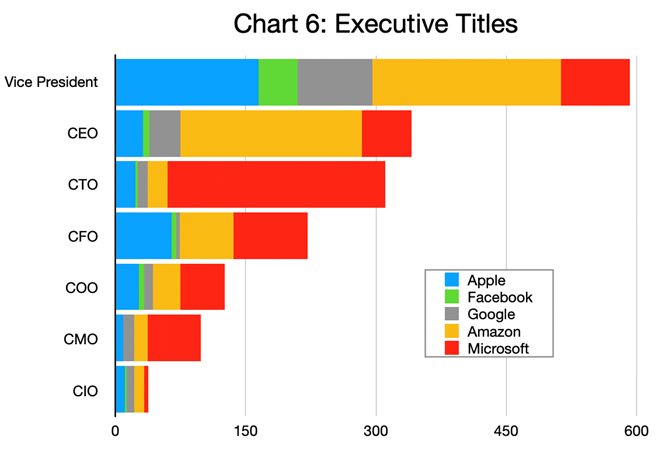
Executives considering these five big employers will also be interested to understand the “title geography” of this landscape. I.e., the respective prevalence of various titles. Chart 6 provides insight covering about 92% of the total executive populations at these companies. Why there are so many CTOs at Microsoft or CEOs at Amazon are good questions. But, in any case, this suggests there is significant opportunity for skilled executives to move in and move up.
We are not able to address the subject of gender diversity at the company level via LinkedIn. However, in general the IT industry shows a very low (13-18%) share of female executives. And while some companies such as Microsoft routinely earn relatively high scores for diversity in general, overall these tech titans are not leaders in gender diversity as far as we can tell.
Readers may be forgiven for thinking that this is a small community with frequent departures and additions moving from one of the big tech companies to the other. That is only somewhat true. Looking at the movements in and out of the five Big Tech companies in the last year (Chart 7), we find only 7 (out of 40—looking only at the top ten changes per company) that changed horses within this cohort.
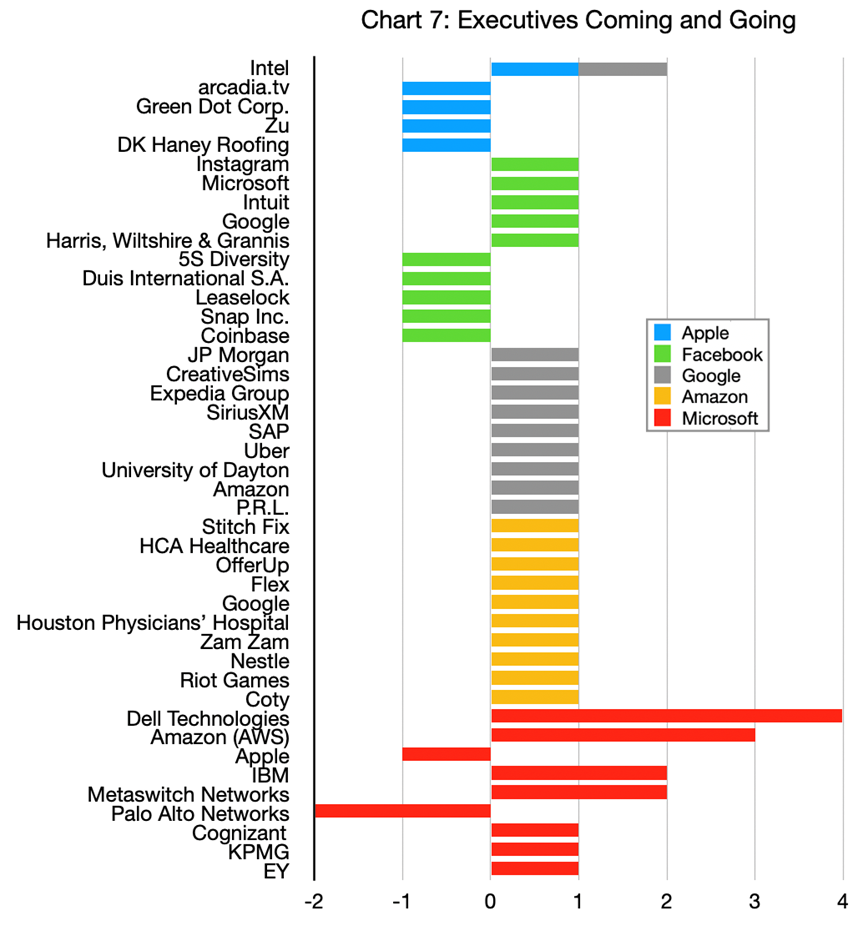
Dell Technologies seems to have been the largest top ten donor (to Microsoft). Although Amazon also gave up 4 executives in the period (3 to Microsoft and 1 to Google). Intel and IBM also contributed 4 executives to Apple, Google, and Microsoft. While Palo Alto Networks, Facebook, and Apple acquired executive talent from Microsoft. Facebook attracted one executive from Google, just to round out the picture.
In our recent Industry Update on Information Technology, we also looked into three up-coming technologies (machine learning, artificial intelligence, and blockchain) to see how widely these skills are distributed. We discovered less than 5% of the IT executive population claimed each of them on its own. A review of the same technologies among big tech reveals more about company culture, in our opinion, than about the skills’ prevalence.
Apple’s executives were uniformly closed-mouthed about this with only one each claiming blockchain or machine learning as a skill. And none at all laying claim to artificial intelligence. Facebook’s executives were similarly reticent to share. Google’s executives were more open: 8 cited machine learning and 6, artificial intelligence). But Amazon and Microsoft were much more open, the former numbering 15 on machine learning and 4 on artificial intelligence. While the latter included 26 on blockchain, 64 on machine learning, and 56 on artificial intelligence, with 7, 9, and 2 new hires respectively. In any case, we suspect these skills are much more widely distributed and desired within big tech than their executives’ LinkedIn profiles let on.
Peter Irish, CEO The Barrett Group
Click here to download a printable version: Industry Update – Big Tech


