
INDUSTRY UPDATE: All Industries – December 2021
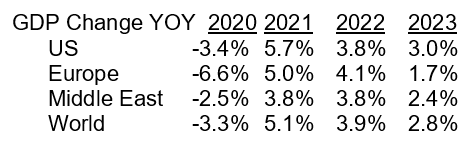
Few dispute that 2021 has been a difficult year for the world and industries as it tries but does not yet quite succeed to leave the pandemic in the rearview mirror. The economic devastation at least has receded to some extent, though, in most regions as the survivors have learned to cope. A recent forecast by the Conference Board suggests that GDP growth will continue quite strongly into 2022 (See source) and beyond. This is as the supply chain gaps left by the pandemic are successively resolved and vaccination rates creep up.
Here is their forecast and a bit of history for context:
None of this growth will occur without talented executives to drive it. And it is our business at the Barrett Group to help executives find opportunities that fit their whole-life requirements. This is something we have done very successfully now for more than 30 years.
In this publication, we wish to call attention to the activity in the executive market. We segment it in various ways that we believe business professionals will find useful. These segments include by industry, geography, specialization, and other criteria relevant to the executive market. Our principal source is LinkedIn. We explain why we regard this as an essential source in the Editor’s Note below.
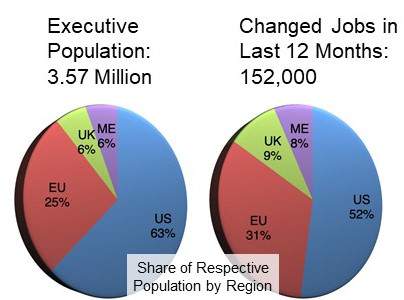
In total, we focus here on an executive population of about 3.57 million in the US, EU, UK and Middle East. It grew by about 2% in the last twelve months. Approximately 152,000 of these executives changed jobs during this period. This is an average “churn rate” of 4.3%—higher in the EU, UK, and ME and lower in the US.
New York (261,079) remains the location with the largest executive population. New York is followed by Los Angeles (184,001). San Francisco (99,336), Washington DC (96,153), and London (90,684) are among the top five. In the EU, UK & ME grouping, London predominates. And is followed by Paris (50,383), the UAE (37,082), Stockholm (35,485), and Madrid (31,106).
In total, female executives constitute just 27% of the executive pool. Female executives number more in the US (30%) and less in the EU, UK & ME cohort (21%).
What do these executives actually do?
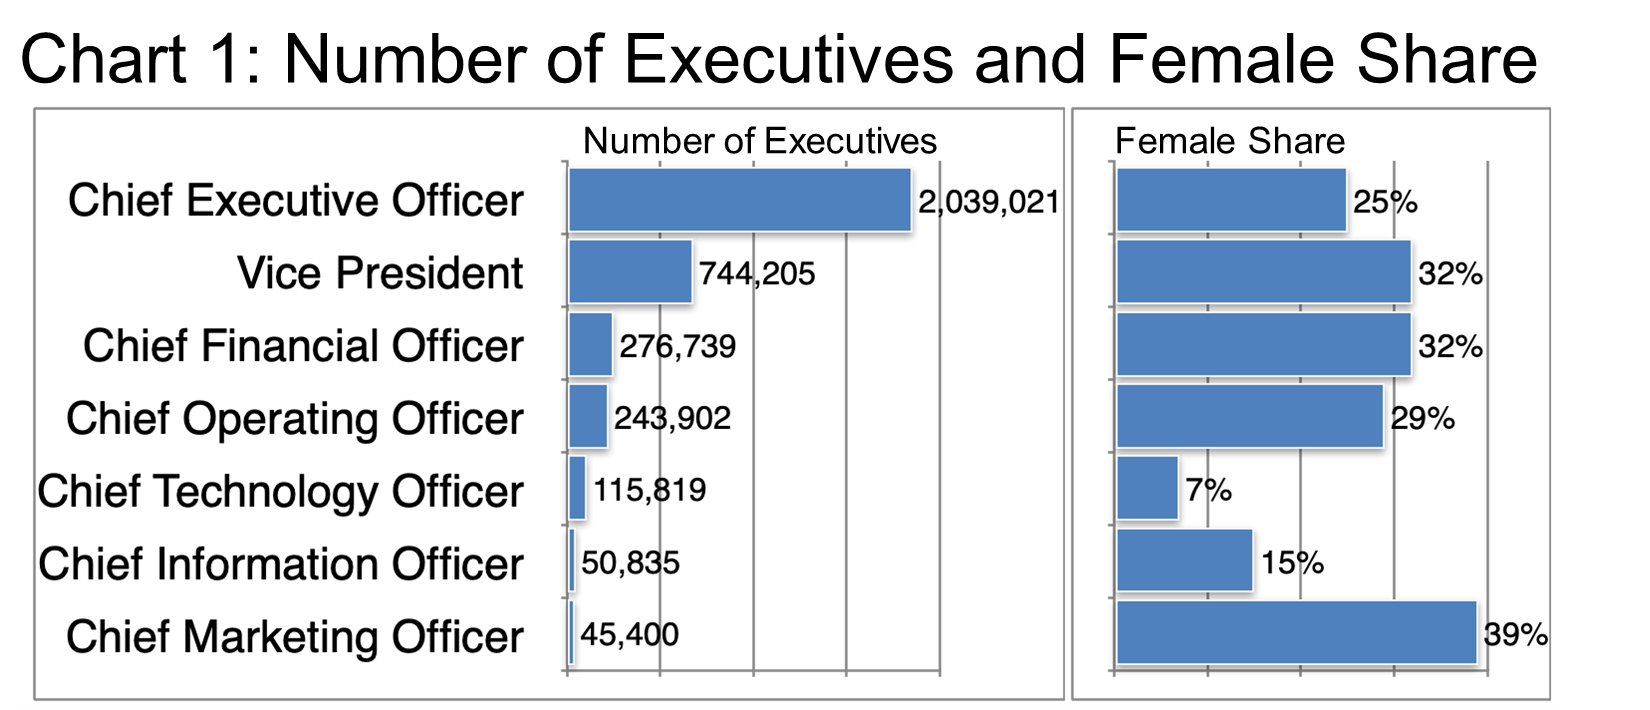
As far as titles are concerned, they are predominantly occupied in the C-Suite with a smattering of Vice Presidents. Chart 1 provides an overview of the distribution by title as well as the relative gender dispositions.
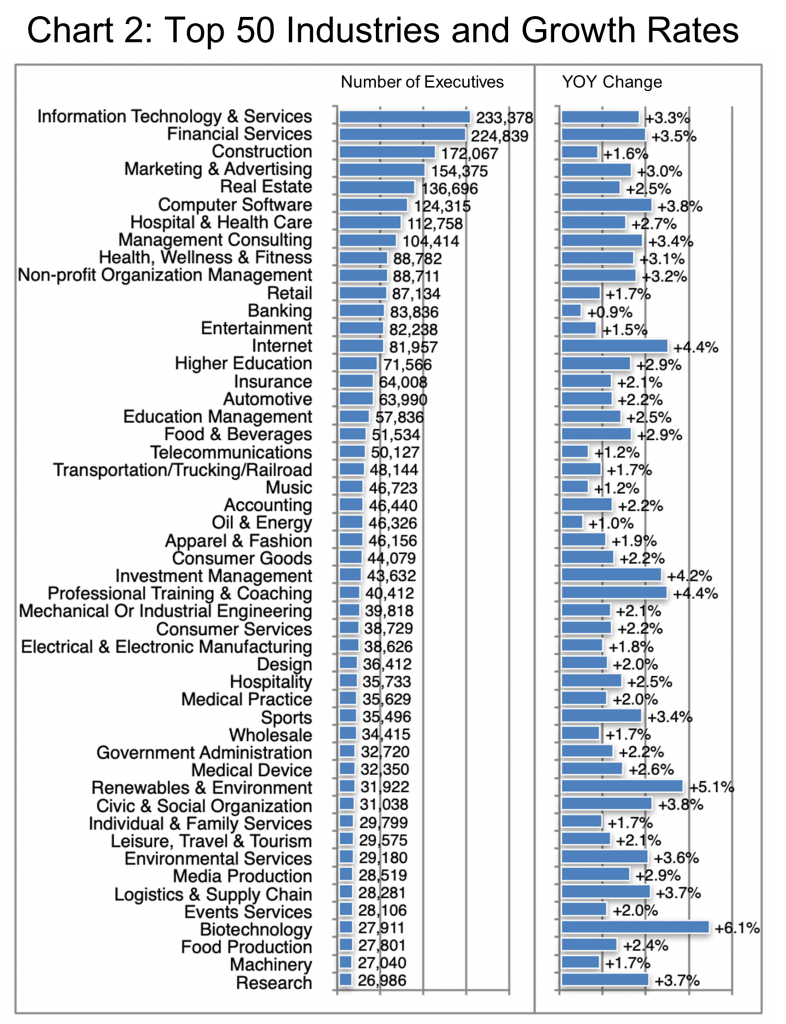
It is important to remember we are viewing this data at a rather high level of aggregation. However, Chart 2 provides an excellent perspective. It displays how the top 50 industry segments are developing in terms of the number of relevant executive positions and the change year on year.
IT and Financial Services predominate in the total number of executives employed and exhibit healthy growth rates of 3.3% to 3.5%. Biotechnology tops the chart in terms of growth at 6.1%. And is followed by Renewables & Environment (+5.1%), Professional Training & Coaching and also Internet (+4.4% each). Investment Management (+4.2%), and Computer Software, as well as Civic & Social Organization, are at 3.8% each. It is no surprise to see Logistics right behind them at 3.7%. This is given the global supply chain issues so many industries are currently facing.
Interestingly, LinkedIn actually cites “high demand” for the entire executive pool at the time of this publication. And it is slightly higher in the UK.
Note: Barrett Group clients have access to our significant data resources via their assigned research specialist.
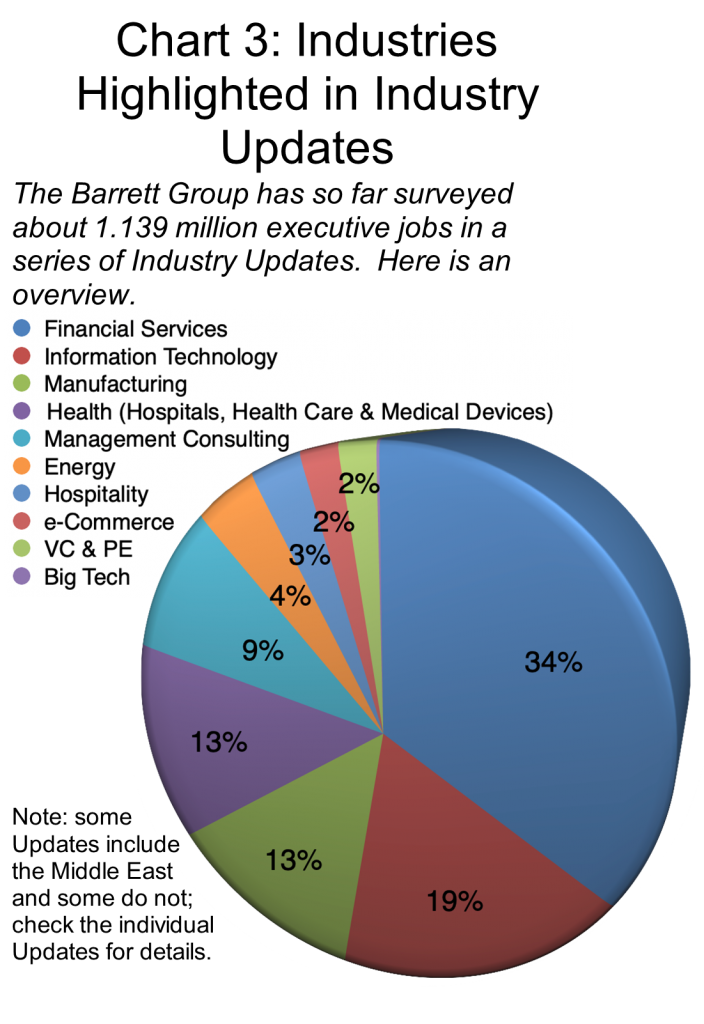
Per Chart 3, Financial Services is by far the largest individual business segment we have so far surveyed (comprising circa 389,000 executives in the US, EU & UK).
So it is not surprising that this industry is so well represented among the top employers of executives (Chart 4). Many of these companies show significant growth in their executive ranks. But many more show high attrition, meaning, there is a lot of movement in this population.
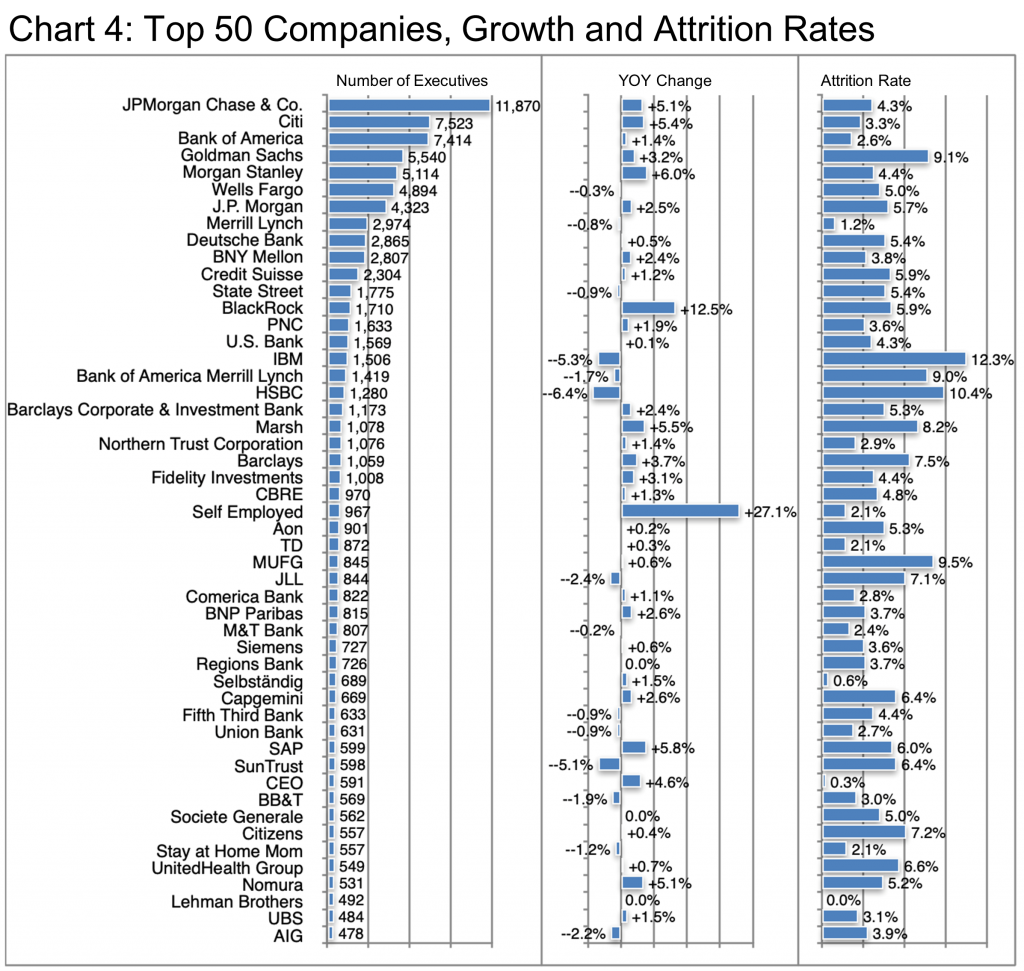
Referring to Chart 4, Black Rock’s growth is exceptional. However, so is the Self-employed line item. Self-employed is up 27.1%. Not including the “Selbständig” (German for self-employed) line item, a further almost 700 executives who work for themselves. Together these Self-employed line items would rank right behind Black Rock in terms of the total number of executives employed.
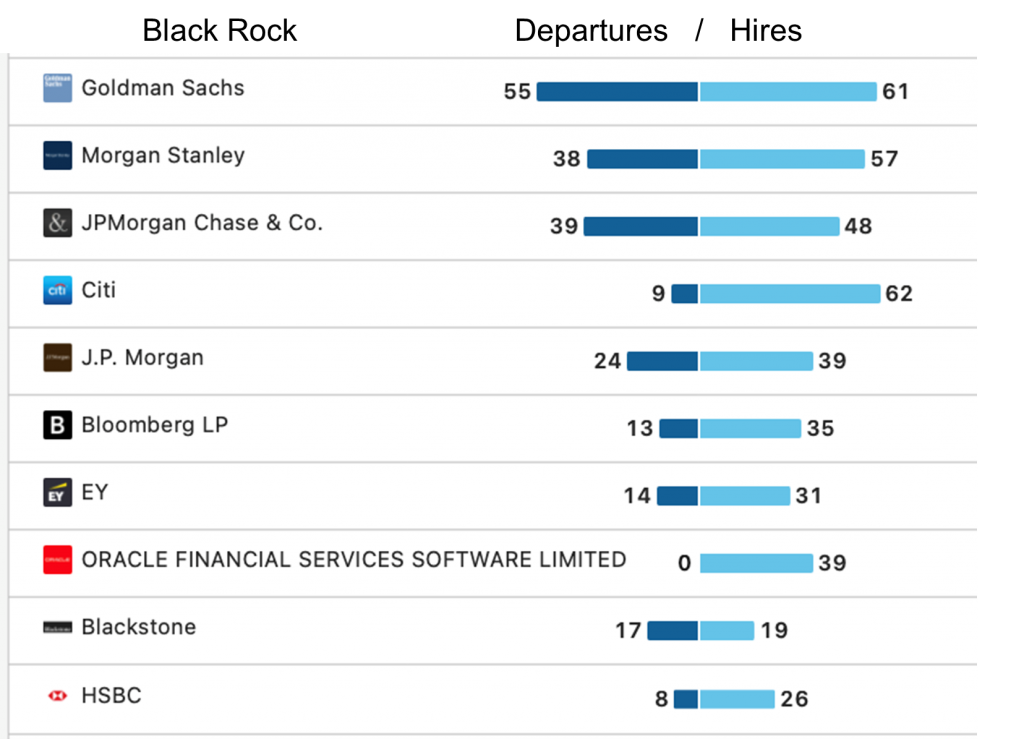
However, out of curiosity, you might wonder about the executive movement at a fast-growing company like Black Rock.
Here is a data excerpt for the largest professional sources or destinations of Black Rock’s executive employees.
Apparently, attrition rates are generally quite high in the Financial Services realm. This indicates that there are plenty of executive positions routinely available. This is because companies continuously reshuffle their priorities and therefore their executive management requirements.
Among non-financial service companies in the ranking, IBM stands out negatively due to its contraction driven by high attrition. However, in fact, IBM has carved out its managed infrastructure services division into a separate company called Kyndryl (NYSE symbol KD) as of November 2021.
“The separation of Kyndryl is one of many actions we are taking to sharpen our focus on hybrid cloud and AI, leverage a portfolio clearly focused on technology and consulting, and achieve our growth objectives. We look forward to our partnership with Kyndryl as it moves forward as an independent company.” [Arvind Krishna, IBM chairman and chief executive officer stated in a release dated November 3, 2021.]
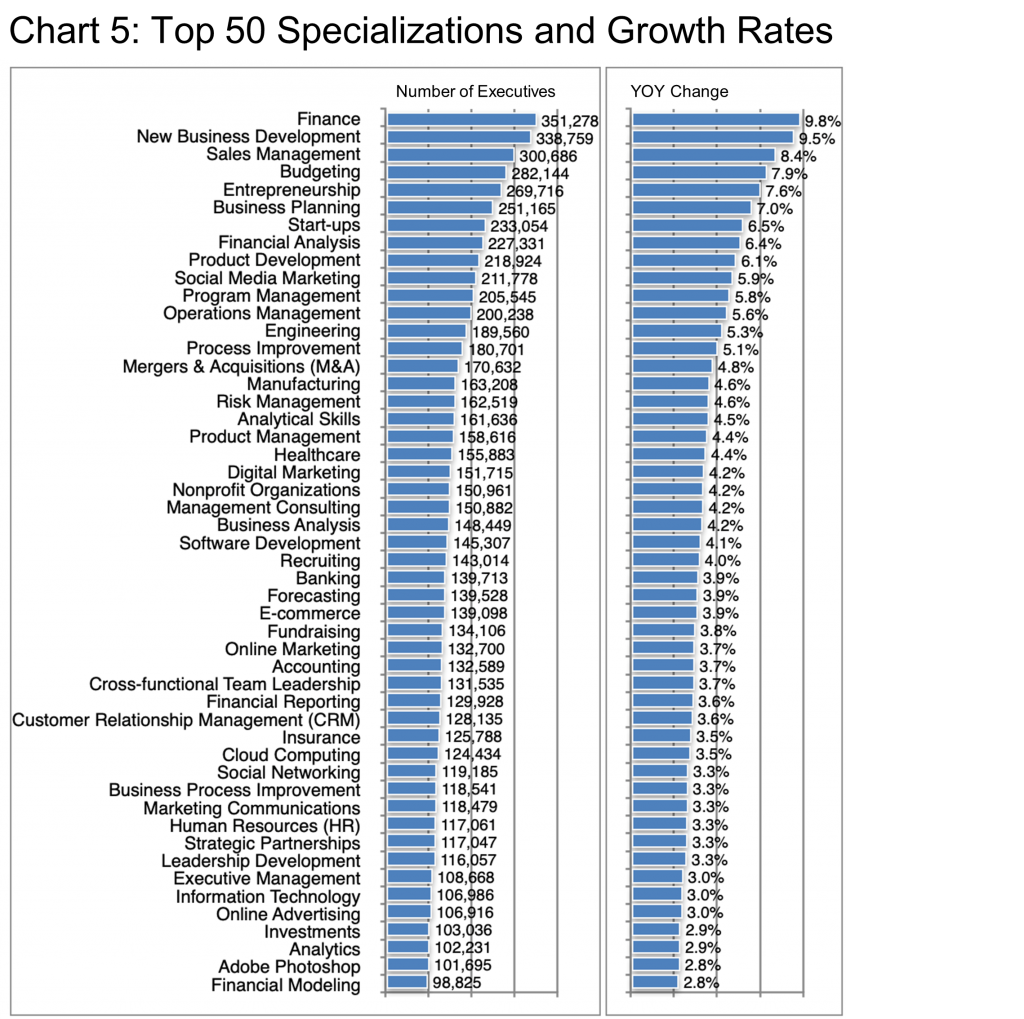
Many Barrett Group clients wish to change roles for various reasons.
The contents of Chart 5 are good news. This is as many of these specializations are relatively generic and therefore transferrable from one industry, company, or role to another. These numbers suggest that some 35,000 executive finance roles were added in the past year, for example. And more than 24,000 sales management roles, 11,000 operations management positions, 6,000 digital marketing opportunities, etc.—all added in the past year.
Remote working has surged in the past two years and will likely play an ever-greater role going forward. However, location is still critical to many executives who want to maximize their quality of life. Chart 6 examines the top 50 locations where executives in our All Industries Update are engaged.
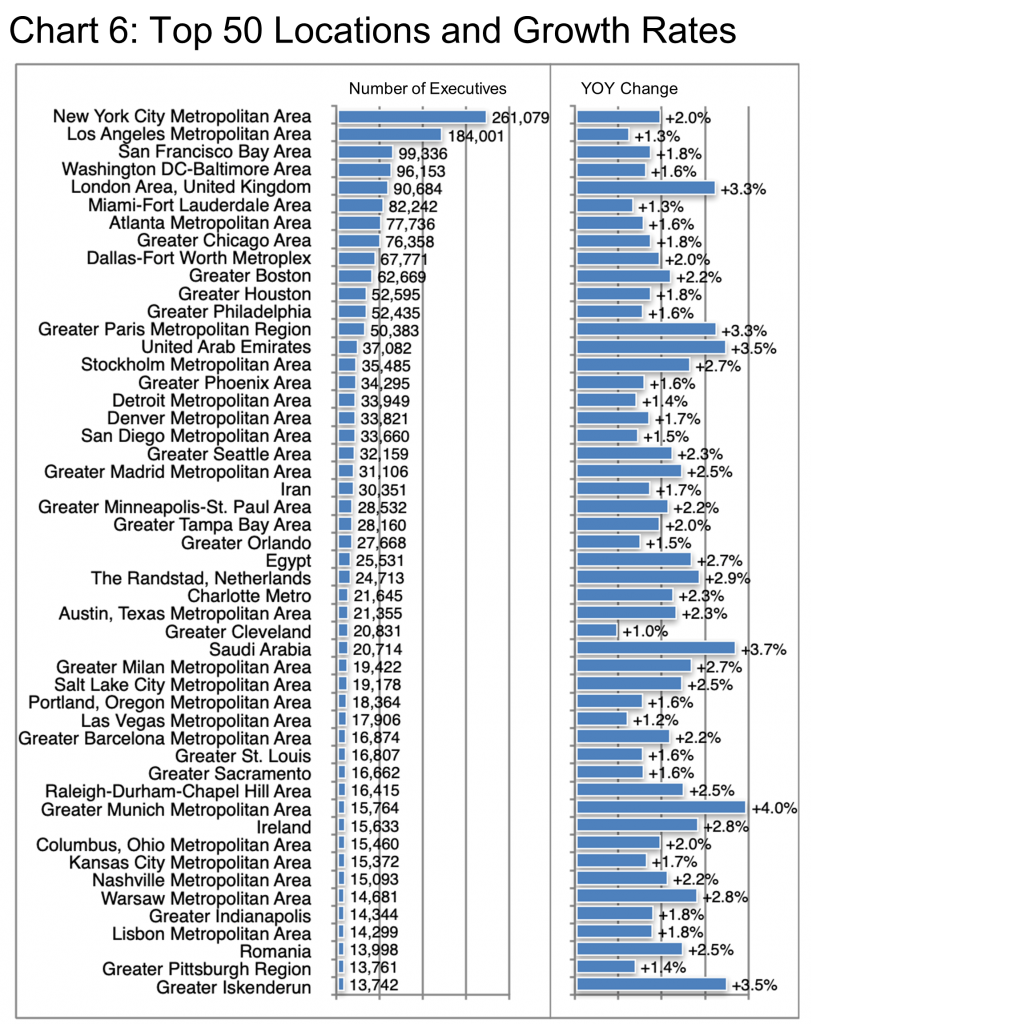
That New York City comes out on top probably surprises no one.
However, the rankings of London, Paris, or the UAE may indeed come as a surprise, not to mention their relative growth rates—all of them higher than US locations at similar rankings in the top 50. In fact, all of the top-ranking locations for growth are actually outside the US.
Nevertheless, 2% growth on a baseline of 261,000 means that New York City added about 5,000 executive positions in 2021 whereas London added circa 3,000, Paris 1,700, and the UAE about 1,200. One theory is that this is a bounce back from the industrial lows of 2020, however, considering the GDP growth forecasts offered at the beginning of this Update, these may well continue into the next few years as supply chain issues are resolved and pent up consumer spending raises demand.
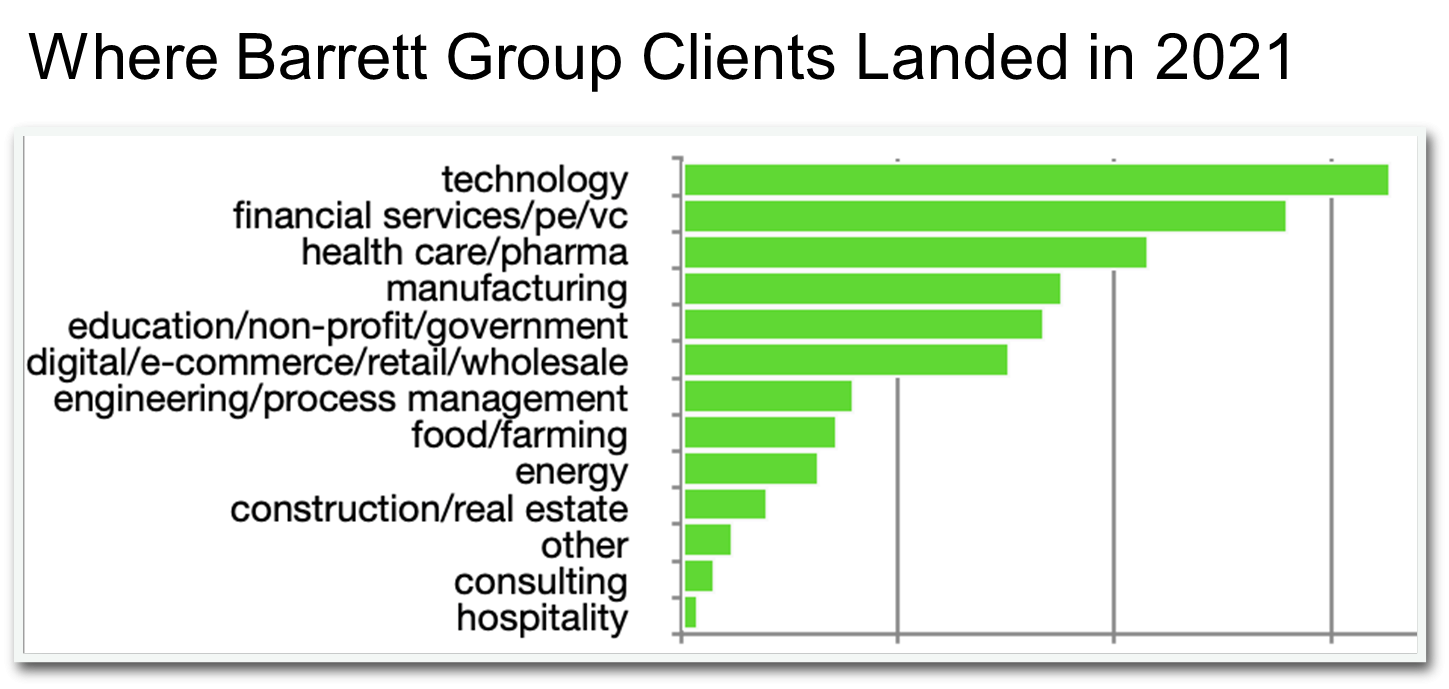
In any case, the Barrett Group is here to help executives rediscover their passion and their ideal role, no matter where it is. In 2021, we served a broad range of clients who landed roles in the following industries while collectively achieved more than 1,000 interviews and more than an offer a day.
Peter Irish, CEO The Barrett Group
Click here to download a printable version: Industry Update – All Industries
Editor Note:
In this Industry Update “executives” will generally refer to the CEO, CFO, COO, CTO, CIO, CMO, and Vice President titles only. Unless otherwise noted, the data in this Update will largely come from LinkedIn and represents a snapshot of the market as it was at the time of the research. Is LinkedIn truly representative? Here’s a little data: LinkedIn has approximately 722 million users, 174 million in the US, and 163 million in Europe. (See Source) It is by far the largest and most robust business database in the world, now in its 18th year. LinkedIn defines the year-over-year change (YOY Change) as the change in the number of professionals divided by the count as of last year. “Attrition” is defined as the departures in the last 12 months divided by the average headcount over the last year.


