Upsidedownsizing (Part Three): Winners and Losers
Winners and losers. It does not require much conscious thought when you are in danger of drowning to swim toward anything that will keep you afloat, yet in the context of careers, executives often hold on to sinking industries simply because they do not trust themselves to make a change. Employers usually feel no such compunction, of course; witness the recent ruthless downsizing in the tech sector, for example.
So let us consider then which industries are likely to gain or lose executives over the coming period to offer some insight to those in danger of drowning (metaphorically) or perhaps just tired of the same old business and in need of a fresh challenge. In other words, which industries are the winners and losers?
On the downside, we have already explored the tech industry where recent layoffs total 100,000 or more, or we could highlight the banking industry that has seen such turmoil lately due to Silicon Valley Bank, First Republic, Credit Suisse, etc., but let us try instead to take a slightly longer view. One perspective is that of the investor.
Where would smart money invest in winners in the current climate? Money.com offers these thoughts:
- Health Care: “Investing experts consider healthcare stocks to be “defensive”, meaning they’re among the companies that perform well no matter how the economy is doing.”
- Energy: “Energy stocks were the true outlier of 2022. Not only did they gain nearly 60% over the course of the year thanks to a huge run-up in oil prices, they were also the only S&P 500 sector to end the year in the green.”
- Industrials: “Stocks like Honeywell International, United Parcel Service (UPS) and General Electric are part of the industrials sector [and] stand to benefit from a new focus on sustainability, digitization and domestic onshoring. “ [See source.]
Continuing with the investor perspective, Fidelity offers a neat summary on a number of key US sectors (See source):
- Energy: Strong performance fueled by tight supply
- Information Technology: Looking ahead with cautious optimism
- Health Care: Short-term positives, long-term focus
- Real Estate: Bright spots in the Sun Belt
- Materials: Riding a slowing global growth outlook
- Industrials: The focus on sustainability and US manufacturing mean growth
- Consumer staples: Feeling the pinch
- Consumer discretionary: Rising costs and waning demand
- Financials: Still an out-of-favor sector
In Europe the picture is similar in many respects as energy demand remains strong and prices ease, construction hums, manufacturing shakes off supply chain constraints, retail and consumer businesses hold their breath to see if people will continue to spend, the IT and technology sector demonstrates continued growth, and freight and transportation rebound from their Covid-19 depths. (See source.) Another source predicts exceptional growth in the European automotive sector in 2023. (See source.)
The Middle East seems to be on a slightly different macroeconomic cycle.
Real estate remains highly active, as does the digital transformation of businesses with its reliance on IT and technology, including strong growth in e-commerce. Civil and military aerospace are also enjoying a resurgence, while Saudi Arabia’s lifting of the ban on women drivers has created a large, new car-buying segment in that country overnight. Telecom’s roll-out of 4G and continued investment to diversify the energy segment round out a broadly positive economic outlook for the Middle East. (See source).
The Barrett Group keeps tabs on an executive population (see Editor’s Note for definitions) that numbers about 9.1 million across Canada, the US, EU, UK, and Middle East. This market has grown about 0.9% over the past year, and seen more than 350,000 change jobs, so that, all told, the opportunities number approximately 430,000 newly created or newly filled executive positions.
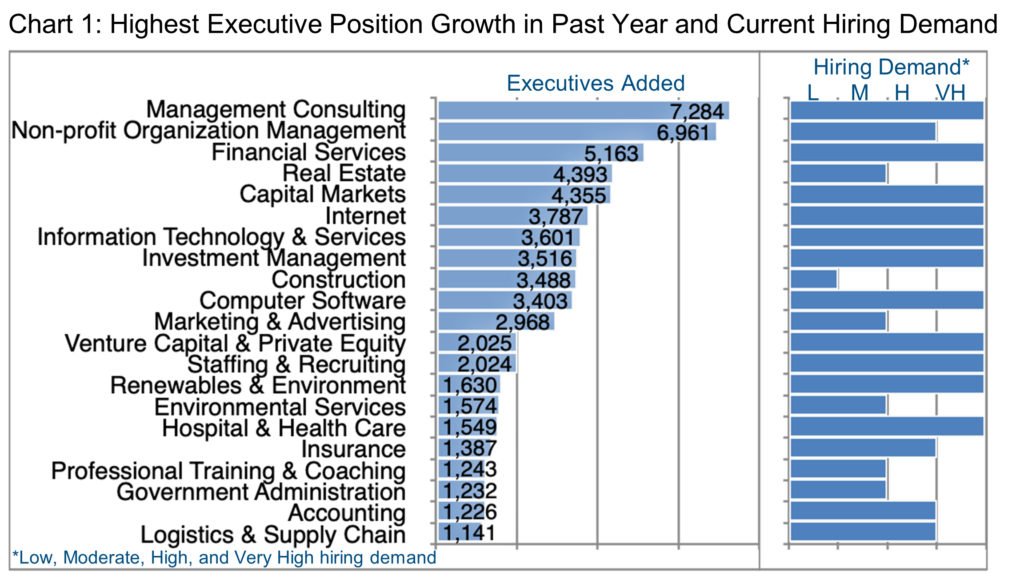
As usual, looking backward is easier than looking ahead. Chart 1 shows the industries that added the most executive positions in the past 12 months. Essentially, what Chart 1 tells us is that some sectors, such as Management Consulting, added a relatively large number of executives in the past year and are still experiencing very high hiring demand now (according to LinkedIn). Other sectors may have added a large number of executives over the past year, for example Real Estate, but are now seeing only moderate hiring demand. Others, Construction for example, have added a moderate number of executives over the last 12 months but demonstrate only low hiring demand at this point in the economic cycle.
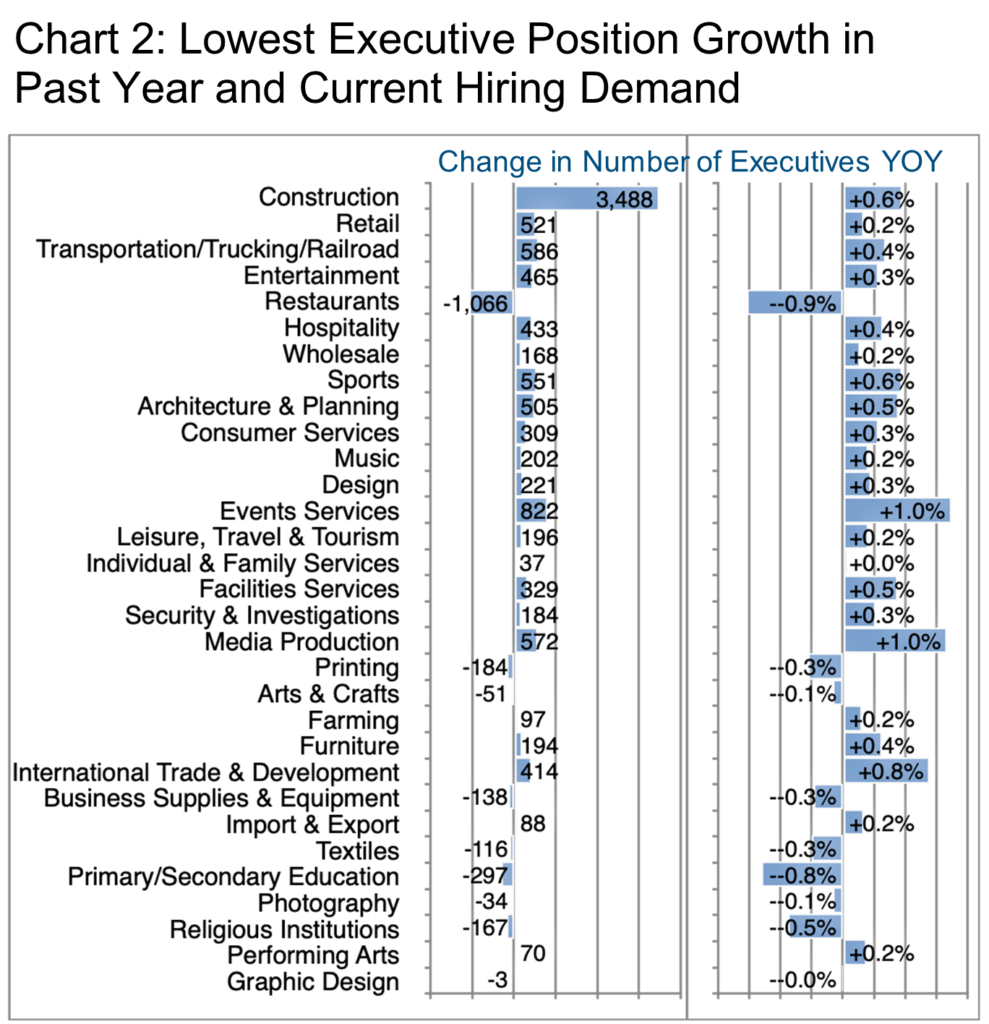
Chart 2 lists those industries all rated as having low hiring demand per LinkedIn and the relative change in the executive ranks in each of these over the past year. We provide much more granular data to our clients, of course, than these general industry overviews, but it may well be a good time to think about changing industries if you see relatively low demand and/or growth in yours.
Of course there may be bright spots (i.e. winners) in any one of the industries currently experiencing lower growth, so please do your research before making any rash decisions, but also be aware that finding the Right Role is more important in the long run than just finding a job.
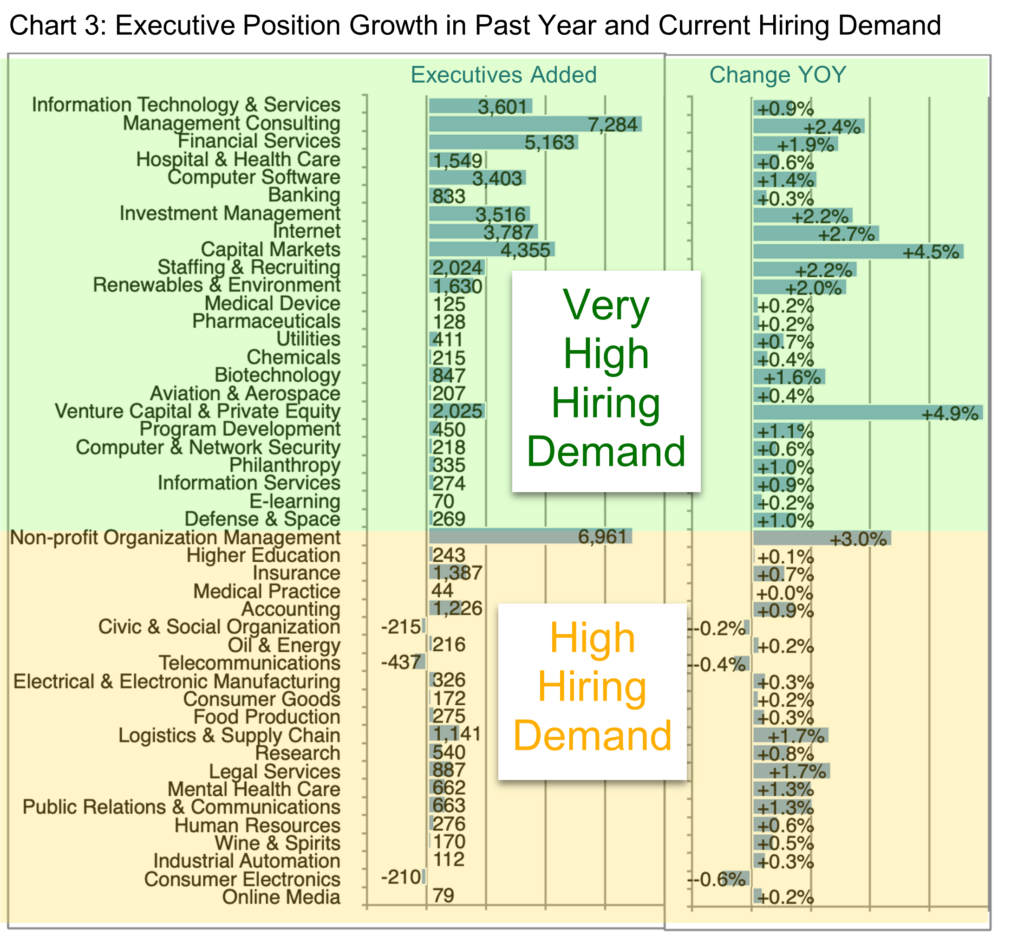
Chart 3 highlights those industries with high or very high hiring demand per LinkedIn. While the growth data is historical, of course, the hiring demand assessment is more up to date and should be somewhat predictive. Bear in mind that an industry can also have low growth and yet high hiring demand if it is difficult to find the right skills such as Telecommunications, for example.
Barrett Group clients exemplify the relative demand for executive talent at the moment, too, landing as they have in these industries over the last six months (Chart 4).
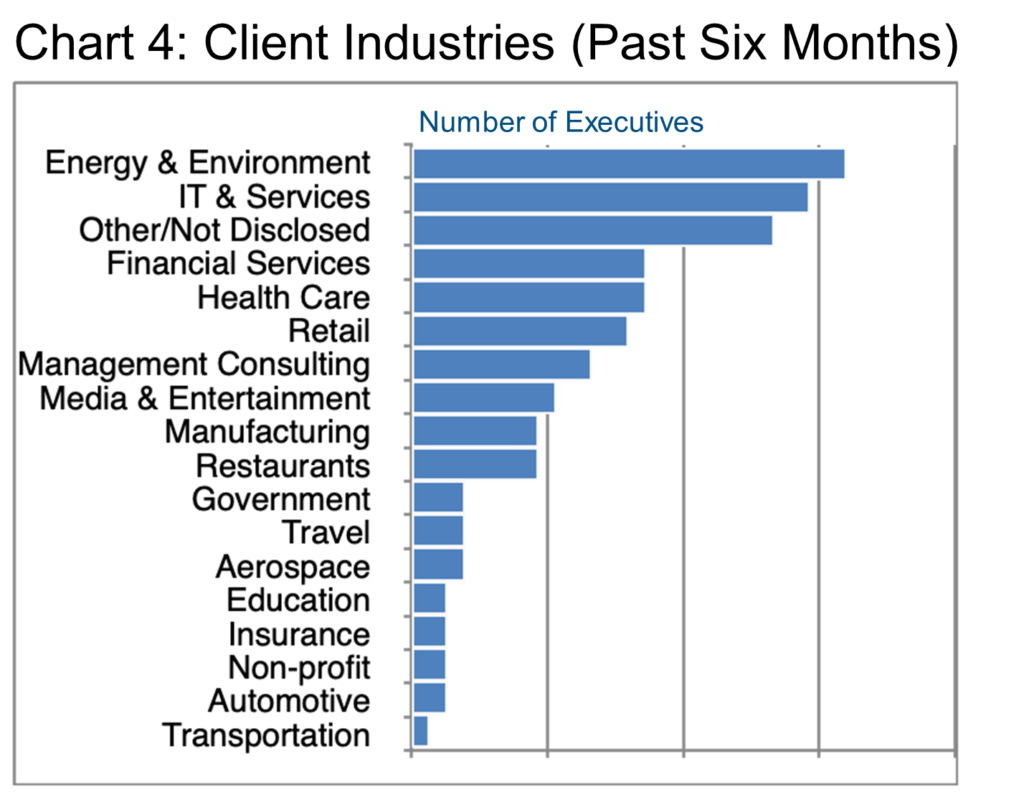
In fact, many of our clients have chosen to change industries for the reasons laid out above, and one of the keys to managing this successfully is to be able to demonstrate the transferability of skills and experience from one industry or role to another.
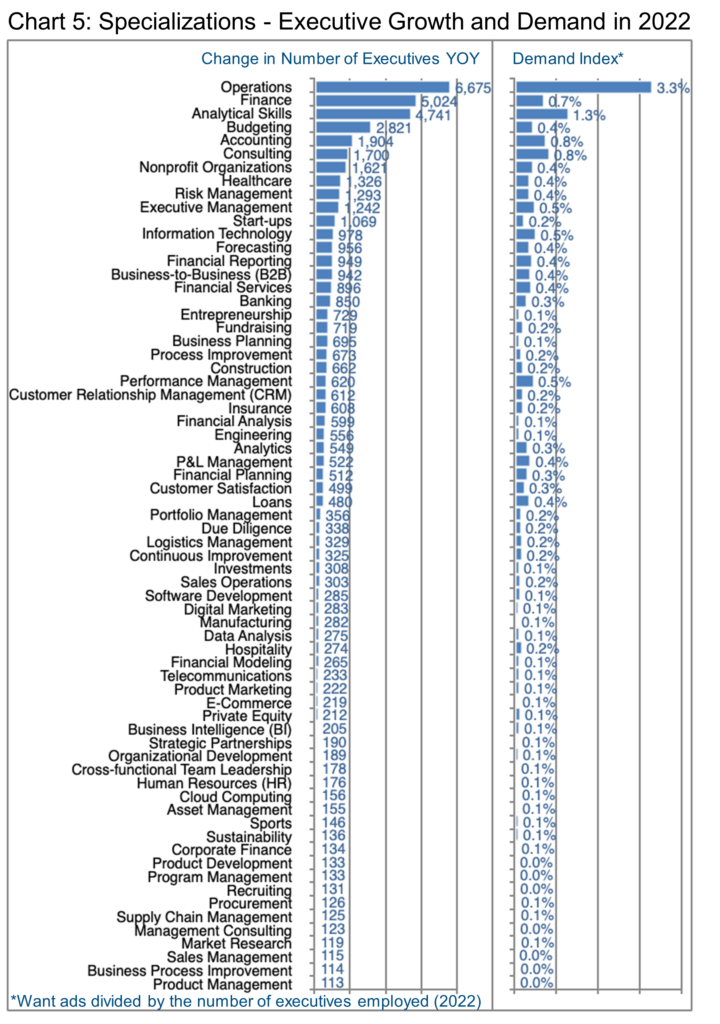
LinkedIn does not forecast demand for specializations but we can share the relative growth in 2022 and the degree to which companies published want ads for various specializations as a crude index of demand (Chart 5). We say this is “crude” because want ads typically account for no more than 15% of our client landings at the executive level, while accessing the unpublished market generates fully 75% of our clients’ success. (Explore the Unpublished Market for Executives.)
Based on this assessment, clearly Operations as a specialization added the most executive positions and also exhibited strong implied demand. Other specializations with relatively strong demand indicators of 0.5% or more included Finance, Analytical Skills, Accounting, Consulting, Executive Management, Information Technology, and Performance Management.
Notice as you review this data how many of these specializations are relatively generic and could easily be transferred from one industry or role to another.
If you need a little inspiration and a great example of one person who has pursued the right role diligently and succeeded, listen to this interview with Barrett Group client Alisa Preston.
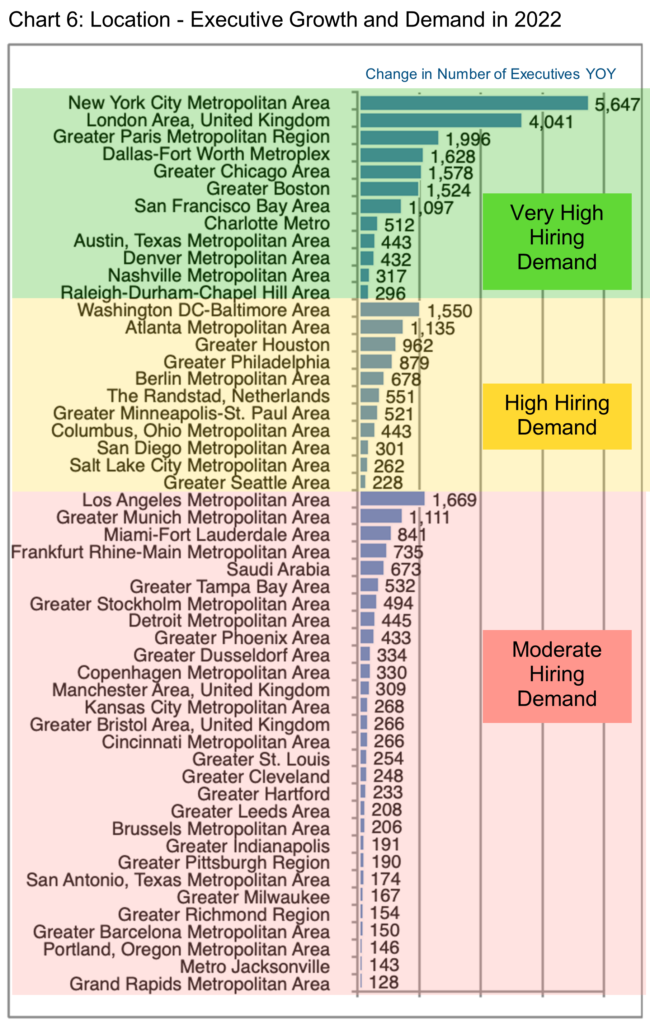
We would be remiss not to mention geography in this context. Demand also varies considerably by location, of course, and Chart 6 provides insight into which cities show the greatest overall vitality with respect to executive positions.
New York is home to more than 569,000 executives by our definition—more than twice second-ranked London (255,000) or almost three times third-ranked Paris (186,000), so it is no wonder that the growth was also the strongest in absolute terms in New York in the past year. Of course banking is a major industry in New York and we may very well see some adjustment as the fallout from the Silicon Valley Bank and other related issues becomes clearer.
Still, in all, 12 major cities fall into the “very high” hiring demand category as listed in Chart 6, while another 11 still rate a “high” hiring demand designation, including Berlin, The Randstad (Netherlands), as well as 9 cities in the US. A further 29 cities are described by LinkedIn as having a “moderate” hiring demand, spanning the US, Europe, and the Middle East.
Of course, employers actually drive demand more than the location per se. In New York and in London, Citi, JP Morgan, and Goldman Sachs constitute the three largest employers of executives, emphasizing the importance of banking and financial services to these two urban centers.
In Paris, Societe Generale, BNP Paribas, and Total Energies lead the way. Dallas’ largest employers of executives include JP Morgan, Bank of America, and Citi. Chicago hosts Northern Trust Corporation, JP Morgan and Bank of America as the largest on this parameter. State Street, Fidelity, and Bank of America lead the list in Boston while Wells Fargo, Kaiser Permanente, and Accenture hold sway in San Francisco.
Jumping down the list to the high hiring demand area we find Deloitte, M&T Bank, and JLL at home in Washington DC, while in Atlanta Truist, Bank of America and SunTrust employ the most execs.
In the moderate hiring demand category, Los Angeles offers City National Bank, Bank of America and Wells Fargo at the top of the ranking, and in Munich Siemens and BMW hold the honor.
So who are the winners and losers in the big picture?
Certain industries are clearly poised to grow (Chart 3) and will benefit from trends laid down during the Covid-19 pandemic but also from the surge driven by the post-pandemic recovery. Others will benefit from the broad investment in energy and the environment we see rolling out worldwide, but especially in Canada, US, EU, and Middle East. Still others thrive because of the fluid economic environment and the need to rethink processes and value propositions, especially Management Consulting. In terms of specializations, Operations, Finance, Analytical Skills, Accounting, Consulting, Executive Management, Information Technology, and Performance Management all seem to be in relatively high demand. Geographically, some cities are experiencing higher hiring demand (Chart 6) than others, most likely due to their underlying major employers.
At the end of the day, though, in our opinion, the winners are the executives who periodically take the time to review their careers and consider their options instead of blindly following the path of least resistance.
Emotional factors, quality of life, future perspectives, remote versus in-office activity, compensation, culture… these are some of the factors we encourage executives to take into account as they assess their current satisfaction and consider whether they will stay or move. These executives will demonstrably earn more money over their working life times on average than those who merely stay put.
Of course, hiring the Barrett Group resolves the question of how to review your professional opportunities, because our first step (the Clarity Program©) provides the perfect framework for this consideration and produces some fairly profound rethinking. The Barrett Group also greatly simplifies the career management research labor required, and almost invariably improves the offers once they start to flow.
The best thing about this conscious process of managing a career is that each executive can ultimately decide whether to be a winner or not. It is entirely up to you.
Peter Irish, CEO
The Barrett Group