
INDUSTRY UPDATE: Leisure, Travel, Hospitality & Restaurants
Introduction:
We bundle Leisure, Tourism, Travel, Hospitality, and Food into one macro-category. There is significant overlap and transfer of executives between these related activities. Clearly, these industries suffered during the Covid-19 lockdowns. These industries have taken some time to recover, but that recovery is now well underway. For example, international visitors to the US were up 128% in 2022 vs. 2021. These travel and tourism “exports” had a volume of $164.5 billion and a total value of $1.7 billion in that same year, providing some 7.4 million jobs in the US. [See source.]
Overall, international tourism seems to have reached about 80% of the pre-pandemic volume in the first quarter of 2023. There have been some 235 million passengers traveling internationally—double the value for the first quarter of 2022. The Middle East actually exceeded 2019’s (pre-pandemic) first quarter results, Europe achieved 90%, and the Americas, 85%. [See source.]
Domestic air travel in the US also picked up in the first quarter of 2023, reaching circa 608,000 flights in March, up 29,000 versus March 2022. [See source.] Overall, sentiment in the air travel industry has turned relatively upbeat. During April 2023, for example, European carriers saw traffic increase 22.6% versus the prior year. Middle Eastern carriers saw a 38% increase. North American carriers rose 34.8%. [See source.]
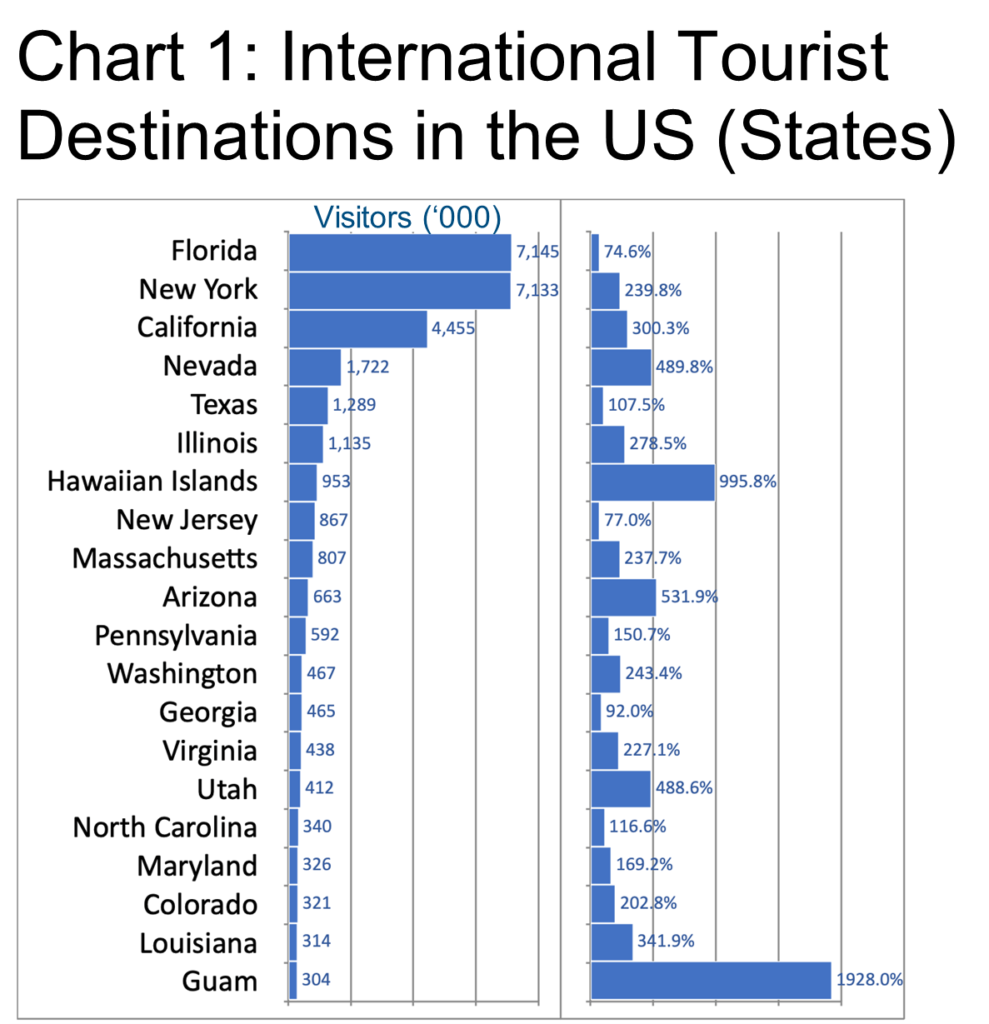
Florida and California also demonstrated increased appeal and, along with New York, topped the ranking of destinations in the US (see Chart 1 and See source.). This is for many reasons including attractions such as the Disney theme parks which themselves buoyed otherwise downbeat results for the company as a whole: “Disney recorded $2.65 billion in one-time charges and impairments, dragging the company to a rare quarterly net loss. One bright spot for the company was its parks, experiences, and products division, which saw a 13% increase in revenue to $8.3 billion during the quarter.” [See source.]
Switching over to the hotel sector, we understand that there is also significant improvement:
“In early April 2020, more than three-quarters of U.S. hotel rooms stood empty […] Nearly three years later, U.S. hotel occupancy has almost recovered and is expected to continue its upward trajectory in the year ahead. Average U.S. hotel occupancy is projected to reach 63.8% in 2023 – just shy of 2019’s level (65.9%) and a significant improvement over 2020’s historic annual low (43.9%).” [See source.]
Europe also shows positive signs, with occupancy rates and revenue per room night increasing steadily throughout 2022 and year to date 2023. [See source.] Gateway cities play an outsized role in this travel as destinations and luxury hotels seem to be outperforming economy establishments so far in 2023. The industry publication Hotel News Resource, put it this way: “Travel is back!” [See source.]
Even the rating agencies are turning more bullish. Fitch Ratings, for example, recently upgraded its view of the whole sector: “The performance of European lodging operators will continue to improve in 2023, supported by a rebound in travel due to pent-up demand while restructuring and cost-cutting measures implemented during the pandemic and increased rates largely offset cost inflation […]” [See source.] Certainly, the regrettable wildfires in Italy and Greece may have an as-yet-unknown impact on this data. We will have to keep an eye on this sector with this in mind.
The Middle East is clearly planning to grow in hotels, too.
“Lodging Econometrics’ forecast for new hotel openings in 2023 is 123 new hotels with 30,113 rooms while 116 new hotels and 29,085 rooms are forecast to open in 2024.” [See source.] Saudi Arabia, the UAE, and Egypt ranked in the top three in this evaluation of new hotel capacity.
Restaurants are also recovering but face other challenges. While business has returned almost to normal in the US according to the National Restaurant Association and is forecasting almost $1 trillion in sales this year, the sector struggles to find enough qualified workers now that it has again surpassed pre-pandemic levels of employment (15.5 million), and that means costs are rising, not only for labor but also for ingredients as inflation bites. [See source.]
One source reports that “the EU food and drink industry employs 4.6 million people, generates a turnover of €1.1 trillion and €230 billion in value-added, making it one of the largest manufacturing industries in the EU.” [See source.] Along with the challenge of finding enough qualified employees, the “war against Ukraine is also predicted to drive a dietary shift due to affordability, with the majority of European consumers saying the conflict has had negative impacts on the price of food,…” particularly meat. This source suggests that this may accelerate the adoption of plant-based alternatives to meat due to economic pressures. [See source.]
While fine dining and other sectors flourish or dwindle depending on local conditions and the skill of their operators, one specific subsector in the industry seems bound for growth regardless, both in the US and Europe: “The global fast-food market is projected to grow from USD 972.74 billion in 2021 to USD 1,467.04 billion by 2028 at a CAGR of 6.05% during the forecast period.” [See source.]
In the Middle East, penetration of out-of-home dining is still relatively low, and therefore the “market in 2022 was valued at US$44.80 billion.” However, the “market value is expected to grow at a CAGR of 10.66% during the forecast period of 2023-2028, with full-service restaurants (FSR) and casual dining segment being the dominant segment owing to rising consumer disposable income.” [See source.]
All in all, the forecast of this industry is one of continued recovery and growth. Let us now turn our attention to the many talented executives who will make this happen.
The Market for Executives
Some 283,000 executives as we define them (see Editor’s Note) are active in these sectors. This number is up a barely detectable +0.2% over the prior year. 8,000 or so changed jobs, too, so the total “churn” is almost 3%. The US and Canada numbered 140,000 in this cohort, the EU and UK, 123,000, and the Middle East, 20,000. This latter market displaying slightly higher growth of 0.5% YOY. Overall, the median tenure in these positions is about 3.3 years, and the cohort is 29% female.
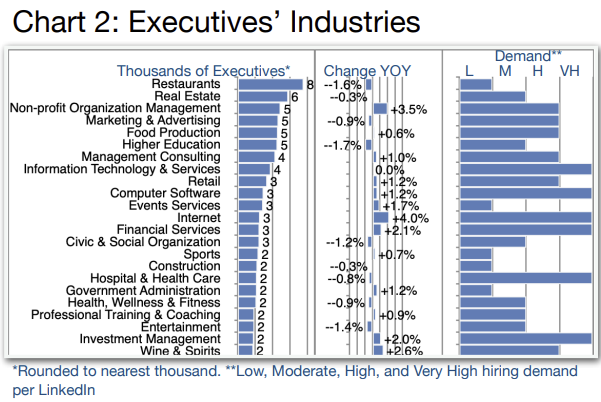
Of the top six employing industries in this sector (Chart 2), four show shrinkage in the executive ranks. Only one of those shows a high hiring demand. So overall, it is fair to say that this is not a buoyant cohort. In the US, Restaurant performance had a strong pick-up post-COVID-19 but since then has declined according to the National Restaurant Association’s Performance Index [See source.] As noted in the Introduction, fast food as a category and certain chains are defying this trend.
Real Estate is always sensitive to interest rate increases. Commercial real estate has been particularly vulnerable in recent years in part because of the prevalence of remote work. At least in the US, “As a result, most commercial real estate sectors continue to experience slower rent growth and higher vacancy rates compared to the previous year.” [See source.]
There are, of course, still some areas that are growing above average, or showing a higher hiring demand, or both. These are notably Non-profit Organization Management (+3.5% and high hiring demand), Internet (+4% and very high hiring demand), and Investment Management (+2.6% and very high hiring demand).
Other industries exhibit negative growth but strong hiring demand such as Hospitals & Health Care. This is presumably because employers simply struggle to find qualified and interested executive personnel. Overall, this macro-category of industries represents a prime opportunity for executives to transfer into some of the high hiring demand verticals or out of some of the apparently declining areas.
A key challenge for many executives remains to imagine in the first place where else they might be happier, earn more, and/or have more career opportunities because transferability is not widely understood—except at the Barrett Group where our process routinely assesses options for executives to consider alternative career tracks. [Read more.]
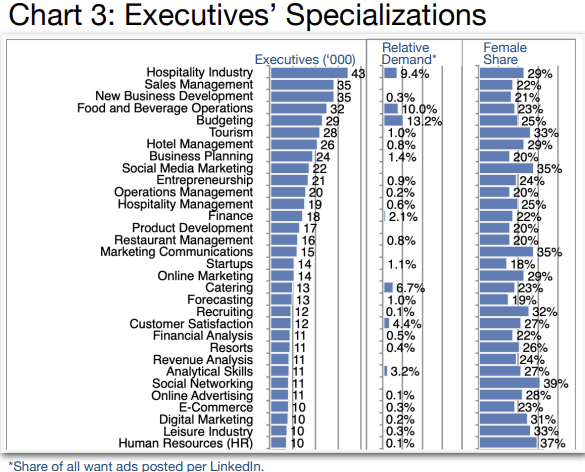
Executives on LinkedIn usually indicate one or more primary areas of specialization. These are summarized for this cohort in Chart 3. As usual, some are highly specific to this overall industry grouping, such as Hospitality or Food and Beverage Operations but many more are somewhat generic (e.g., Sales Management or New Business Development and could most likely be transferred to other industries with relative ease.
The “Relative Demand” column shows the share of all want ads placed for each specialization per LinkedIn and serves as a relative measure of the extent to which employers sought specialists, however, we should point out that most executive positions in our experience are in fact never advertised. That is why most Barrett Group clients land through the unpublished market where there is generally less competition and higher compensation.
Also in Chart 3, readers will find a high-level summary of which specializations are more or less populated by female executives. Social Networking (39% female), Human Resources (37%), Marketing Communications (35%), and Social Media Marketing (35%) rank the highest on this parameter. The Barrett Group sees a continuous improvement in the female executive share across most industries, so please do not see this necessarily as a limitation, but rather as an opportunity to move the needle.
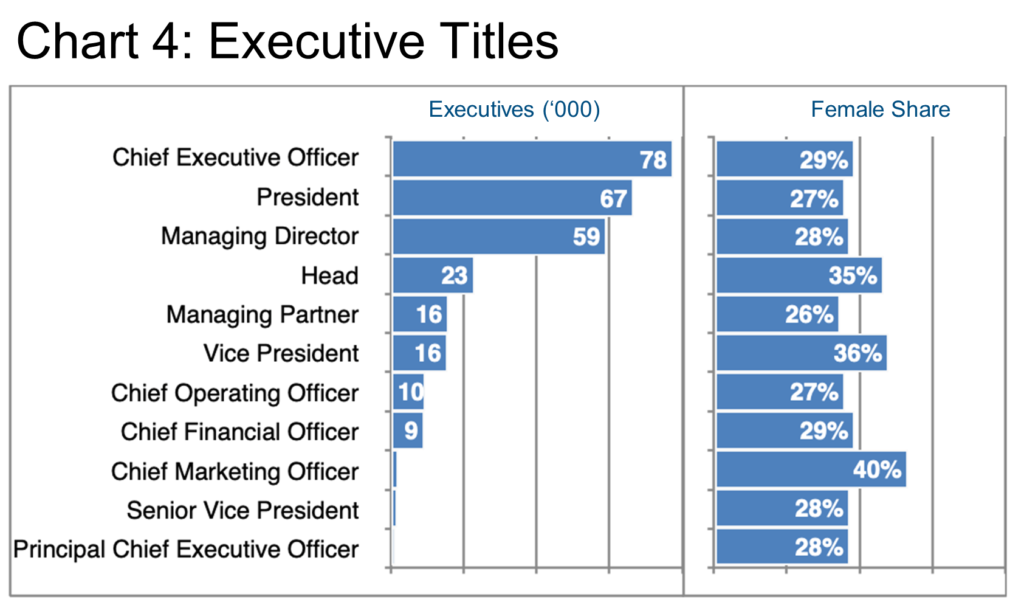
Per Chart 4, there is plenty of room to move that needle, too, as we see only the Chief Marketing Officer title coming in at 40% female, followed by Vice President (36%) and Head (35%). Also, the ratio of top management (CEO, President, Managing Director) to middle management and the relative paucity of CFOs suggest that this is a relatively unconcentrated group of industries with only modest opportunities in the middle ranks. In fact, the top 50 (Chart 5) employers in this cohort represent just 1.6% of the total number of executives—further evidence of the industry’s unconsolidated nature.
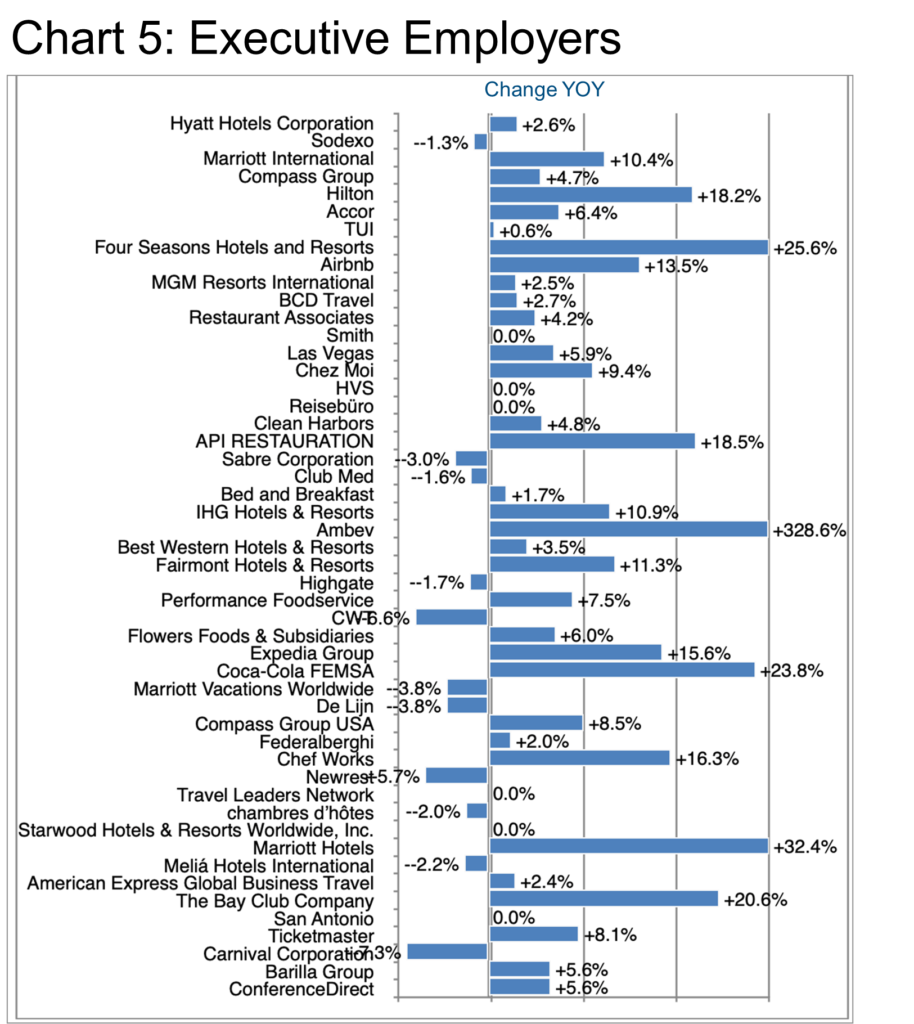
Ambev (+328.6%) grew the fastest on this list, so let’s start with them. Apparently, most of their executive growth was in Spain, Romania, and the UAE. In the US, the controversial advertising campaign featuring a transgender TikTok influencer cost Bud Light its market leadership position, but the company’s stock is being upgraded to “buy” as of the date that this Industry Update goes to press.
Marriott (+32.4%) in the hotel sector also added significantly according to LinkedIn, adding executives in Washington, DC, Egypt, and Los Angeles among other locations. Their target skill sets appear to have been quite broad, encompassing Hospitality, Leisure, Travel & Tourism, Advertising & Marketing, Management Consulting, and even Aerospace.
Four Seasons Hotels and Resorts (+25.6%) also added execs, growing mainly in Los Angeles and to a lesser extent in London. Their Finance and Business Development disciplines received the most reinforcement, mainly at the Vice President level as well as newly minted divisional CEOs and Heads.
Coca-Cola Femsa (+23.8%), the largest bottler in the brand’s system, naturally grew mainly in its home region (Latin America) but also added executive depth in Paris, Atlanta, Toronto, and Madrid. Finance and Sales Management attracted the most attention, while analytical skills including Budgeting and Forecasting ranked highly as well.
Diversified leisure activity purveyor The Bay Club Company (+20.6%) added executives, too, mainly in San Francisco and Los Angeles, acquiring them from competitors such as 24 Hour Fitness, but also from adjacent companies such as Athleta. Hiring focused on specializations in Sports and Personal Training.
The French cooking specialist API-Restauration (+18.5%) selected candidates from the Culinary Arts, Food Safety, Food Preparation, and Client Relations specializations, adding them in Paris, Lille, and Lyon. The Managing Director and Head titles grew the most.
Naturally, Barrett Group clients have access to far more detailed information, whether at the initial screening stage, advanced selection step, or when preparing for a specific interview. Providing our clients with the best available research remains a key part of our five-step career change process.
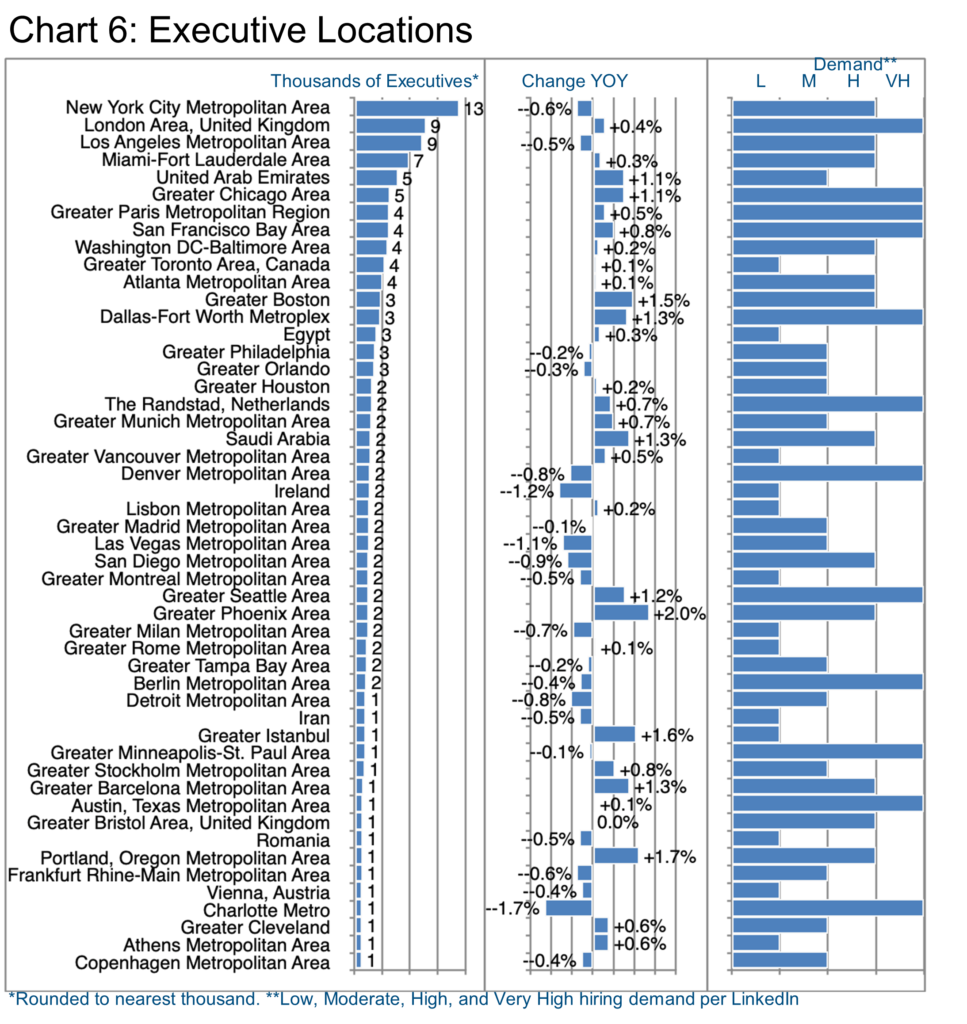
Chart 6 examines where executives are based, although, of course, these days they may well be working remotely as well. Year-on-year growth is important, but the Hiring Demand may be an even more reliable indicator of near-term executive opportunity, generated as it is by LinkedIn’s algorithms.
New York usually comes out on top in these updates and this industry is no different. Tzell Travel Group (specialist in corporate travel), Tacombi (Mexican food purveyor), and New York Tourism and Conventions (nonprofit regional authority) represent the largest employers of executives in this location.
London comes next in the ranking. Sodexo (food service operator), innocent drinks (beverage manufacturer and marketer), and the Ritz (hotel operator) rank in the top tier of executive employers in London in this industry. In Los Angeles, hotels rule: Hyatt, Four Seasons, and Carlson are the top three. Carnival Corporation and Norwegian Cruise Line Holdings (cruise lines) as well as The Palm Beaches (tourist marketing nonprofit) change it up a little as the top players in Miami.
Jumeirah Hotels & Resorts, Accor, and Marriott International lead the pack in the UAE, all of them in the hotel segment. In Chicago, Hyatt Hotels Corporation (hotels and resorts), Tropicana Brands (branded juice manufacturer and marketer), and Treehouse Foods (private label food manufacturer) top the list of employers of executives.
In Paris, Accor (hotels), Sodexo (food service), and Club Med (hotels and resorts) prevail as the top three. San Francisco boasts The Bay Club Company (sports), Airbnb (short-term vacation rentals), and Cake 4Kids (nonprofit) among their top employers of execs in this segment.
Peter Irish, CEO
The Barrett Group
Click here for a printable version of Industry Update – Leisure, Travel, Hospitality & Restaurants 2023
Editor’s Note:
In this particular Update “executives” will generally refer to the Vice President, Senior Vice President, Chief Operating Officer, Chief Financial Officer, Managing Director, Chief Executive Officer, Chief Marketing Officer, Chief Information Officer, Managing Partner, General Counsel, Head, and President titles principally located in the US, Canada, Europe, the UK, and/or the Middle East. Unless otherwise noted, the data in this Update will largely come from LinkedIn and represent a snapshot of the market as it was at the time of the research.
Is LinkedIn truly representative? Here’s a little data: LinkedIn has more than 900 million users. (See source.) It is by far the largest and most robust business database in the world, now in its 20th year. LinkedIn Talent Insights data is derived by aggregating profile data voluntarily submitted by LinkedIn members. As such, LinkedIn cannot guarantee the accuracy of LinkedIn Talent Insights data.
Tourism and the Environment
In a stunningly detailed document, the US Federal Aviation Administration (FAA) lays out a forecast for “enplanements” (essentially airline passengers) that foresees growth from 738 million in 2022 (up from 460 million in 2021 post-Covid) to 1.364 billion in 2043—an 85% increase. [See source.] Beyond that, the FAA forecasts enormous complexity and growth in manned and unmanned flights for logistic purposes (delivery), passengers (“air-taxi”), drones, and even recreational, private flying vehicles (flying cars?). In any case, it appears that the skies will be very busy over the coming decades.
All of this means more CO2. “In 2022 aviation accounted for 2% of global energy-related CO2 emissions, having grown faster in recent decades than rail, road or shipping. […] aviation emissions in 2022 reached almost 800 Mt CO2, about 80% of the pre-pandemic level.” “CO2 emissions are expected to grow rapidly and to surpass their 2019 level around 2025.” “Multiple measures are required to promote the technologies, sustainable aviation fuels (SAF), and demand-side management needed to bring the currently rising emissions level below 1 000 Mt CO2 by 2030, in line with the NZE Scenario.” [See source.]
In other words, improvements in operating efficiency, new fuels including “e-fuels” and hydrogen, and electric airplanes will all need to come together to reduce aviation emissions. And CO2 is not the only issue: “Contrails — those narrow, white clouds that trace an airplane’s path through the sky — trap heat in the atmosphere, much like in a greenhouse, greatly amplifying the impact of flying on the world’s climate. Recent studies have shown that contrails are around 1.7 times more damaging than CO2 emissions when it comes to global warming.” [See source.]
Alternatively, you could choose a different method of travel: in the US, “… a plane gets 43 miles per gallon [mpg] per person; this is less efficient than trains or cars, which get 51 mpg and 53 mpg per person, respectively. Interurban buses are, by far, the most efficient at 152 mpg per individual.” Of course, in Europe, trains are an even more efficient method of travel as far as emissions are concerned. [See source.]
Some advocate reducing air travel, or indeed all travel, because allegedly “One return flight from Montreal to London emits as much carbon emissions as heating a European home for an entire year.” “If the aviation sector were a nation, it would be among the top 10 global emitters.” [See source.]
Clearly, humanity must put more thought into balancing this equation.


