
INDUSTRY UPDATE: Health Industry – August 2021
INDUSTRY UPDATE- Health Industry
Future Trends
Editor’s Note: Given the plethora of sectors and data sources, a single prediction exceeds our immediate capabilities. However, there are multiple sources that all predict significant growth and innovation in the health industry and pharmaceutical segment. Here is a sample of those sources.
Global health care spending came in at about $8.45 trillion in 2018. It is expected to top $10 trillion by 2022. The US has the largest total healthcare spend (more than $10,000 per capita). The US spends much more than other countries do on healthcare. Telehealth applications can significantly reduce costs and improve service in this industry. (See Source)
According to the OECD, the US spends $10,948 per capita on healthcare. This is compared to $6,731 in Germany, $5,274 in France, $5,268 in the UK. (See Source)
The US Department of Labor predicts, “Employment in healthcare occupations is projected to grow 15 percent from 2019 to 2029, much faster than the average for all occupations, adding about 2.4 million new jobs. Healthcare occupations are projected to add more jobs than any of the other occupational groups. This projected growth is mainly due to an aging population, leading to greater demand for healthcare services.” (See Source)
The European medical devices market is projected to reach $61.4 billion by 2025. This is at a CAGR of 4.7% from 2020 to 2025.
Many factors are driving the growth of this market. These factors include:
- rising geriatric population,
- large and established medical technology industry,
- increasing number of surgical procedures,
- growing need for cost-containment in the healthcare industry,
- and the availability of funding for research and product innovation. (See Source)
Health Expenditures and Services in the U.S.:
“Health care expenditures continue to rise in the U.S. and throughout the world. Total U.S. health care expenditures were estimated to be $3.82 trillion in 2019, and are projected to soar to $5.96 trillion in 2027. The health care market in the U.S. during 2019 included the major categories of hospital care ($1,254.7 billion); dental, physician, and clinical services ($907.5 billion); and prescription drugs ($360.3 billion), along with nursing home and home health care ($286.8 billion). Registered U.S. hospitals totaled 6,210 properties in 2017, according to an American Hospital Association survey, containing 931,203 beds serving 36.5 million admitted patients yearly (the latest data available).” (See Source)
Profits for the US health industry are expected to grow significantly between 2019 and 2024: Healthcare Provider from $180.7 billion to $197.8 and Pharma from $125.9 to $169.9. (See Source)
“Based on conversations with healthcare leaders worldwide, KPMG professionals sense a wind of change coming for the sector. […] healthcare executives expect and welcome reform – with 80 percent of CEOs believing that healthcare needs disruption and change, with 79 percent expecting that all aspects of care delivery models will be transformed within the next three years – which is a high ambition on a short runway for any sector.” (See Source)
THE HEALTH INDUSTRY
Editor’s Note: In this Industry Update “executives” will generally refer to the CEO, CFO, COO, and Vice President titles only. Unless otherwise noted, the data in this Update will largely come from LinkedIn. The data represents a snapshot of the market as it was at the time of the research. Is LinkedIn truly representative? Here’s a little data: LinkedIn has approximately 722 million users. 174 million in the US. 163 million in Europe. (See Source) It is by far the largest and most robust business database in the world, now in its 18th year.
LinkedIn defines the year-over-year change (YOY Change) as the change in the number of professionals divided by the count as of last year and “attrition” as the departures in the last 12 months divided by the average headcount over the last year.
Heath Care represents the third-largest industry segment for Barrett Group clients. About 15% of our clients land in healthcare each year, whether in Europe or in the US. LinkedIn provides valuable insights into these executive markets, but there is one caveat upfront. In the US, for example, if you seek patient revenue per company, this data is relatively accessible because most of the industry is privatized. In Europe, including the UK, this is not the case. The data may well be available somewhere in government extracts, but it is not readily accessible nor is it likely to be comparable.
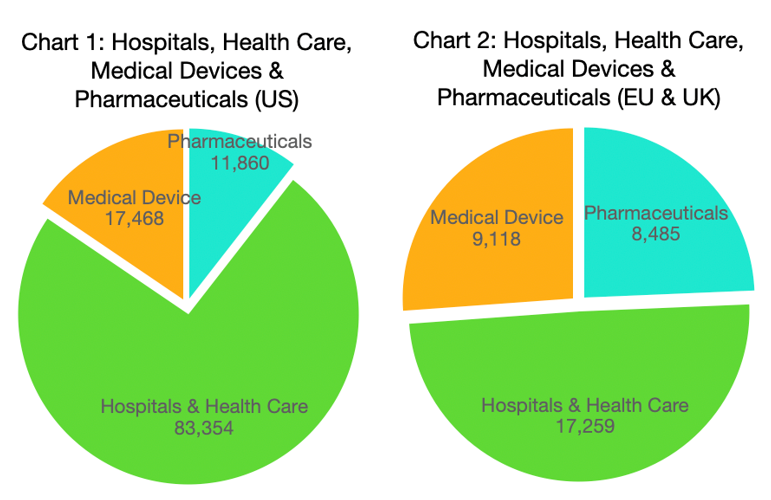
This difference informs the reporting on LinkedIn as well. From Charts 1 and 2 (above) we can already see a crass divergence in the executive composition of the industry (as reported on LinkedIn). Hospitals & Health Care represent 74% of the executives in the US but just 50% in the EU & UK. In the latter market, the other executives are split fairly evenly between the Pharmaceuticals and Medical Devices sub-sectors. Whereas, in the US, Medical Devices represent about 15.5% of the market and Pharmaceuticals just 10.5%.
In the balance of this industry update, we will focus on the Hospitals & Health Care and Medical Devices sub-sectors. (We will refer to them collectively as the “health industry”). The executive structure of the healthcare industry differs markedly from Pharmaceuticals. We will turn our attention to Pharmaceuticals in a future update.
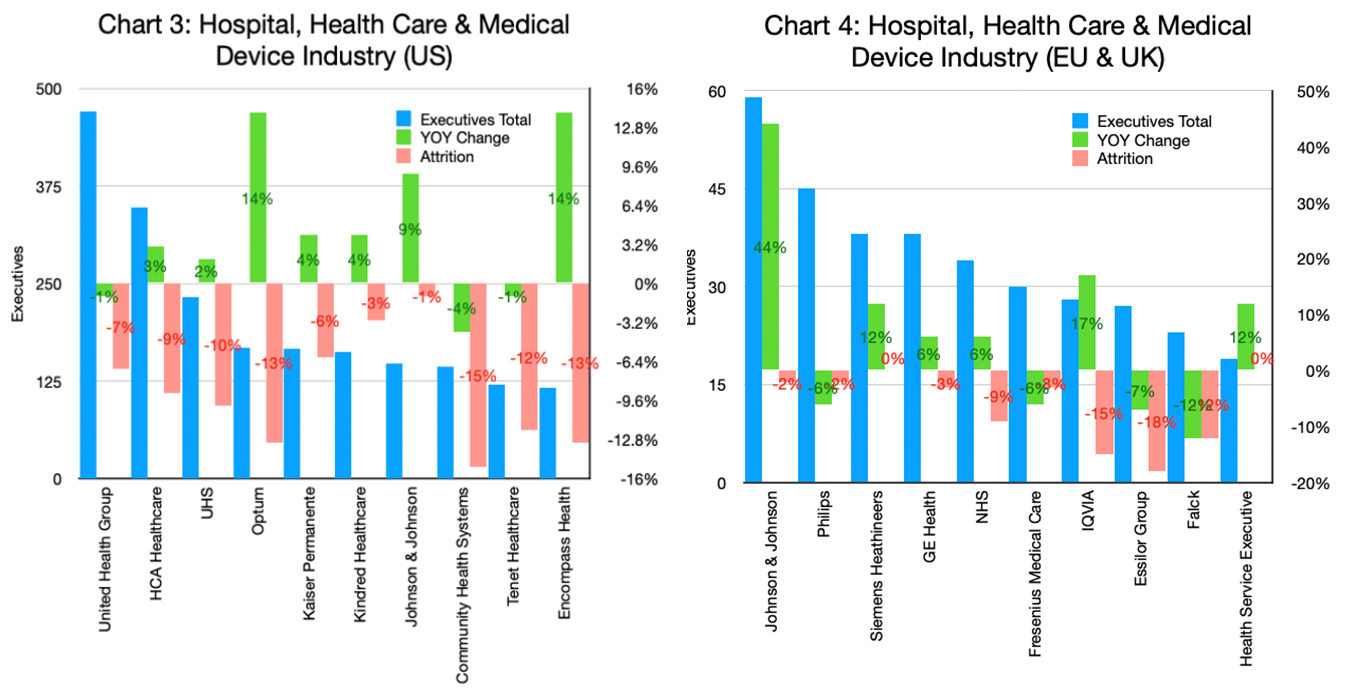
You might think that the massive government interventions that have taken place macroeconomically over the past year or more would also have benefitted the health industry. Perhaps that is true based on Charts 3 and 4 (above). The first of these shows the top ten players in this industry in the US ranked by the number of executives they employ. However, attrition has been quite severe at these companies. The lowest is at Johnson & Johnson (-1%) and highest at Community Health Systems (-15%). On the upside, Optum and Encompass showed the highest growth, 14% in both cases.
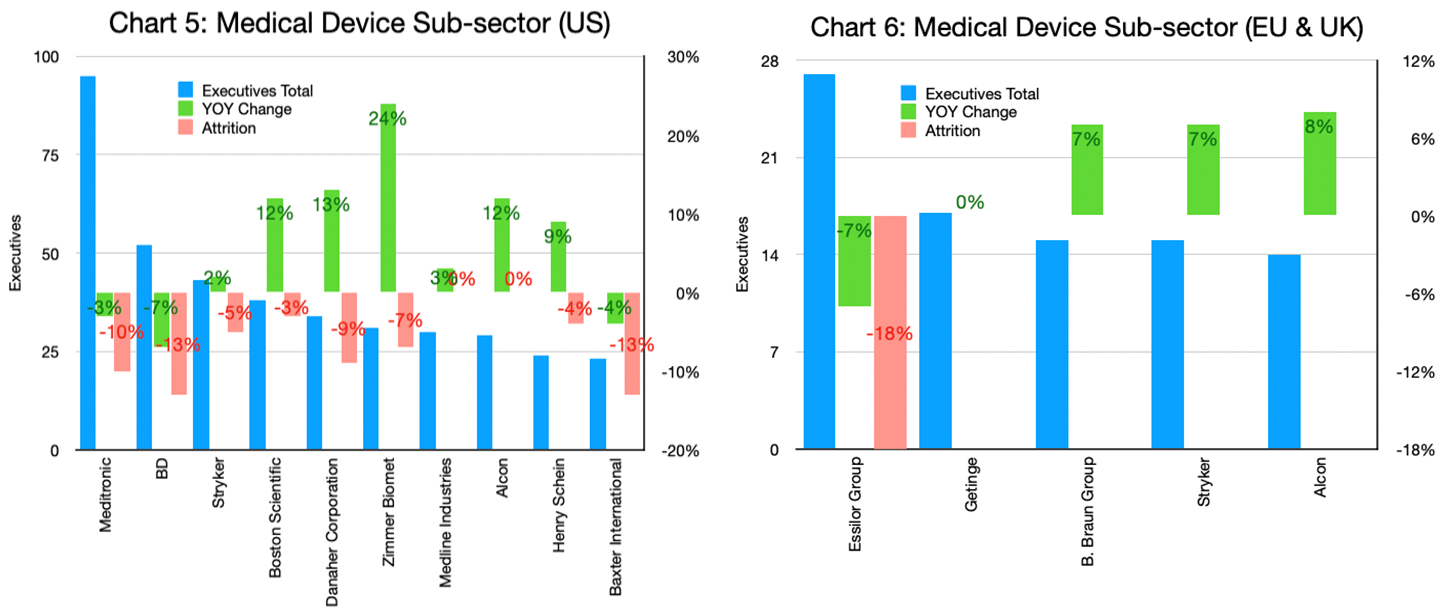
Isolating the Medical Devices sub-sector we also see high growth at Zimmer Biomet, Danaher, Boston Scientific and Alcon in the US (Chart 5, above). B. Braun, Stryker and Alcon grew in the EU & UK cohort (Chart 6, above). No significant attrition was reported for the top five players in the EU & UK except Essilor (-18%). Attrition was quite pronounced in the US. This affected the market leader (Meditronics) to the tune of -10%. Both BD and Baxter International by a factor of -13%.
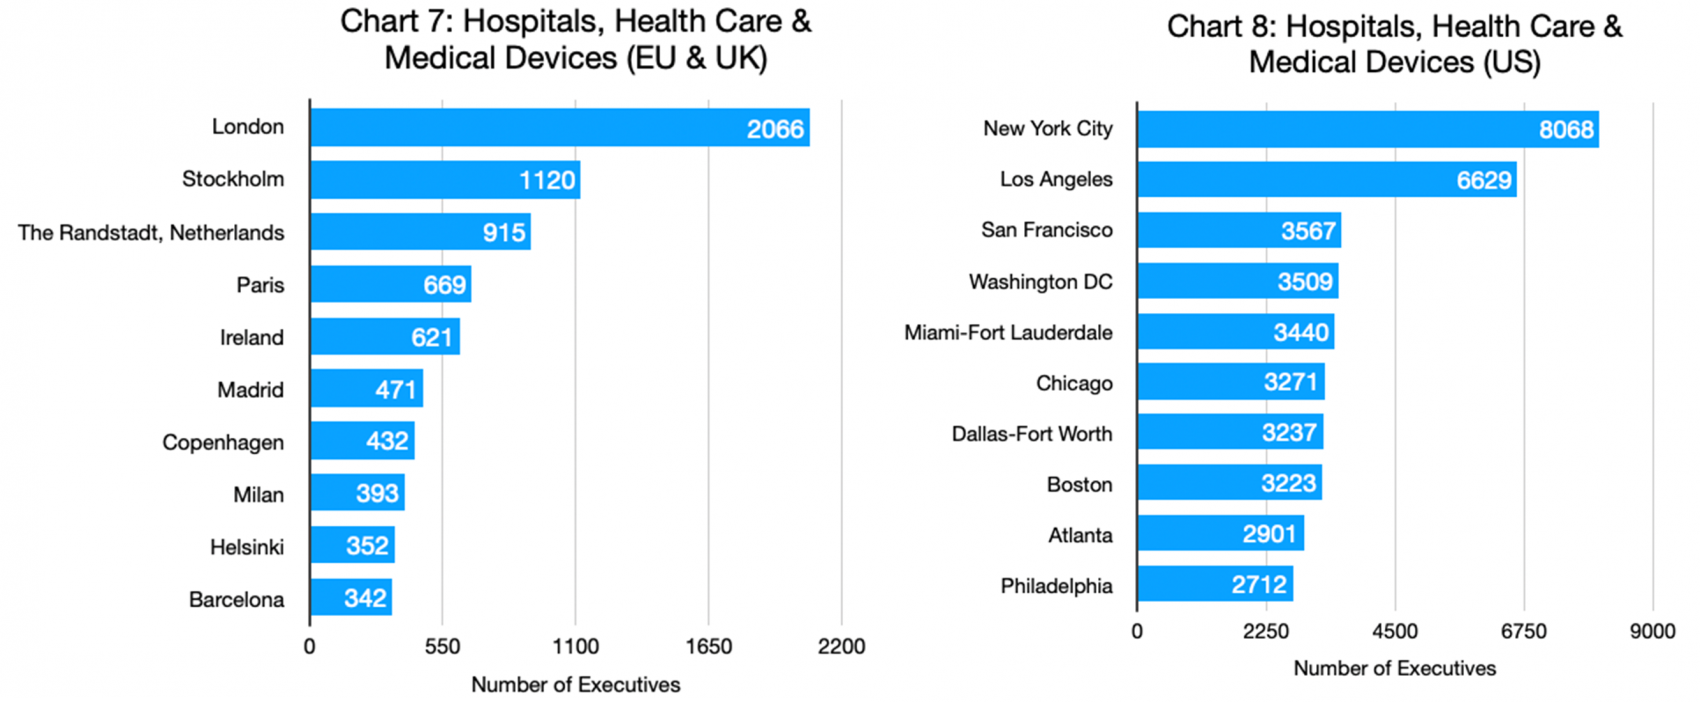
As far as geography is concerned, the overall health industry in the EU & UK lists London, Stockholm, The Randstadt (Netherlands), Paris, and the Republic of Ireland as the top locations for executives (Chart 7, above). Note that the top ten locations comprise just 28% of the total industry executive population. Paris boasts the highest growth (+11%) while the other locations all lie in the +3-5% range. LinkedIn describes the “hiring demand” as “very high” in London and Paris. “High” in Stockholm and Copenhagen. And “moderate” in the other top ten locations in the EU & UK area.
Chart 8 (above) depicts the geographic distribution of the health industry executives in the US. Here there is little divergence in the overall growth dynamic. All of the locations came in in the +2-3% range. LinkedIn also typifies hiring demand in San Francisco, Chicago, Dallas-Fort Worth, and Boston as “very high.” New York City, Atlanta, and Philadelphia as “high.” These top ten locations represent about 40% of the overall executives employed in the health industry.
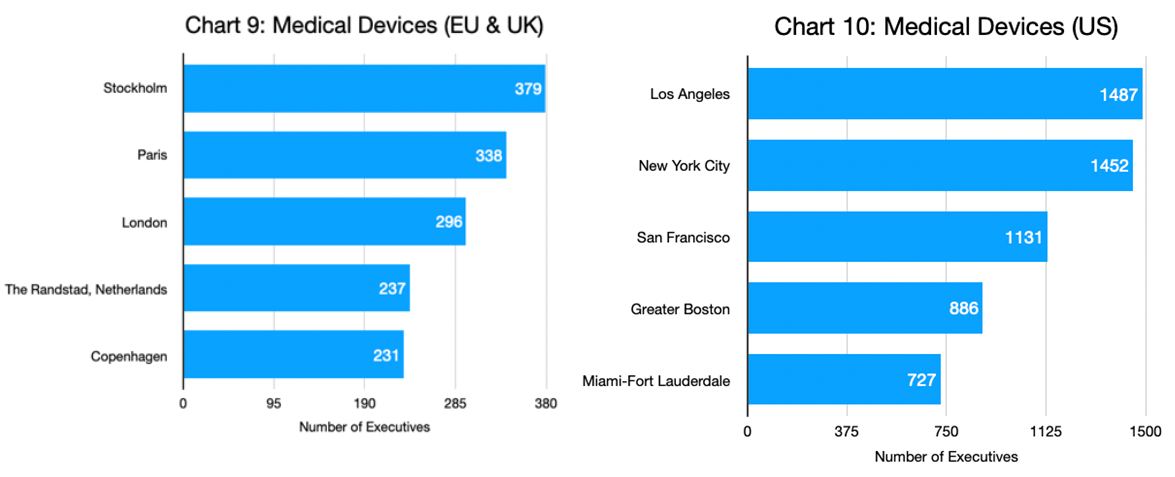
Next we focus only on the Medical Devices sub-sector. The geographic distribution actually changes in both markets. In the EU & UK (Chart 9, above) now Stockholm and Paris lead the way in terms of the total number of executives employed. The growth rates for all of the top five locations are also relatively strong. London is at 10%, followed by Paris at 9% and Copenhagen at 7%. LinkedIn describes the hiring demand as “very high” in Paris, London, and Copenhagen.
The Medical Devices sub-sector in the US also diverges from the overall health industry in terms of executives’ geographic distribution (Chart 10, above). Los Angeles is now topping the chart. Growth in executive employment is moderate overall at +2-4%. Though LinkedIn describes the hiring demand as “very high” in San Francisco and Boston.
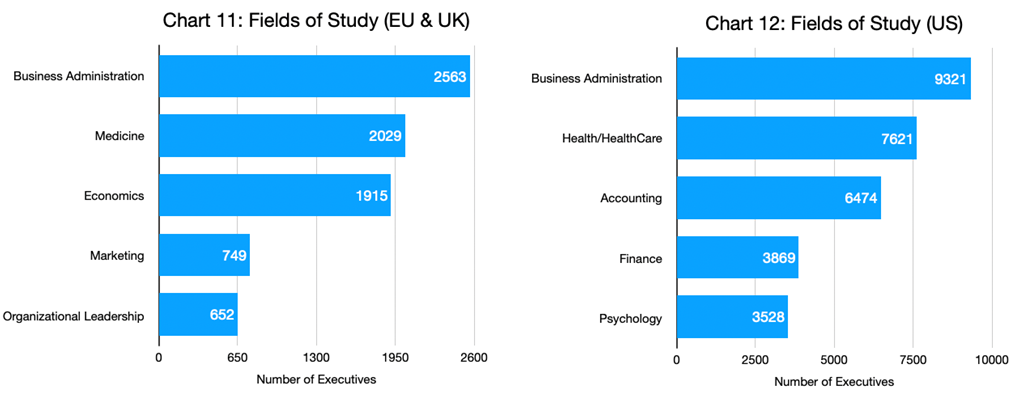
As far as fields of study are concerned, the two macrogeographic regions with their different business composition also differ significantly in terms of the major fields of study (Charts 11 and 12, above). In both cases, Business Administration and Medicine or Health Care occupy positions one and two, followed by either economics or accounting. But positions four and five differ markedly between marketing, organizational leadership, finance, and psychology.
In the EU & UK cohort, it is undoubtedly the Medical Devices sub-sector that propels marketing as a field of study into the top five, because without Medical Devices, the top five tilt decidedly away from Marketing and Business Administration and toward Medicine. In the US, Marketing also predominates in the Medical Devices sub-sector that itself skews the fields of study ranking for the health industry toward Accounting and Finance. Without Medical Devices, the top five exclude Finance but include Registered Nursing.
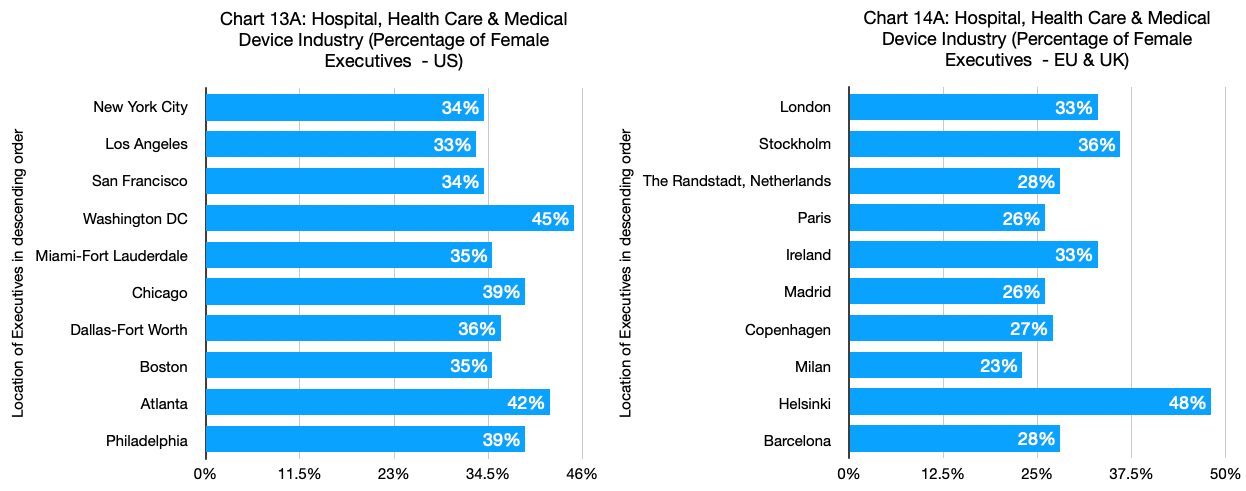
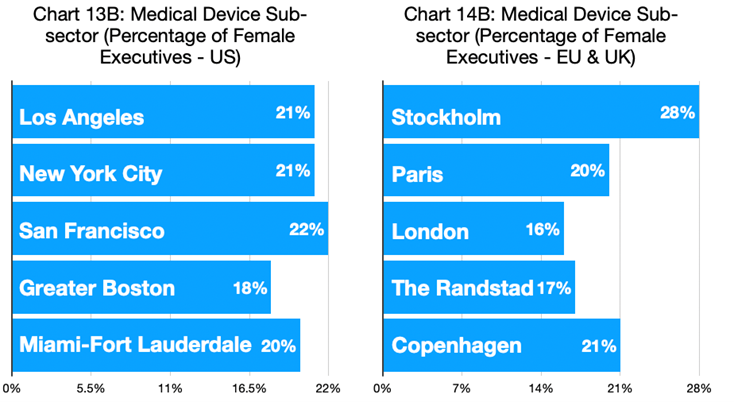
We have also taken a more specific look at the gender composition of these sectors and find some fairly significant deviations. For example, for the health industry, as we have defined it, in the US, there is a range from 34-45% female executives (Chart 13A, above) that is evident when we take geography into account with Washington D.C. and Atlanta standing out as having the highest shares of female executives. In fact, the overall share is higher if we factor out the Medical Devices sub-sector, which, according to Chart 13B (below) has a strong male bias still among its executive population. (Note, the locations in Charts 13A (above) and 13B (below) are listed in descending size of the total executive population in the sub-sector).
There is an even wider range in the EU & UK cohort (Chart 14A, above) from a 23% share of female executives in Milan to 48% in Helsinki for the overall health industry, again exacerbated by the Medical Device sub-sector’s predominantly male composition (Chart 14B, below).
Peter Irish, CEO The Barrett Group
Click here to download a printable version: Industry Update – Hospitals, Health Care, and Medical Devices


