
INDUSTRY UPDATE: Financial Services – August 2021
INDUSTRY UPDATE: Financial Services
Editor’s Note: In this Industry Update “executives” will generally refer to the CEO, CFO, COO, and Vice President titles only. Unless otherwise noted, the data in this Update will largely come from LinkedIn. The data represents a snapshot of the market as it was at the time of the research. Is LinkedIn truly representative? Here’s a little data: LinkedIn has approximately 722 million users. 174 million in the US. 163 million in Europe. (See Source) It is by far the largest and most robust business database in the world, now in its 18th year.
Forecasts for the Financial Services industry vary considerably, of course. However, in general, the expectation seems to be one of recuperation and recovery. This is in part because consumers at least in the US and EU & UK have stockpiled cash during the pandemic at an incredible rate. This is no doubt in part because they could not engage freely in recreation.
Here is one recent assessment:
“Global financial services market is expected to grow from $20,490.46 billion in 2020 to $22,515.17 billion in 2021 at a compound annual growth rate (CAGR) of 9.9%.
The growth is mainly due to the companies rearranging their operations and recovering from the COVID-19 impact. This had earlier led to restrictive containment measures involving social distancing, remote working, and the closure of commercial activities that resulted in operational challenges.
The market is expected to reach $28,529.29 billion in 2025 at a CAGR of 6%.” (See Source)
According to LinkedIn, the Financial Services industry added 10,290 executive employees in the past year, growing by about 2.7%. Growth was significantly faster in the EU & UK (+4%) versus the US (+2%). In the US about 4% of employed executives changed jobs. One in eight of these industry positions is in New York or California. While Chicago and Dallas each contribute another 4-5% each. In the EU & UK London hosts the lion’s share of these positions at 19%. Organizations based in Paris, Stockholm, the Republic of Ireland, and Milan (in descending order) employ 2.4-3.9% each.
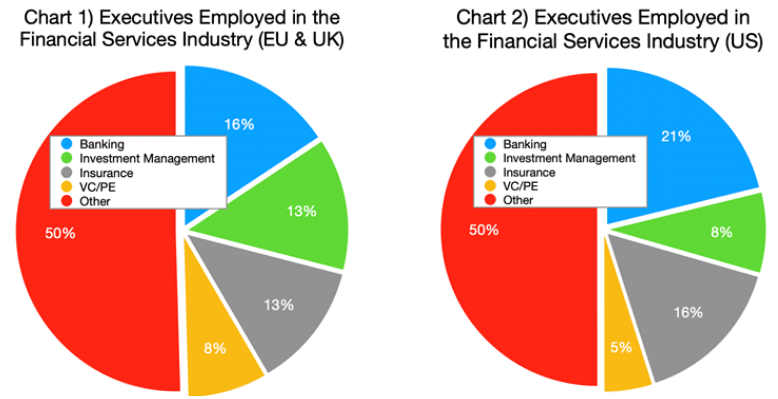
Comparing the US vs. the EU & UK Financial Services industry, the size is quite different. 298,000 executives in the US vs. 91,000 in the EU & UK though the composition is similar. Roughly half of the executive positions in both markets are in four sub-sectors (See Charts 1 & 2 – Banking, Investment Management, Insurance, and Venture Capital/Private Equity).
We will examine the employers in more detail when we look at the sub-sectors within this general business area. But the educational background of the executives is also interesting. In the European Union plus UK cohort Insead has the highest share. They are followed by the University of Cambridge, Harvard Business School, London Business School, and IMD Business School. In the US, the educational background is also fairly predictable. Harvard Business School tops the bill followed by the Wharton School, Northwestern University, Stanford University, and MIT.
At the macro-geographic level, the two major markets are described in Charts 3 and 4.
In the US, the VC/PE had by far the highest churn (attrition of 6% and growth of 8%). The total executive base is only about 5% of the total industry executive market. The same was true in the EU & UK markets. The VC/PE sub-sector losing 5% but adding 10% on its employed executive baseline. Note also that the VC/PE sub-sector employs a higher share of total industry executives (7.8%) in the EU & UK markets than in the US.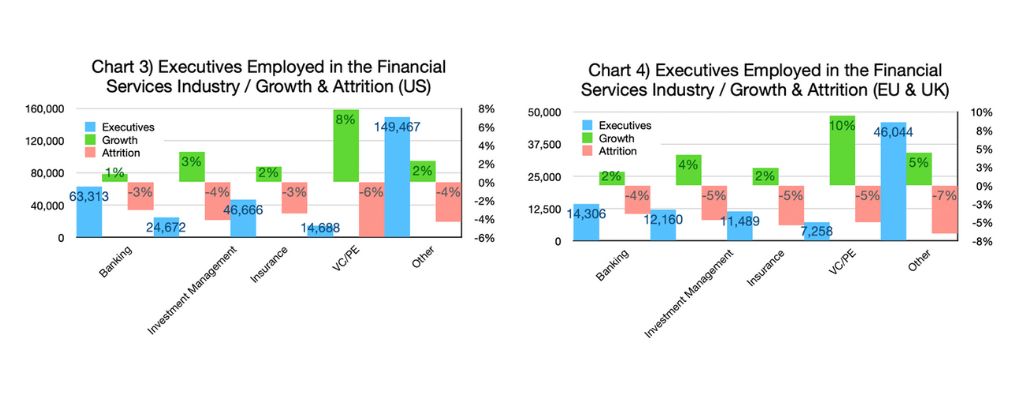
Chart 3 & 4-Executives Employed in the Financial Services- Industry Growth Attrition (US and EU & UK graphs)
BANKING
At more than 63,000 in the US and 14,000 in the EU & UK, Banking is the largest single sub-sector in the Financial Services industry by executives employed. The sub-sector showed modest growth of 1% and 2% respectively. Attrition is at rates of 3% and 4%. These numbers reflect that it is relatively stable within this industry context. The top five in the US (Chart 5) in executive employment may surprise you, particularly Credit Suisse and TD (a Canadian bank). These major employers saw significant attrition in their executive ranks in the past year from 2-4%. They had modest growth rates from -0.6% to 2% in executive employment. Bank of America remains head and shoulders the largest employer though with almost 7,000 executives.
Oddly enough, Bank of America also makes the top five in the EU & UK (Chart 6) though the rest of the list is no surprise. Credit Suisse employs the most executives in the sub-sector at more than 800. While at number two, Bank of America has shown the highest growth of ca. 8%. The rest of the cohort though has been feeling more attrition than growth. This is no doubt as operations adjust to the new Covid-19 reality.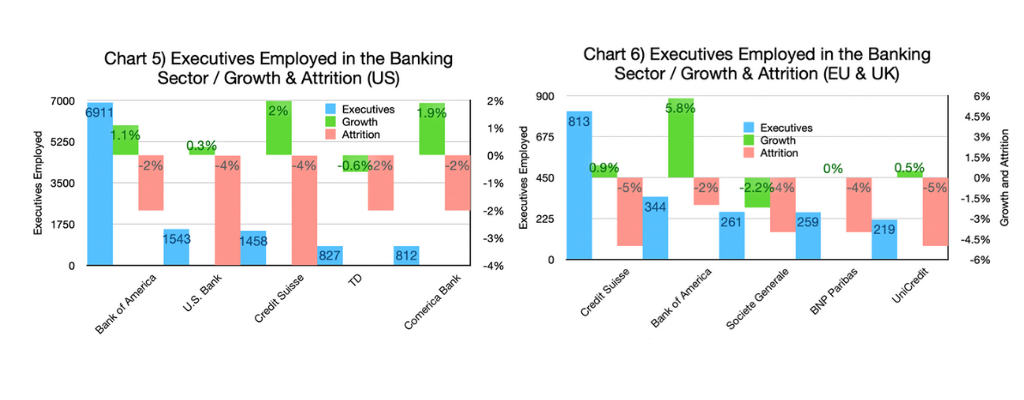
Chart 5 & 6-Executives Employed in the Banking Sector – Growth & Attrition (US and EU & UK graphs)
As far as the outlook for the banking sub-sector is concerned as of July, many of the large, publicly-traded banks reported earnings.
Bank of America reported $9.2 billion higher profits in Q2. BofA also more than doubled its earnings YOY. Citigroup and Wells Fargo also reported profits that beat analysts’ expectations. Profits were buoyed by the release of reserves taken against Covid-19-related risks. This is a sign that banks may believe the worst is behind us. (See Source)
The European bank earnings reports also indicated a positive mood in the sector. This continues to benefit from the low cost of capital. They also released reserve funds to some extent that had been put in place to protect against anticipated Covid-19 impacts. The top 20 banks covered in the latest Fitch Ratings, for example, improved their estimated return on equity by more than 7 percentage points. And Fitch Ratings projects that the balance of 2021 should continue in this improvement, though the picture is mixed from bank to bank. (See Source).
INSURANCE
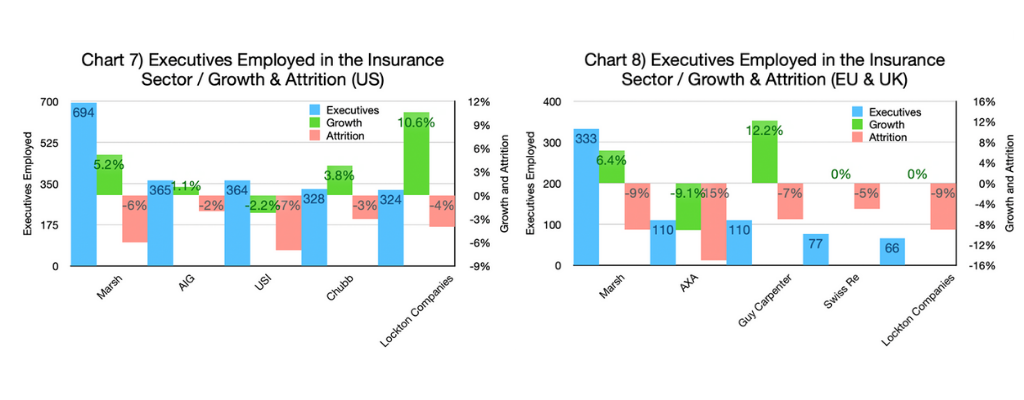
Among the big insurance concerns in the US, Marsh, Chubb, and Lockton showed significant growth in the number of executives they employ. USI was characterized by attrition and AIG stayed relatively stable. In the EU & UK, attrition was indeed the overall tenor of the executive hiring trend. Marsh and Guy Carpenter were also in the top five and boasted significant growth, as well. (See Charts 7 and 8).
A recent industry survey by Deloitte provided a relatively upbeat outlook for the US insurance industry:
“Financial expectations mostly positive, but some remain cautious on spending revenue expectations for 2021 among respondents were fairly positive, with 59% anticipating a higher top line, against only 16% predicting a decline […]. Modest gains of 1%–5% are predicted by 28% of respondents, but 31% expect even more robust growth—including 12% seeing jumps of over 15% ahead. Property and casualty (P&C) respondents were a bit more bullish than those from the life and annuity (L&A) sector, with 66% expecting growth in P&C (including 18% anticipating revenue gains of over 10%), versus 57% in L&A overall, and only 11% expecting more than 10% top-line growth.” (See Source)
Europe’s insurance industry is also expected to recover.
This is according to a recent analysis published by Allianz, including the relatively sluggish life insurance market:
“Post Covid-19 presents a unique opportunity to reverse slow-growth trend in the Life segment. Not because a turnaround in interest rates is imminent, certainly not, but because European households are sitting on a mountain of additional savings amounting to almost EUR 500bn. If the industry succeeds in translating its expertise in sustainable investing into attractive products for its customers, it should be able to secure a slice of this pie,” says Patricia Pelayo Romero […]. (See Source)
INVESTMENT MANAGEMENT
Managing investments is also known as asset management. Asset Management seems to have actually profited so far from the economic effects of the pandemic. Here are a few important summary statements from the recent Boston Consulting Group (BCG) report on this subject:
“The asset management industry has emerged from the global pandemic in a position of strength, with assets growing by 11% in 2020 to end the year at $103 trillion. Retail portfolios, representing 41% of global assets at $42 trillion, grew by 11% in 2020, while institutional investments grew at a similar pace to reach $61 trillion, or 59% of the global market. Retail investors were the main driver of net inflow, contributing 4.4% of net new capital in 2020, twice the size of the contribution made by institutional investors (2.2%).
The world’s largest asset management region, North America, delivered another year of double-digit growth in 2020, with assets under management […] increasing by 12% to reach $49 trillion. Growth was also strong in Europe (10%), Asia-Pacific (11%), and the Middle East and Africa (12%).” (See Source)
The BCG report goes on to highlight some interesting challenges and opportunities facing this sub-segment, including remote working, increasing competition that places higher demands on data and analytics, and the need to carve out growth strategies as the overall market’s growth softens. The investment management sub-sector is relatively small in terms of the number of executives it employed.
The top employer in the US is AllianceBernstein. They, for example, have only 220 relevant executives per our definition. Still, there has been much divergence in the sub-sector. This is because T. Rowe Price added significantly to its executive ranks and Pimco showed high volatility. The others in the top five either shrank marginally or remained relatively stable. (See Chart 9).
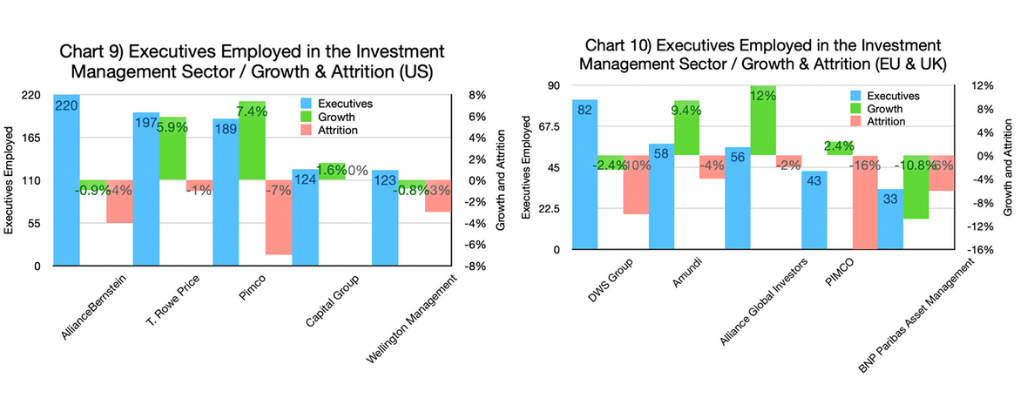
On the other side of the Atlantic in the EU & UK, attrition held sway. Two of the top ten suffered double-digit executive exit rates (DWS Group and BNP). Amundi and Alliance Global Investors on the other hand fielded significant net growth in the number of executives employed. PIMCO managed some growth despite high attrition. (See Chart 10).
VENTURE CAPITAL AND PRIVATE EQUITY
In a recent article, Forbes highlights the important role that the PE sub-segment plays. PE furnishes capital to private companies. PE allows a slower return than one might expect from a bank or a publicly traded company. Forbes continues:
“The private equity market showcased its resilience during this difficult season. PE firms focused on the long game and concentrated on supporting their portfolio companies. Private market transaction multiples have remained high. PE firms were able to take advantage of market volatility, and many quickly pivoted to focus on companies that offered pandemic-resistant investments.”
Forbes further cites Deloitte research. This research suggests PE assets may well continue to grow far faster than overall investment and may reach $5.8 trillion by 2025. (See Source)
There are apparently big changes underway in the Venture Capital market sub-segment as well if this explodingtopics.com blog can be believed. The blog cites these four major changes currently underway in the VC sub-segment:
- The number of mega-deals continues to increase
- Equity crowdfunding gives normal people access to venture capital
- Venture Capital leaves Silicon Valley
- VCs are cashing out
Looking strictly at who employs executives in this industry sub-segment, the numbers are small. But the changes are big. In the US, HIG Capital, HarbourVest Partners, and Platinum Equity all added executives at a double-digit rate. Though the high attrition at two of these firms also suggests that there is a significant churn going on. (See Chart 11).
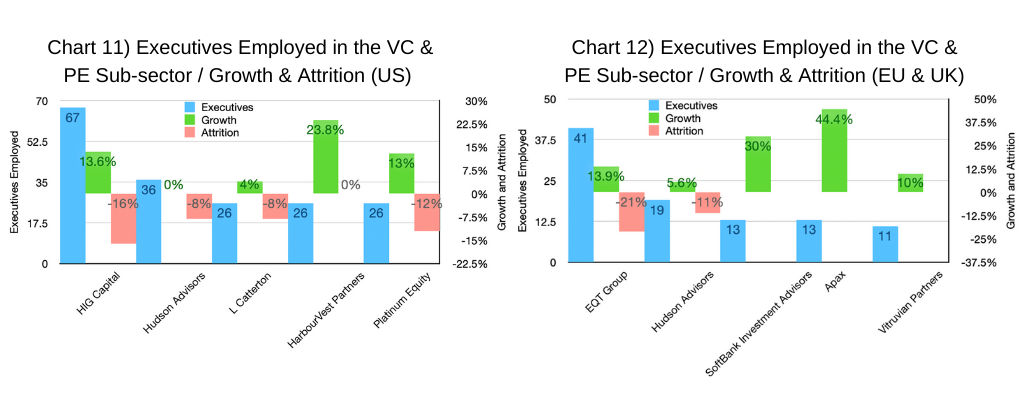
In the EU & UK market (Chart 12), SoftBank and Apax were clearly focused on expansion in their executive ranks, as was Vitruvian. While EQT Group and Hudson Advisors showed double-digit attrition. Executive positions in this sub-segment were mainly in London (998 executives), Paris (372), Madrid (280), Stockholm (252) and The Randstad (210) in the Netherlands in descending order. LinkedIn rated all of these locations’ ‘hiring demand” as High to Very High except Madrid that came is as “moderate.”
OTHER FINANCIAL SERVICES
As we reported upfront, this is a very large segment (149,000 executives in the US, of which 6,300 or so changed jobs in the last year). It is also very mixed in terms of the actual business activity. Top skills reported include Finance, Financial Analysis, and Risk Management. The geography of this sub-segment is also familiar: New York City, Los Angeles, Chicago, Boston, and Dallas in descending order. It is interesting to note New York is 8 times larger than Dallas in terms of the number of relevant executives employed.
The major employers are also well known: JP Morgan Chase & Co., Citi, Goldman Sachs, Wells Fargo, and Morgan Stanley constitute the top five. They are followed by J.P. Morgan, Merrill Lynch, PNC, State Street, and BNY Mellon fleshing out the top ten. But these top ten comprise only about 25% of the total executives employed in this sub-segment, so it is also relatively unconcentrated.
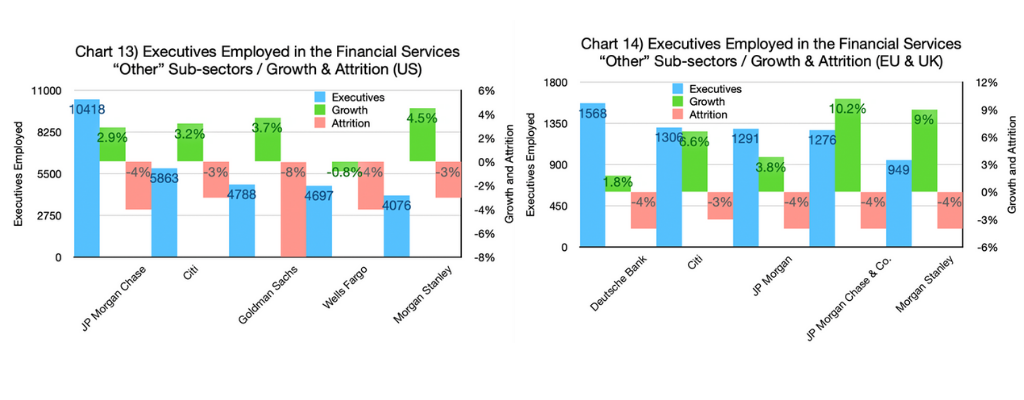
The EU & UK contingent is also quite large. They have 46,046 executives with a relatively balanced churn of 6% attrition and 4.5% growth. Like its US counterpart, this sub-segment is also quite mixed with the same key skills as in the US. The top fields of study provide a little further perspective: Economics, Business Administration, Finance, Accounting, and Mathematics. Lastly, the locations are very similar to other related sub-segments: London, Paris, Republic of Ireland, Stockholm, and The Randstad in the Netherlands. The number of executives employed in this sub-segment in London is almost 7 times the size of Paris.
Peter Irish, CEO The Barrett Group
Click here to download a printable version: Industry Update – Financial Services


