
INDUSTRY UPDATE: Travel, Leisure & Dining – May 2022
Introduction
Finally! We are starting to see signs of recovery in a number of industries hard hit by the pandemic: Leisure, Travel & Tourism, Entertainment, and Restaurants. In this industry update, we have summarized them as “Travel, Leisure & Dining.” This recovery is not particularly broad however and is even a bit lopsided.
In the US, “Out of the 1.6 million jobs left to recover, a staggering 1.5 million are in Leisure & Hospitality alone, pointing directly to the sector’s uneven recovery and how swift federal policies are needed to restore the travel workforce…” This is according to U.S. Travel Association Executive Vice President of Public Affairs and Policy Tori Emerson Barnes. [See Source.] It should be noted that this source is talking about all jobs, not just executive positions. In this industry update, our focus will be on executive management as explained in our Editor’s Note. Still, it is difficult to manage a business if you lack staff.
Restaurants in the US have indeed seen some degree of recovery. “The foodservice industry will reach $898 billion in sales this year. [This is] up from $799 billion in 2021 and surpassing pre-pandemic sales levels from 2019 of $864 billion, the group estimates in its “State of the Restaurant Industry Report” […] However, when adjusted for inflation, sales in 2022 are projected to remain below pre-pandemic levels, they said. Much of last year’s gains were tied to higher prices as costs soared for operators.” [See Source.] According to this source, staff shortages are also the key issue, though inflation in input costs is not far behind.
What about the entertainment sector?
Expect huge growth in this area from about $4 trillion in 2020 to $6 trillion in 2025. Here are the key points one source cites regarding this sector’s likely recovery (See Source):
- Patterns of consumption adopted during the pandemic will likely continue. This is particularly the attraction of streaming videos, digital sales, and gaming.
- Connectivity particularly via smartphones is key to the industry’s growth. This is provided the infrastructure can keep up with the bandwidth required.
- Live experiences and big-screen cinemas are not dead yet.
Travel and tourism in the EU also took a significant hit in 2020. Nights spent, for example, fell by 50% to 1.4 trillion nights in 2020 vs. 2.8 trillion in 2019. However, 2021 saw a 27% rise in this indicator as some markets recovered. (See Source.)
Restaurants in six big European countries (Germany, UK, Spain, France, Italy, and Russia) saw some resurgence in the second half of 2021. “The good news is that, when compared to 2020, the six European countries combined showed a significant recovery…. [With] spend growing by 19% altogether, while visits grew 15%, and eater cheques increased 3%. However, comparing against 2019, the industry in 2021 remained far away from the levels it came from. [Compared to] the last year prior to the pandemic, consumer spend was down by more than a quarter. ([This is] down 26%, or an absolute decline of €82 billion). Visit counts dropped by 29% between 2019 and 2021. And the eater cheque grew 4% during the same period, helping to counteract […] visit declines a bit.” [See Source.]
Food and drink in the EU comprises one of the most important manufacturing segments (along with automotive and machinery and equipment sectors). It delivered a 2018 turnover of €1,093 billion, sported a significant external trade surplus, captured about 21% of average household spend, and employed some 4.5 million people. [See Source.]
In Europe both fast food and food delivery seem poised to benefit further from the consumer behaviors learned during the harshest Covid-19 restrictions. Food delivery business is therefore expected to grow with a compound annual rate of more than 10% per year through 2027 to a market size of more than $66 billion. [See Source.]
In the Middle East, travel and tourism showed some recovery at the end of 2021. “Many of the publicly traded hotel companies to report fourth-quarter and full-year 2021 earnings over the last few weeks. [It also] noted the Middle East was one of their strongest-performing regions. Marriott’s revenue per available room — the industry’s key performance metric — in the Middle East was 8 percent above 2019 levels in the fourth quarter. It was 7 percent above 2019 levels for Hilton.” [See Source.] Note, we covered hotels specifically in our Hospitality Update.
Then there is the concept of “Revenge Travel.” People have been cooped up for years at this point and may be on the verge of getting going while the going’s (relatively) good.
“People still have the means to spend; they just needed a catalyst, and now they have one,” said Aneta Markowska. Markowska is chief economist at Jefferies, who is planning a spring vacation, her first in two years, to Turks and Caicos. “They are sitting on the biggest cash cushion they’ve seen in years — and that’s not just the wealthy; it’s 80 percent of the population.”
“Americans have set aside roughly $2.4 trillion in extra savings during the pandemic. [This is] in part because they’ve cut back on dining out, travel and entertainment, according to Wells Fargo. But data shows spending on those services tends to pick up rapidly as coronavirus cases subside.”
“Airline bookings for both domestic and international travel are on the upswing, according to Bank of America. Flight searches on the travel site Kayak have picked up in February, with interest in flights to the Philippines and Morocco more than doubling from a month ago.” [See Source.]
In summary, while Travel and Tourism have yet to fully recover certain other segments of the Leisure, Entertainment, and Restaurant markets are building on the momentum they developed due to Covid-19 lockdowns. Specifically:
- Streamed entertainment and the infrastructure to deliver it are set for continued growth;
- Internet-based food delivery and fast food are well placed to enjoy continued growth, too; and
- Depending on how “revenge travel” and other factors play out, travel and tourism service providers may see a surge. Or they may have to be patient and be prepared to aggressively market their services to regain consumers.
Travel, Leisure & Dining Executive Employment
At 276,000, this is a relatively large segment. Including 0.6% growth over the last 12 months, almost 7,000 executive opportunities were created or changed hands in the past year. This cohort is approximately 73% male. And includes a lot of very familiar brand names. Chart 1 provides an overview of where they work.
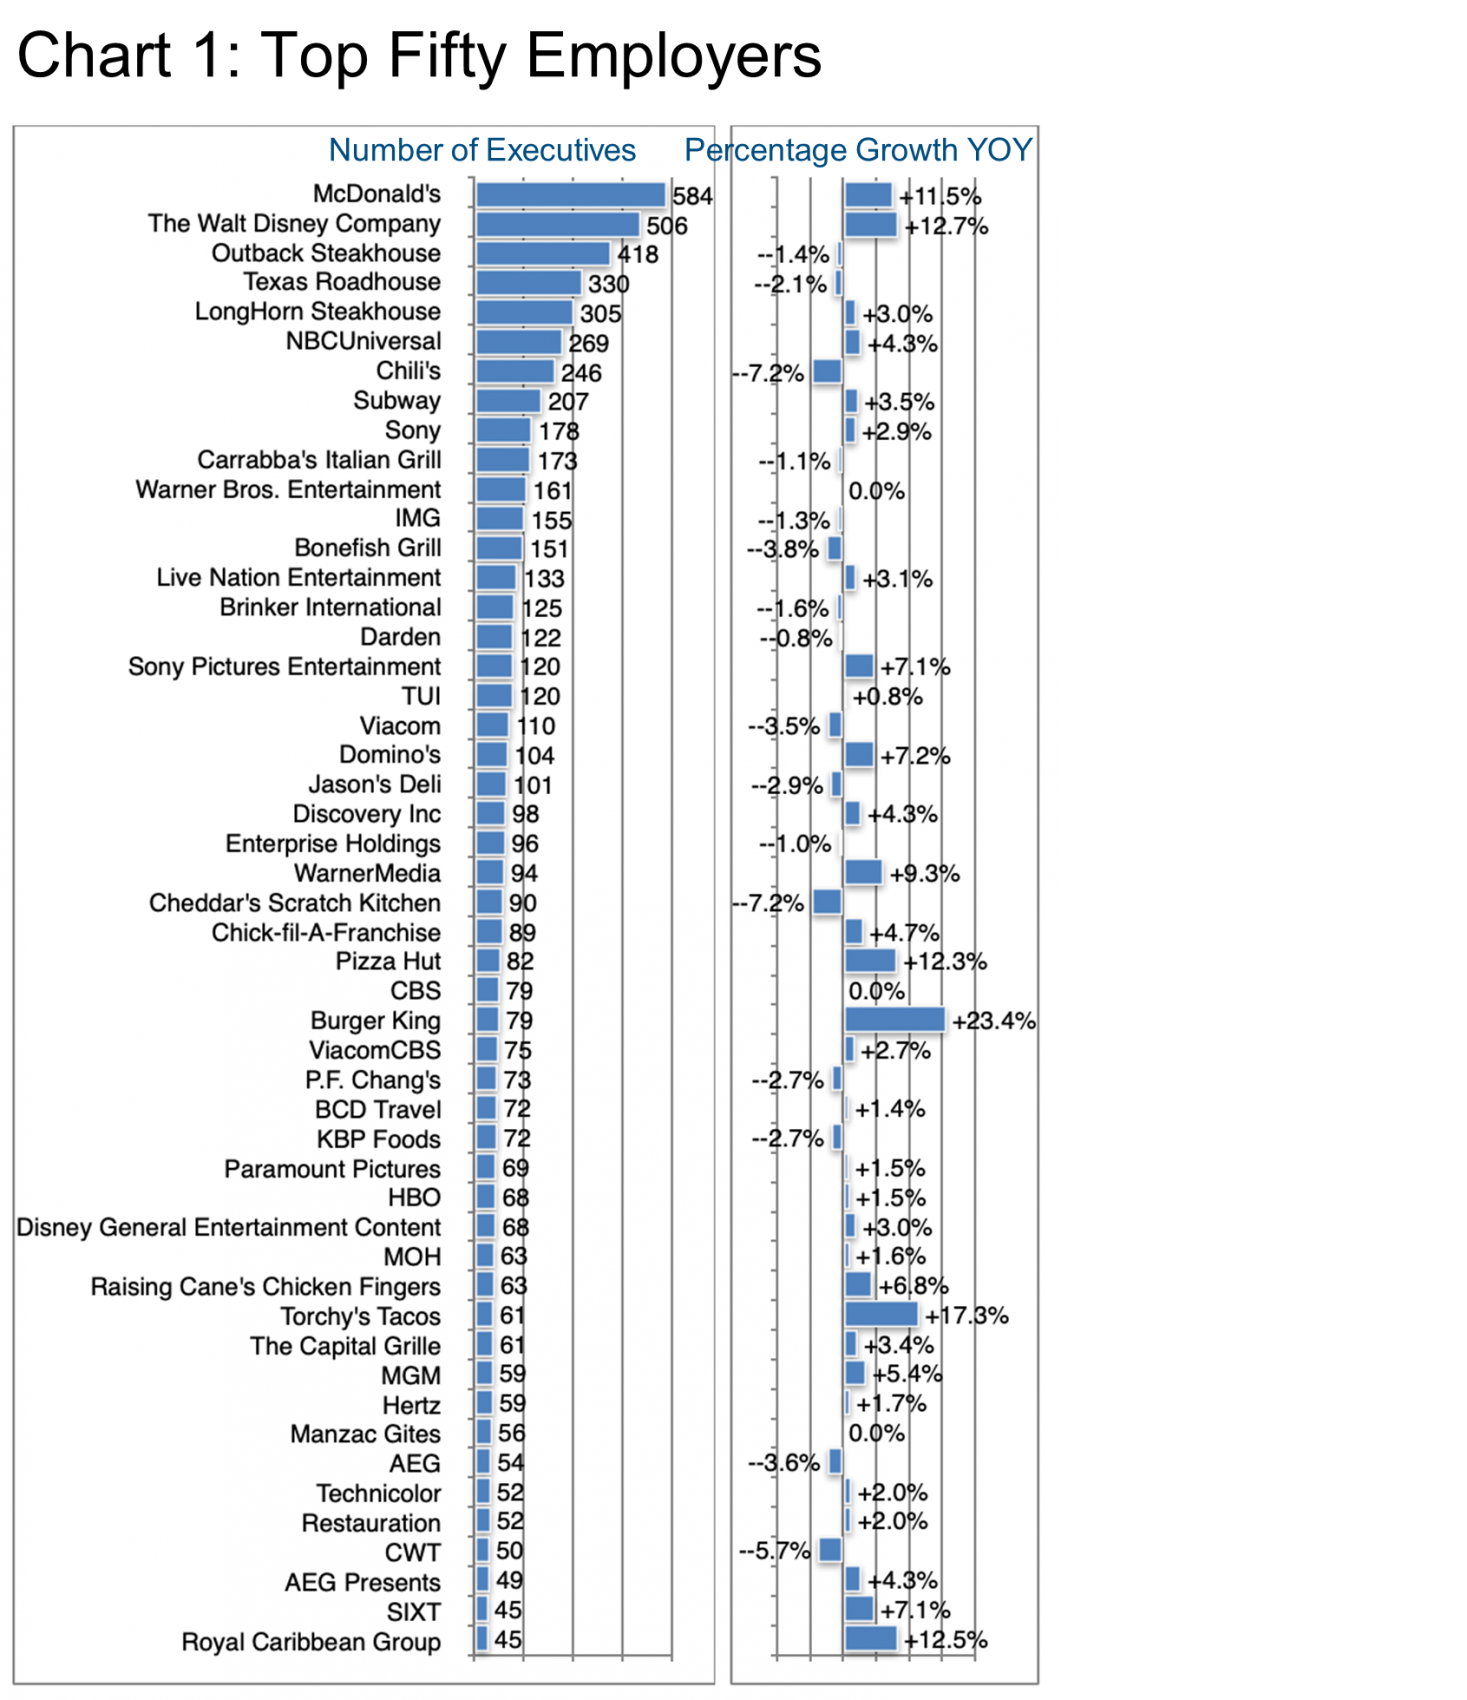
It is probably no surprise to see McDonald’s and Disney at the top of the chart. But their growth rates indicate a healthy return from the depths of the pandemic. In fact, many of the familiar food brands are doing well, too.
Many content and media companies also seem to be faring reasonably well. These are such as NBCUniversal, Sony Entertainment, and Warner Media.
Even Royal Caribbean Group makes the top 50 while showing impressive growth in its executive ranks.
From Chart 1, let us look into the top players and find out more about their hiring practices. McDonald’s, for example, hired 48 executives as we define them in the last 12 months. It also shed 6 and posted a net gain of 42. There was no obvious single source as they joined from such diverse companies. These are companies such as Mars, Penny Market (Czech Republic), TAP Air Portugal, Wayne’s Coffee, and Petco.
The Walt Disney Company also added 57, lost 7, and showed a net gain of 50 executives during the last year. They had a peak so far in March 2022. Here, too, there was no one single donor company but an eclectic mix of sources. These include ESPN and Hogan Lovells, a law firm specializing in international law.
LinkedIn reports this cohort as having the following general make-up with respect to which specific industry segment employs the executives:
- 134,000 Entertainment
- 76,000 Restaurants
- 67,000 Travel and Tourism
Beyond this general overview lies a wealth of specific industries, including the top 30 as revealed in Chart 2.
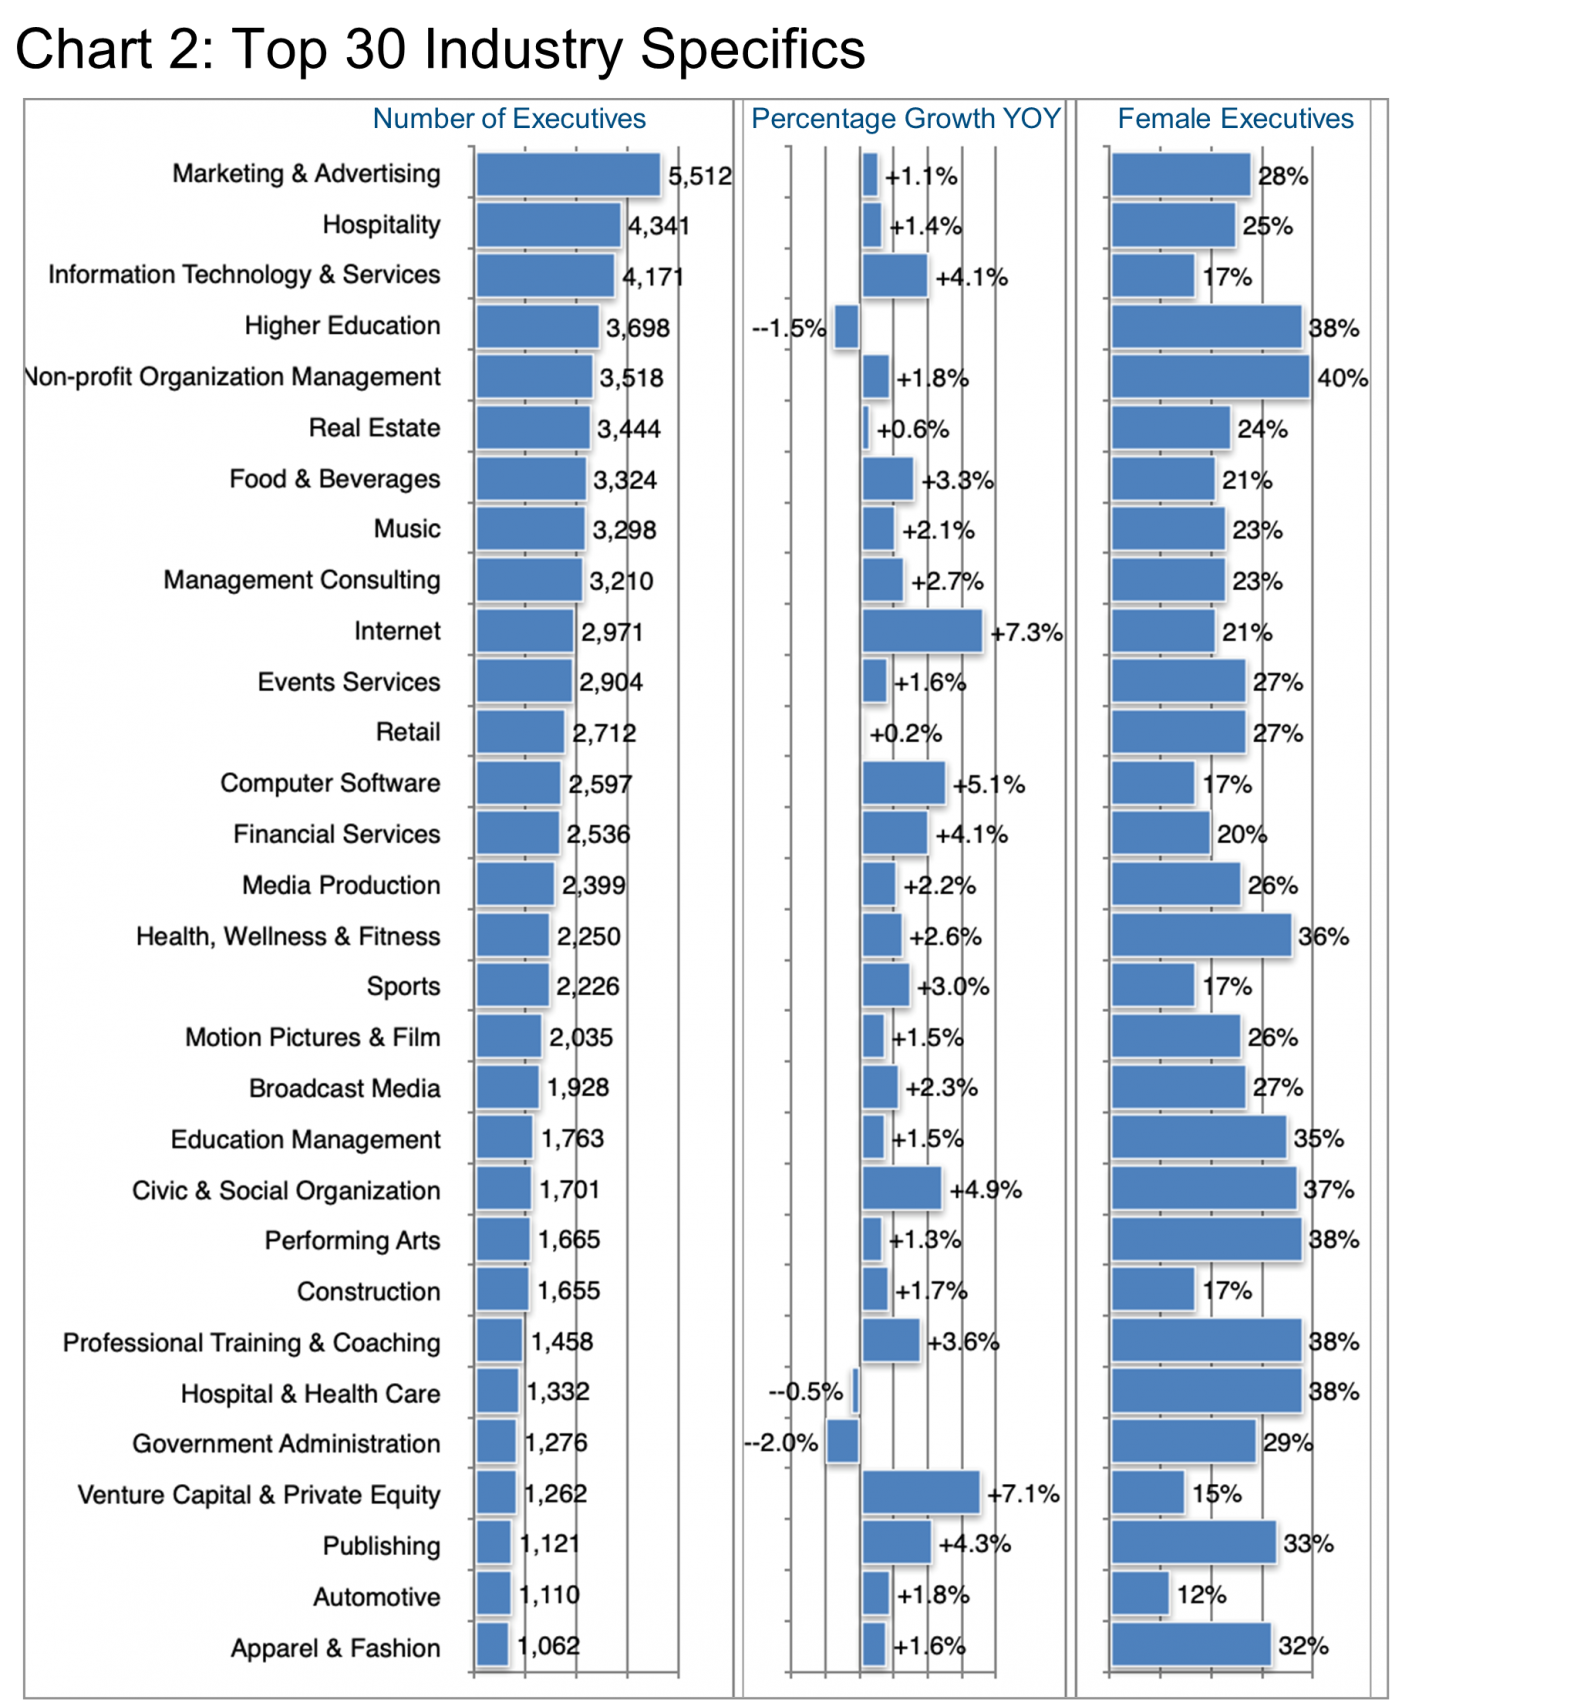
While Marketing & Advertising comprises the largest group, there is a surprisingly diverse list thereafter. These include ample IT executive opportunities, Higher Education, Non-profit Management, and even Real Estate apparently attracting talent from other industry verticals. This is where an emphasis on transferable skills and experience will greatly aid candidates wishing to enter from another industrial background.
As far as gender is concerned, a number of specializations stand out as employing a higher than average share of female executives. These include Real Estate, Food & Beverage, Sports, Performing Arts, Construction, Professional Training & Coaching, and Hospital & Health Care. Some of these are showing a healthy 38-40% female executive share, far exceeding the industry average of 27%.
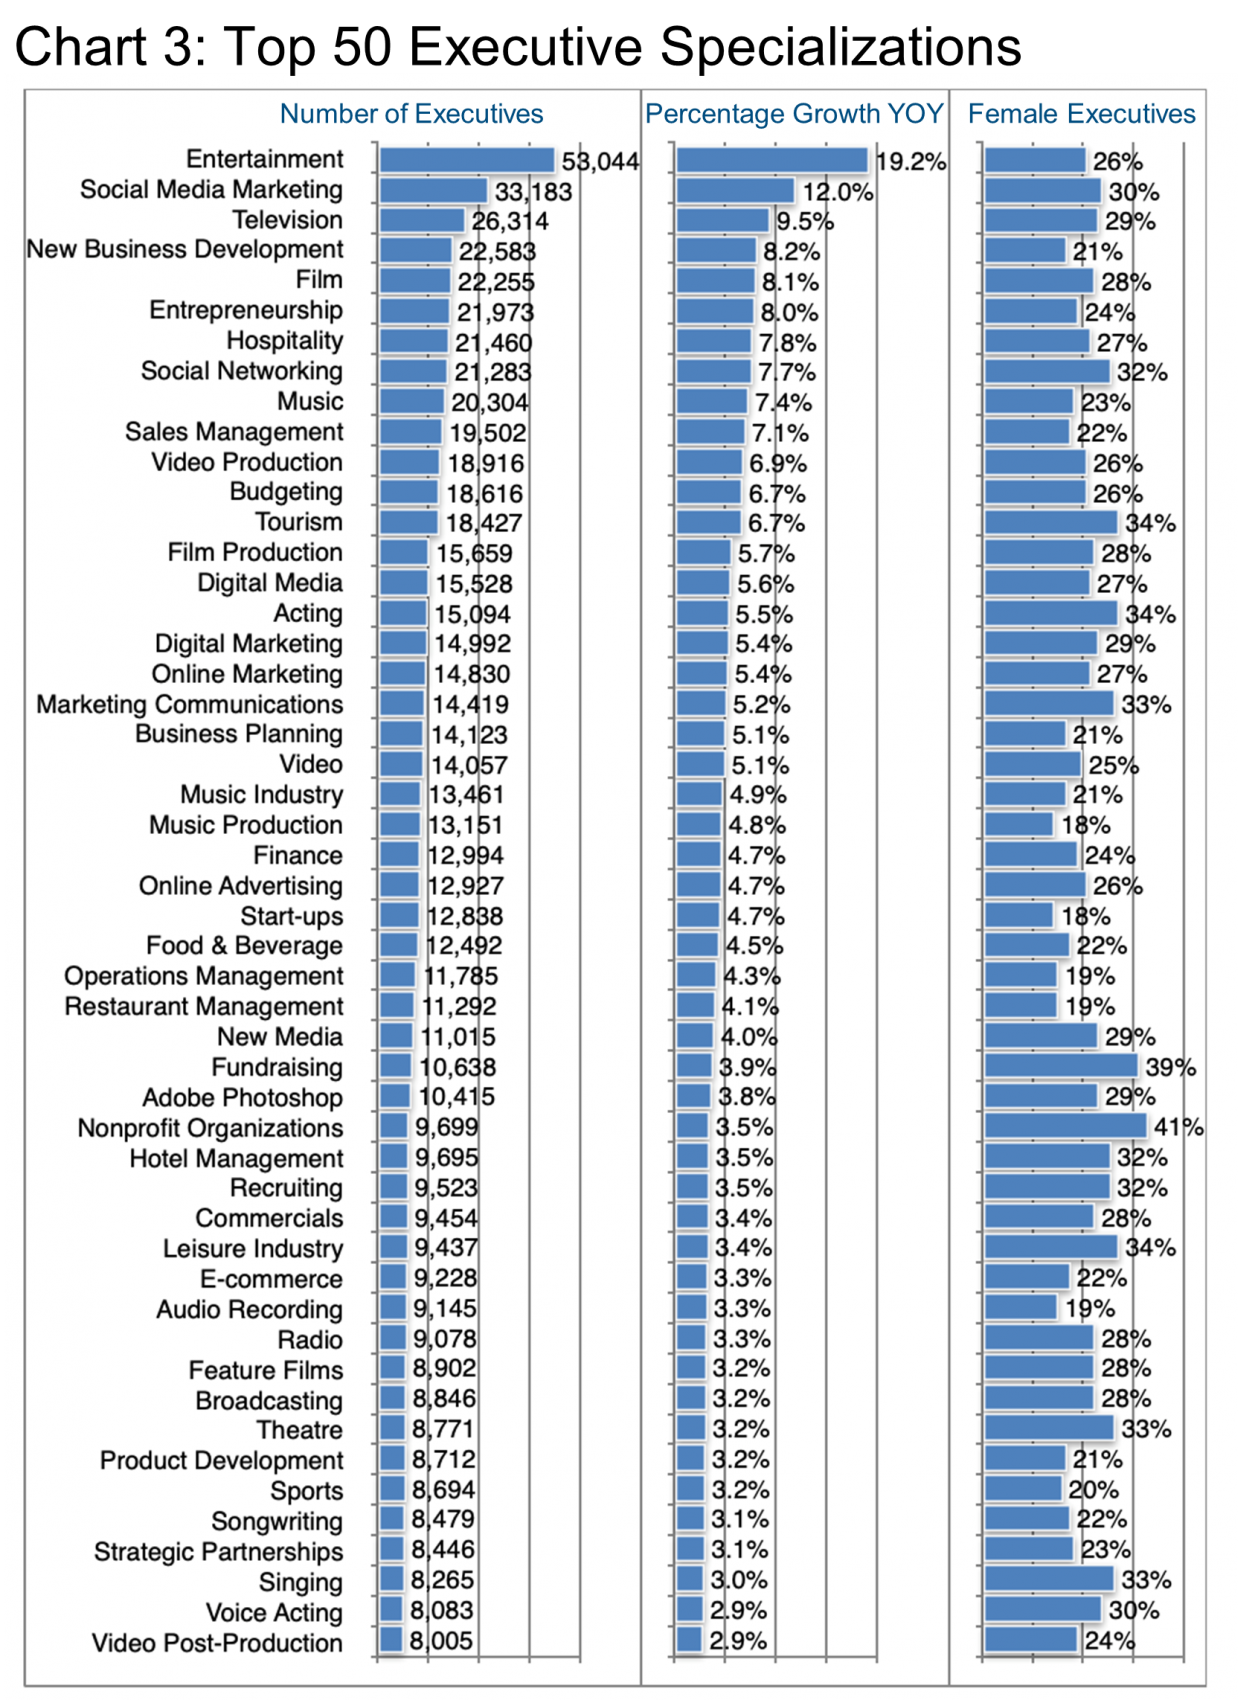
This is indeed a diverse cohort that we have pulled together. And is mainly because of the similar negative effect the pandemic initially had on their overall businesses. So it is no wonder that the specializations their executives cite are also disparate (Chart 3). Logically, Entertainment stands out. But thereafter the list becomes much more particular.
Social Media Marketing, for example, is in second place. It is a specialization that can draw talent from all across the industrial spectrum and thus provide a channel for cross-industry executive moves. The same might be said for fourth-ranked New Business Development as well as many more of the specializations listed here.
On the other hand, many of these skill sets are very specific to this industrial grouping, for example, Television, Film, Acting, or even Songwriting. In a way, it is inspiring to know that so many executives find opportunities in unusual niches such as Theatre or Voice Acting even in this day and age. Several areas also stand out for their high female executive share, notably Fundraising and Nonprofit Organizations.
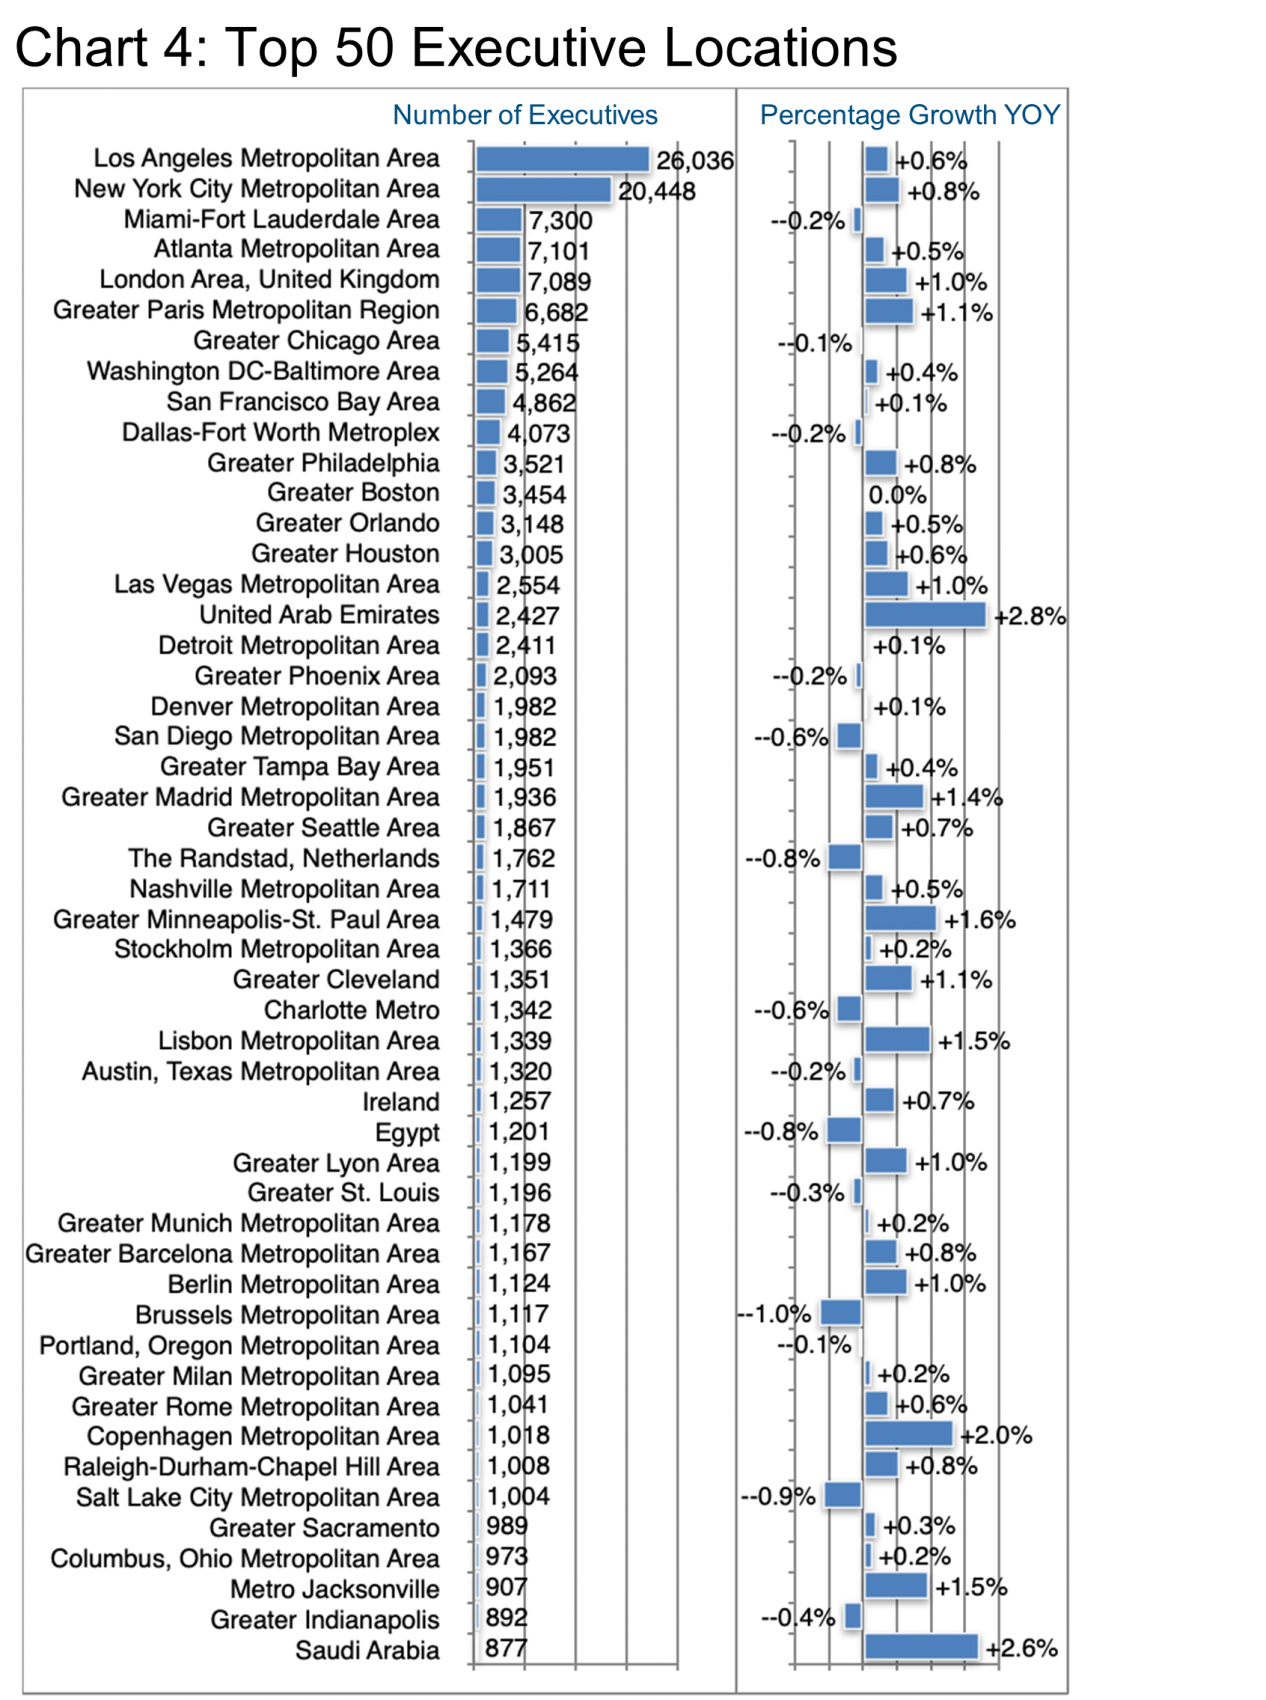
For a change, New York is only number two on this chart of the most populous locations (Chart 4), topped as it is by Los Angeles. However, London and Paris rank in the top six, while the UAE comes in at number 16, albeit with the highest growth rate of the lot.
Walt Disney, Warner Brothers, and Sony are the largest employers of executives in these industries in Los Angeles, whereas NBCUniversal, Viacom, and ViacomCBS employ the most industry execs in New York. Royal Caribbean tops the bill in Miami-Fort Lauderdale, LongHorn Steakhouse in Atlanta, and McDonald’s leads executive employment in London, Paris, and Chicago.
The executive ranks seem indeed to be growing more slowly in US locations with only Minneapolis-St. Paul and Jacksonville meeting or exceeding 1.5% YOY while numerous locations outside the US including the UAE, Copenhagen, Saudi Arabia, and Lisbon meet or exceed this benchmark.
Peter Irish, CEO The Barrett Group
Click here to download a printable version: INDUSTRY UPDATE: Travel, Leisure & Dining
Editor Note:
In this particular Industry Update, “executives” will generally refer to the Vice President, Senior Vice President, Chief Operating Officer, Chief Financial Officer, Managing Director, Chief Executive Officer, Chief Human Resources Officer, Chief Marketing Officer, Chief Information Officer, Managing Partner, and President titles. Unless otherwise noted, the data in this Update will largely come from LinkedIn and represents a snapshot of the market as it was at the time of the research.
Is LinkedIn truly representative? Here’s a little data: LinkedIn has approximately 722 million users, 174 million in the US, and 163 million in Europe. (See Source.) LinkedIn is by far the largest and most robust business database in the world, now in its 18th year. LinkedIn defines the year-over-year change (YOY Change) as the change in the number of professionals divided by the count as of last year. “Attrition” is defined as the departures in the last 12 months divided by the average headcount over the last year.