
INDUSTRY UPDATE: Hospitality – November 2021
INDUSTRY UPDATE- Hospitality
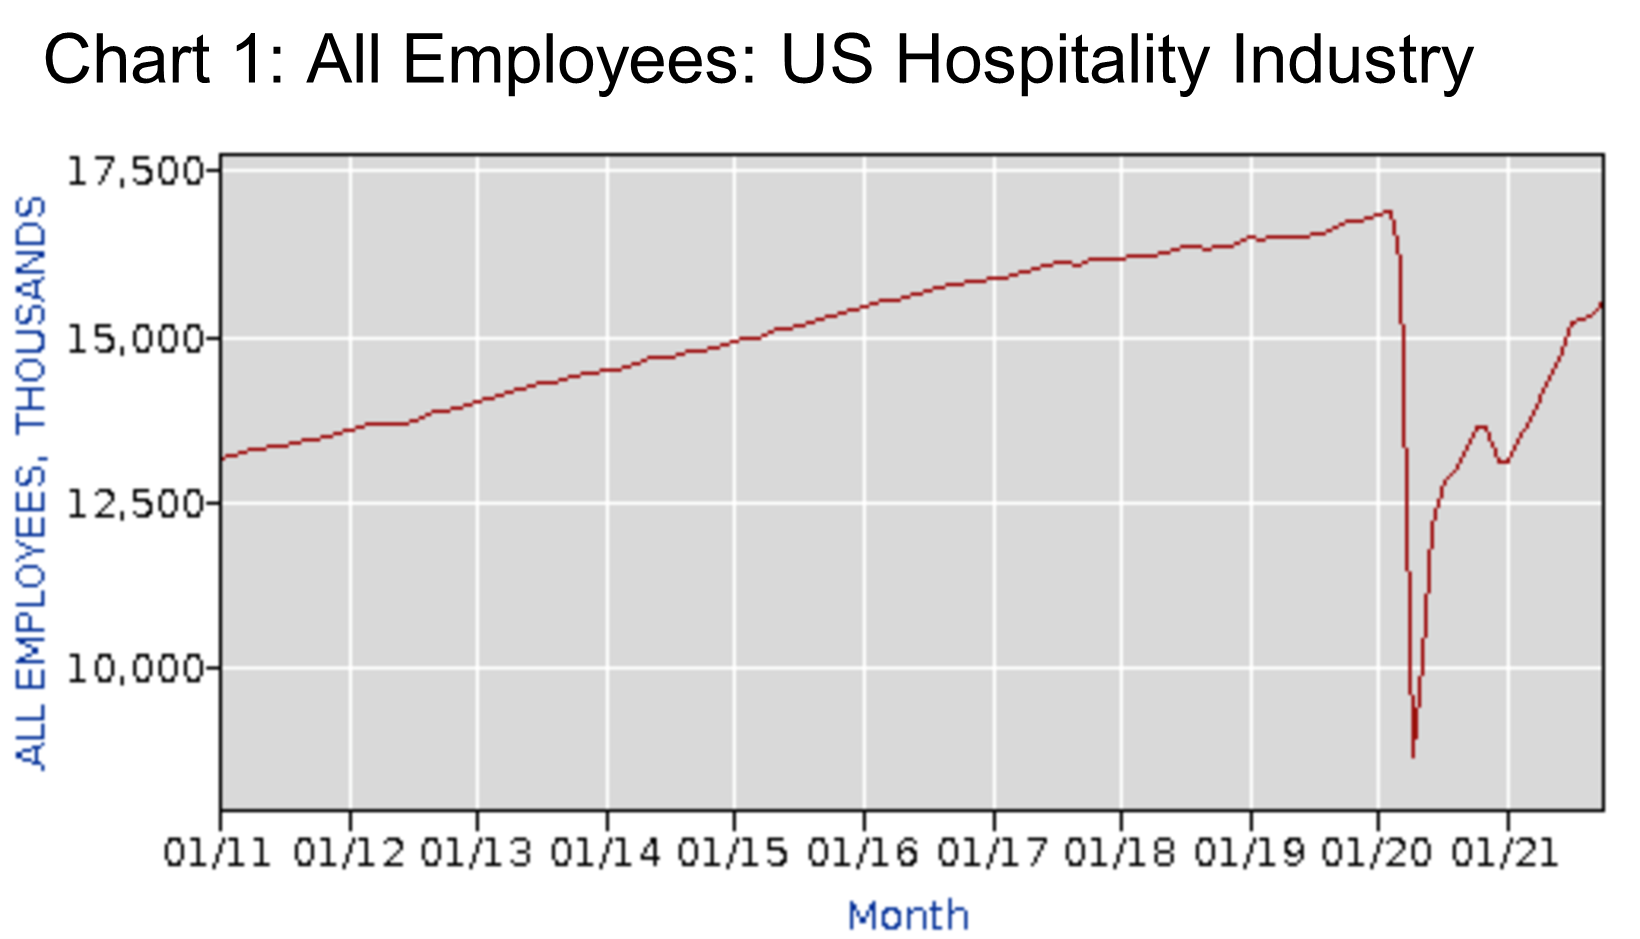
Other than perhaps the airlines, no other industry has been hit as hard by the pandemic as the hospitality industry. The US Bureau of Labor Statistics (BLS) cites industry job losses in the US in the millions at the beginning of 2020. (See source including Chart 1.) However, the net job changes swung in a positive direction during the balance of 2020 and into 2021. So the industry is definitely recovering.
As a continent known for its many tourist destinations, Europe also relies heavily on the hospitality industry. Though it is important to note that estimates of employment vary widely probably due to differences in definition. The German bureau for statistics cites about 8.2 million employed in the sector in the EU (see source). This number when compared to the US, seems low per capita. Apparently, the narrow SIC definition adds another 2.3 million in the UK. Broader measures make that 3.2 million or 9.3% of UK employment (see source).
After chugging along for decades at or slightly above the 10% of GDP level in the US, hospitality shrank to just 5.5% in 2020 before beginning its recovery (see source). It is difficult to find coherent data about 2021 for Europe. Somewhat older sources cite a GDP share of about 5% for the hospitality sector (see source).
The BLS forecasts overall job growth in the US industry at about 9% per annum through 2030 (see source). In Europe, one perspective on the outlook for the industry is as follows: “The hotel industry in Europe market size was estimated at ~EUR 9.2 billion in 2020. As compared with 2019, revenues declined by ~59.79% in 2020 YOY. But the market will also see a steep recovery in 2021 and 2022 led by domestic and leisure tourism. It is only by 2024, that the market will be able to reach pre-covid levels of around ~EUR 34.5 billion.
The Chained Hotel industry in Europe market size is expected to grow at ~15.16% CAGR between 2021-2026. The demand from domestic travelers in the short term and luxury hotel segment led by leisure trips holds higher growth potential (see source).”
Finding reliable data on the demand side of the equation for the Middle East (ME) has proved illusory so far. However, if occupancy rates are a proxy for health, then the significant recovery underway in Q3 2021 is a good sign. The recovery of occupancy apparently followed a surge in vaccination:
“Several countries in the Middle East have been racing ahead of the rest of the world in vaccination rollout. The United Arab Emirates is a prime example with more than 86% of its population fully vaccinated as of 25 October 2021, according to Our World in Data. As vaccination rates improve, restrictions for international travel continue to be eased and demand in the hotel sector continues to improve toward pre-pandemic levels. In September, Middle East hotel occupancy was 58.6%, which was the region’s highest level since February 2020 and 93.9 % of the 2019 comparable (62.4%). Those levels reflect a consistent upward trend as the region’s occupancy was 50.7% in July and 55.9% in August. [This] represented 83.8% and 88.6% of 2019 comparables, respectively (see source).”
And investors apparently still expect a healthy longer-term prognosis for hotels in the region:
“Middle Eastern countries with the greatest number of [hospitality] projects in the construction pipeline are Saudi Arabia, with 194 projects/66,885 rooms, and the United Arab Emirates (U.A.E.) with 146 projects/40,846 rooms. Egypt follows with 67 projects/15,892 rooms, then Qatar with 62 projects/14,859 rooms. Continuing to lead the construction pipeline in the U.A.E. is Dubai, with 111 projects/32,369 rooms (see source).”
Overall, we are looking at an industry that is likely to come back strongly over the next few years. This is particularly true given the cash hordes consumers have amassed during the pandemic and the pent-up demand. So what does all this mean for executives who want to continue in or enter the hospitality industry?
Executive Employment in the Hospitality Industry
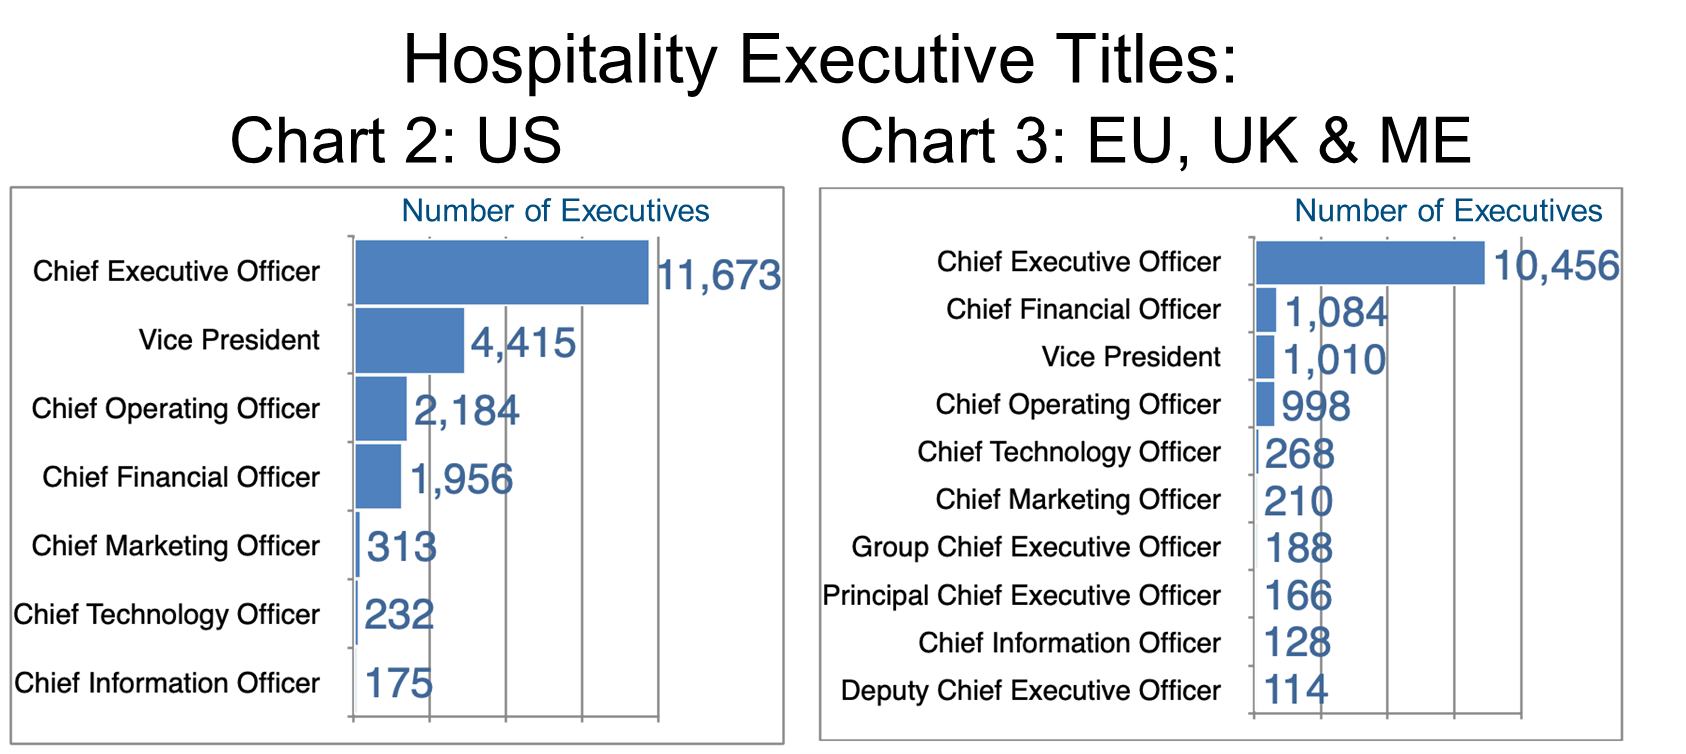
LinkedIn cites some 35,600 executives as we define them. This is up 2% over the prior year. It amounts to about 14,600 in the EU, UK & ME markets, up about 3%. Another 21,000 are in the US, a pool that has grown by about 2% YOY. About 31% of these positions are held by women. This number is more in the US (36%) and less in the EU, UK & ME cohort (24%).
This industry is also fairly top-heavy as far as executives are concerned (Charts 2 and 3). The majority occupy the CEO slot both in the US and the EU, UK & ME group.
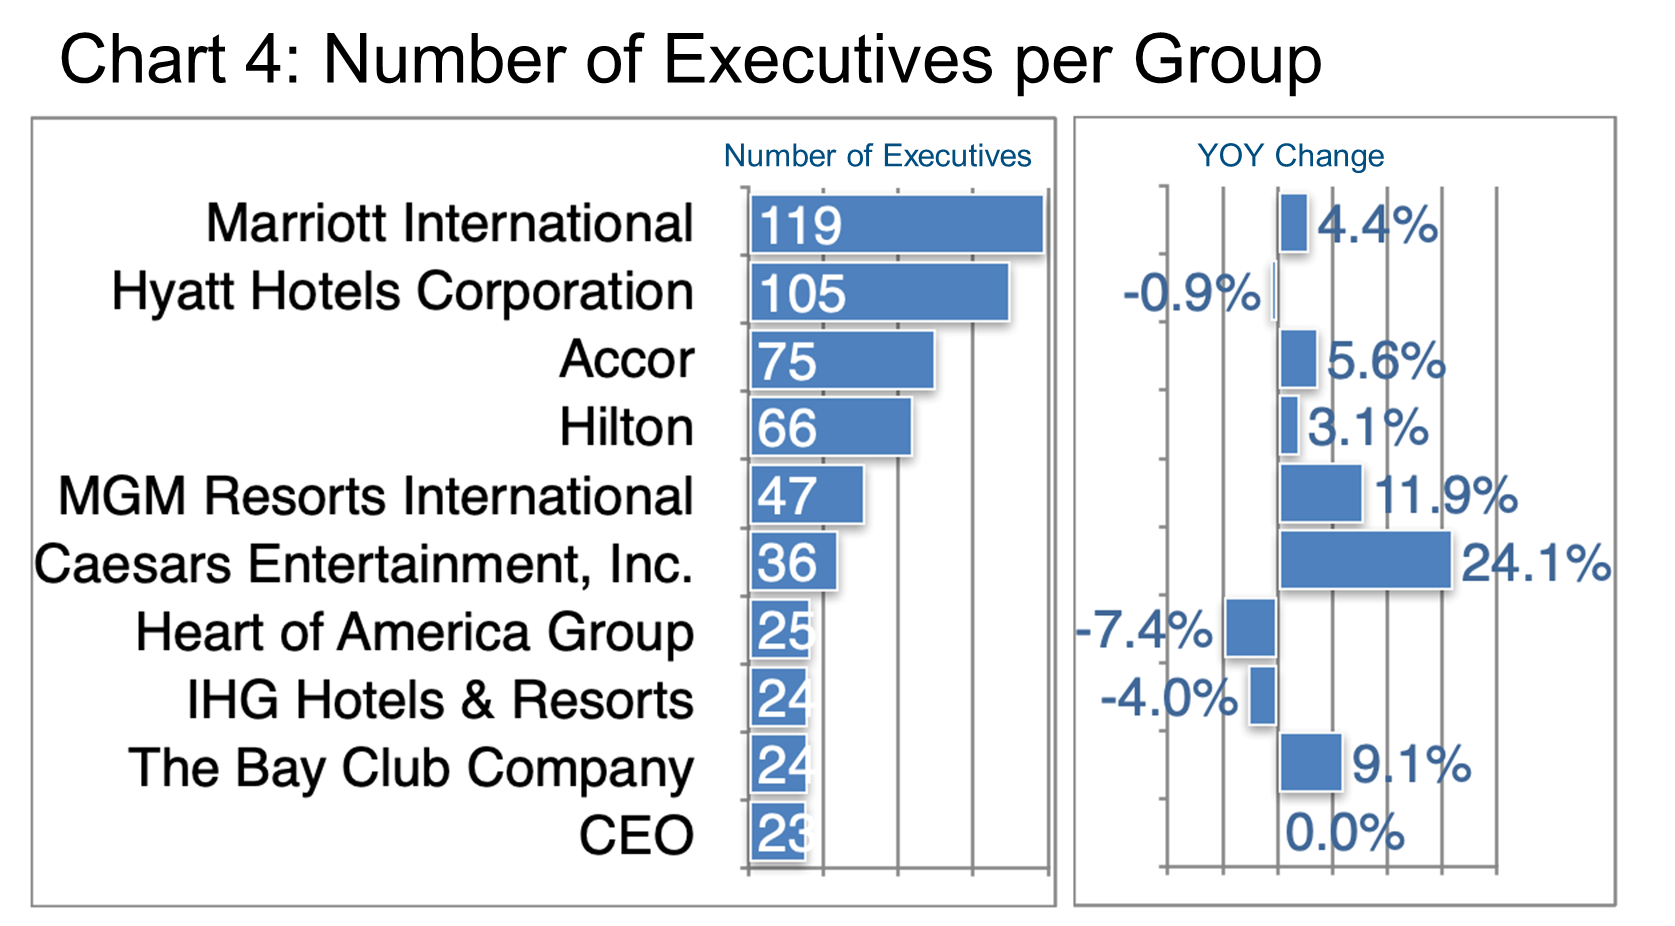
Marriott, Hyatt, Accor, and Hilton certainly dominate the international stage. These are the hotel operators with the largest executive pools (Chart 4) that are also in various states of play as the pandemic unfolds and a degree of normal business activity resumes.
However, when we separate the key regions we see much more specifically who is leading and lagging in the development of their respective executive ranks.
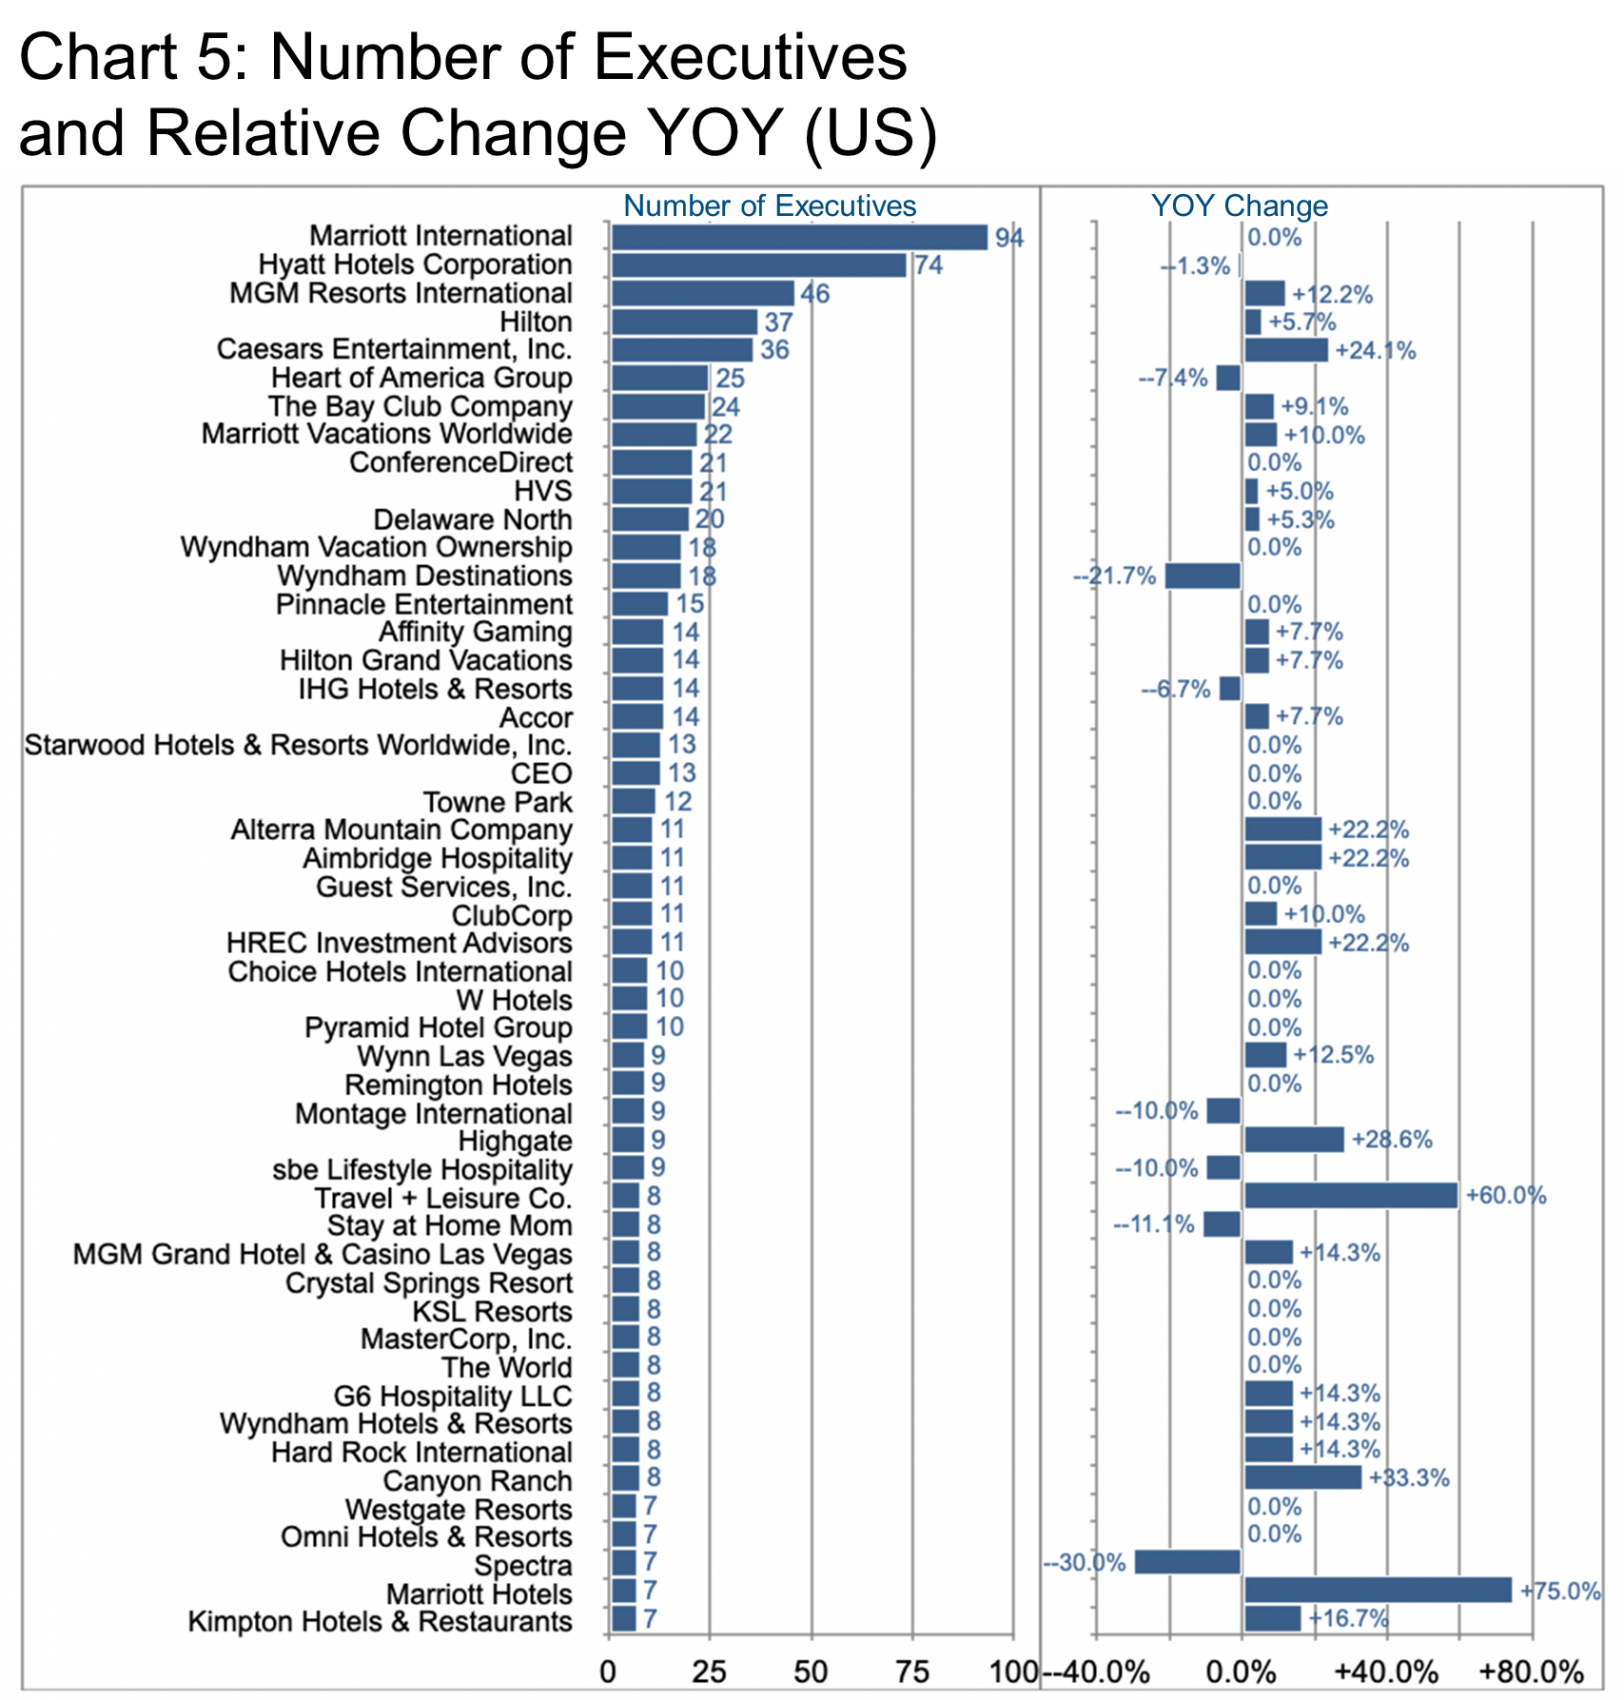
Marriott International, for example, appears not to be bolstering its executive ranks in the US (+0% YOY). However, the EU, UK & ME regions are up (+25%). Specifically, the growth came mainly in London, UAE, Jakarta, and New Delhi. Hyatt, on the other hand, remains stable in both regions. Another fast grower in the US was Caesars Entertainment Inc. Caesars expansion was apparently confined to Las Vegas.
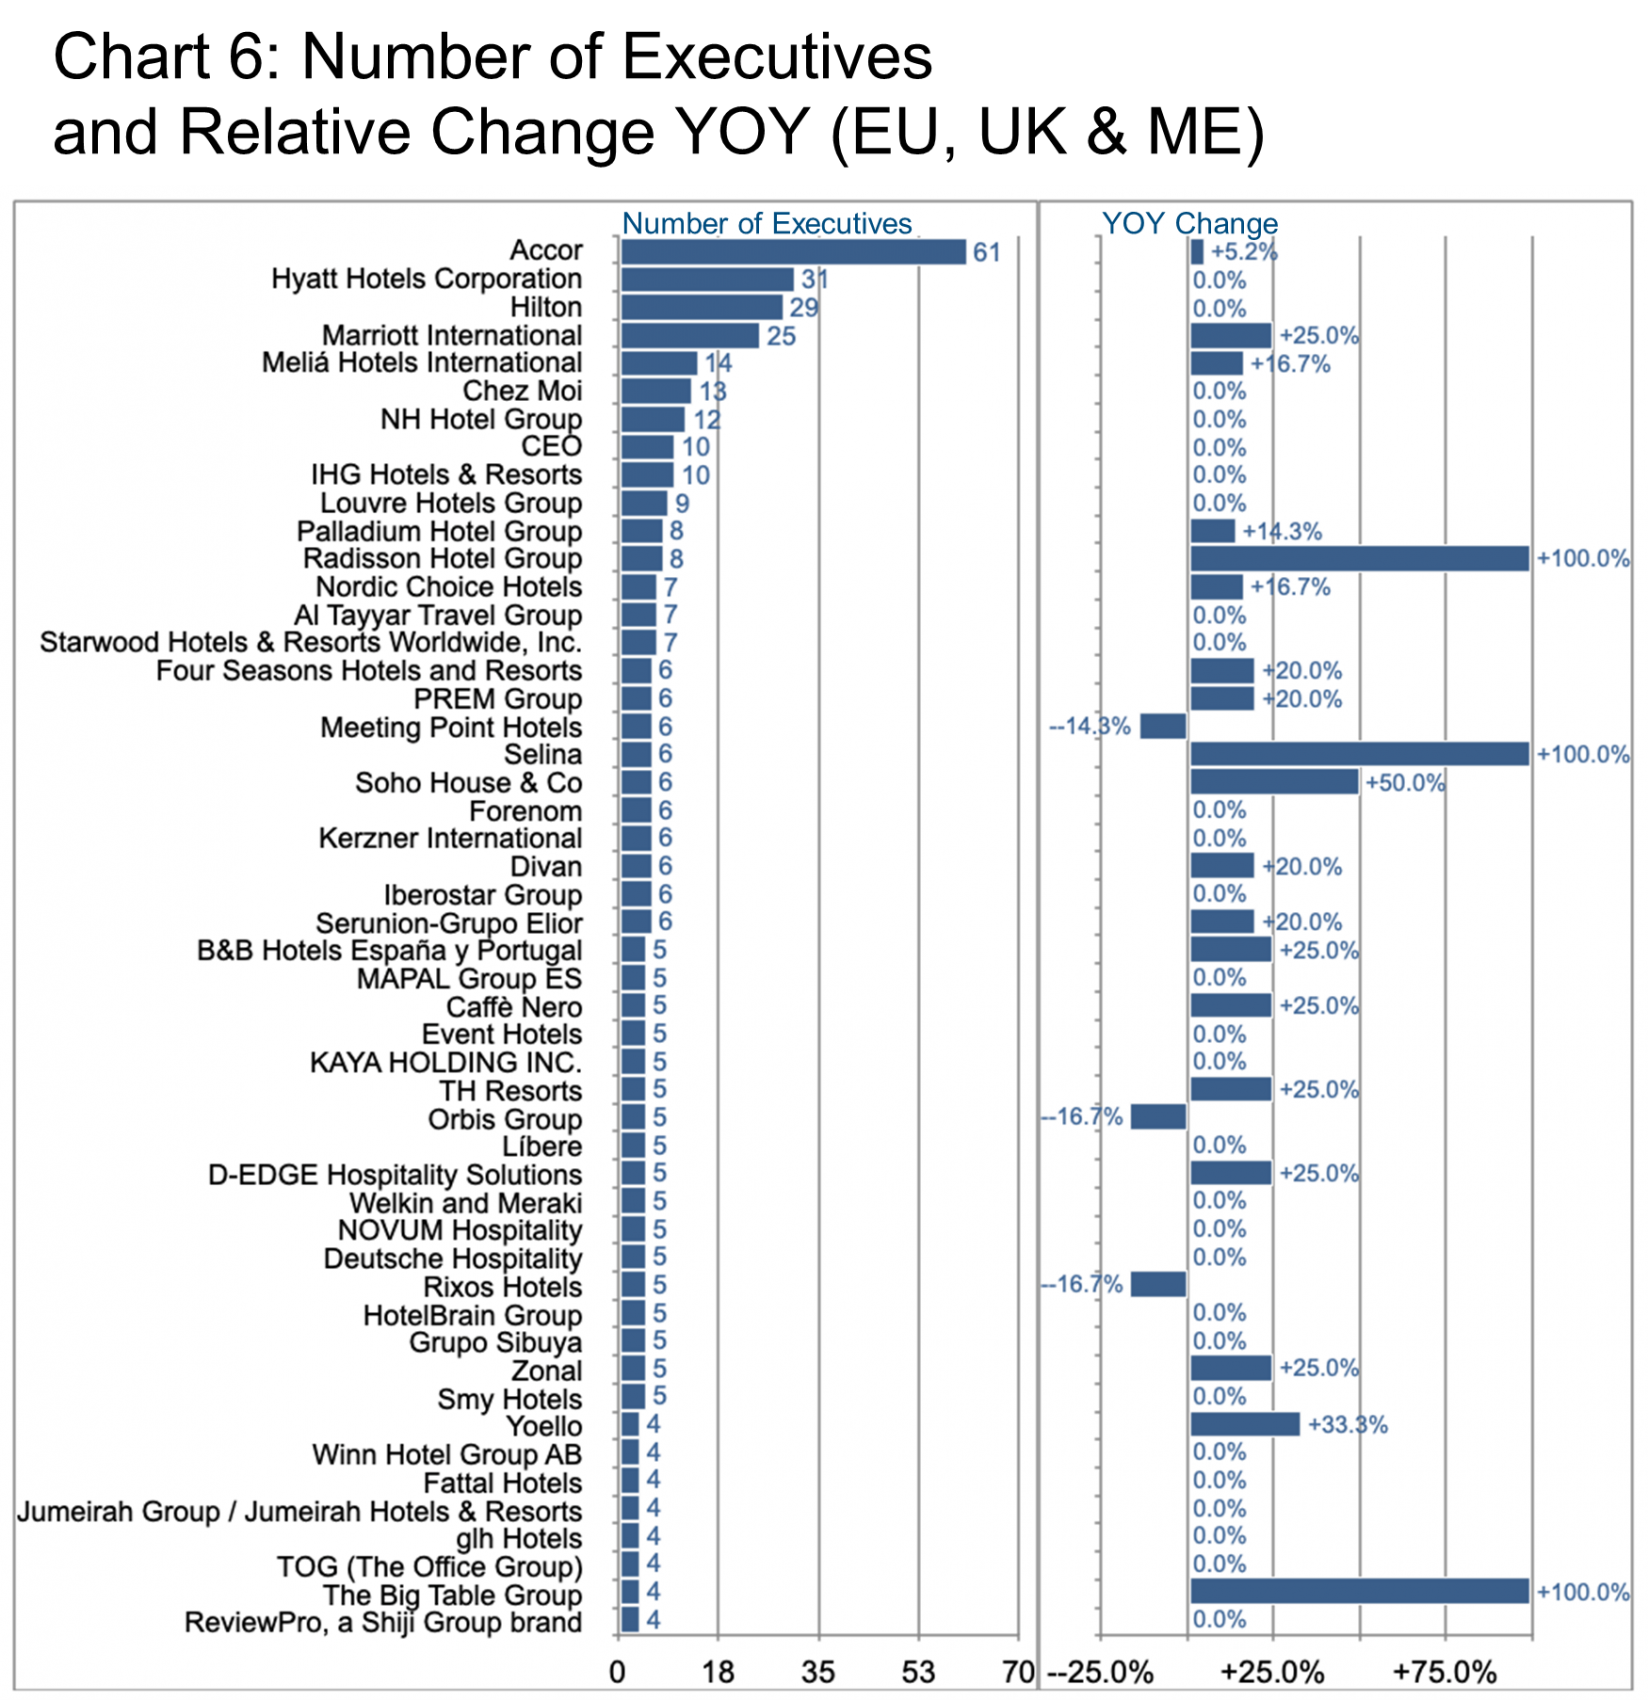
Among European players, Accor decreased its executive base in Paris (-13%) and Singapore (-29%). Accor grew in the UAE, Toronto, New York City, Warsaw, and Munich. Melia Hotels International expanded in Mallorca and Barcelona. Radisson Hotel Group focused on Brussels.
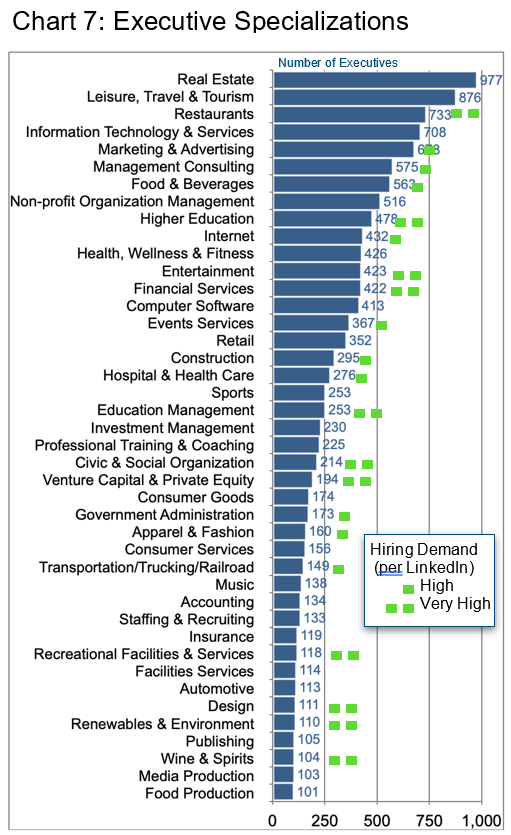
As even industry outsiders will recognize, a large hotel is almost like a city with so many different functions interacting seamlessly to deliver a harmoniously pleasant experience to the guests. This requires a broad range of specializations spanning the gamut. Specializations range from managing real estate to restaurant operations, health care, marketing and media, access to capital, etc. Chart 7 provides an overview of the relative distribution of these specializations. This is shown across the 35,600 executives identified by LinkedIn as belonging to this industry. It may serve executives interested in entering into or continuing in this business area so as to see how their specific specializations might fit. Indeed, they might also wish to consider changing specializations into one with higher demand.
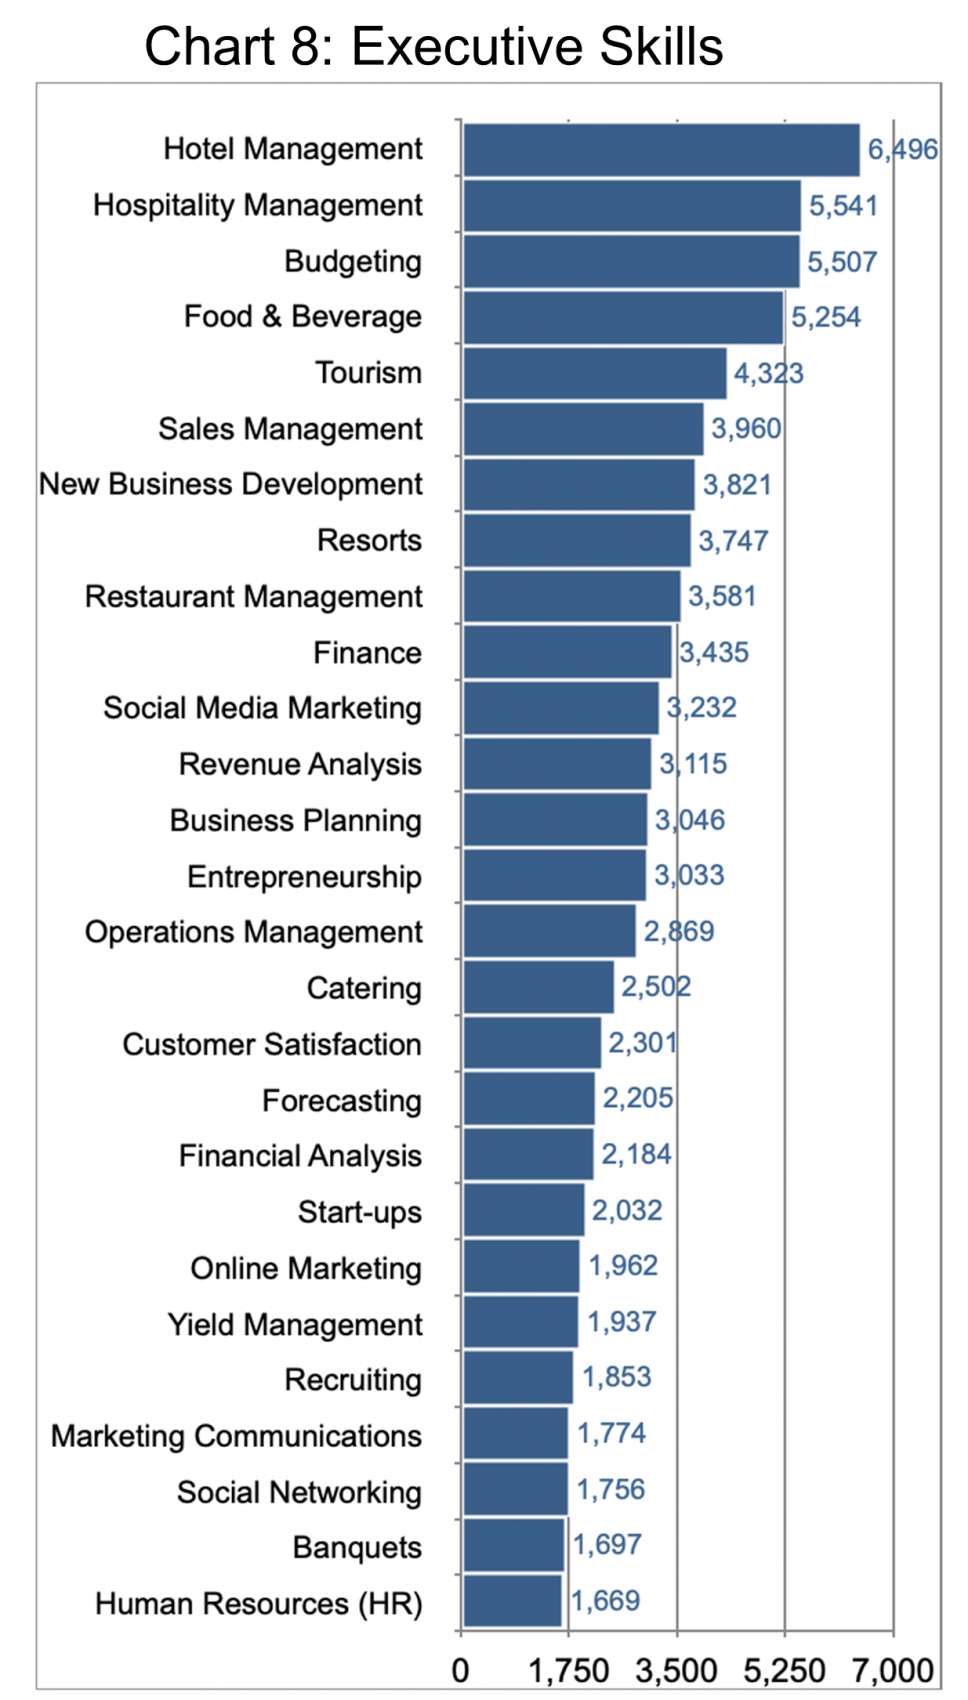
Chart 8 provides an overview of the various skills cited by hospitality executives where some skills are obvious (hotel management). It also includes more generic skills suggesting that moves into this industry from outside should be quite achievable.
In the US, New York may have the biggest pool of hospitality executives. But New York boasts only slightly higher than average growth. North Port[1]Sarasota, Jacksonville, Columbus, and Nashville all show about 8-9% growth YOY. These cities are followed by Dallas-Fort Worth, Richmond, and Albany in the 5-6% range. (Chart 9).
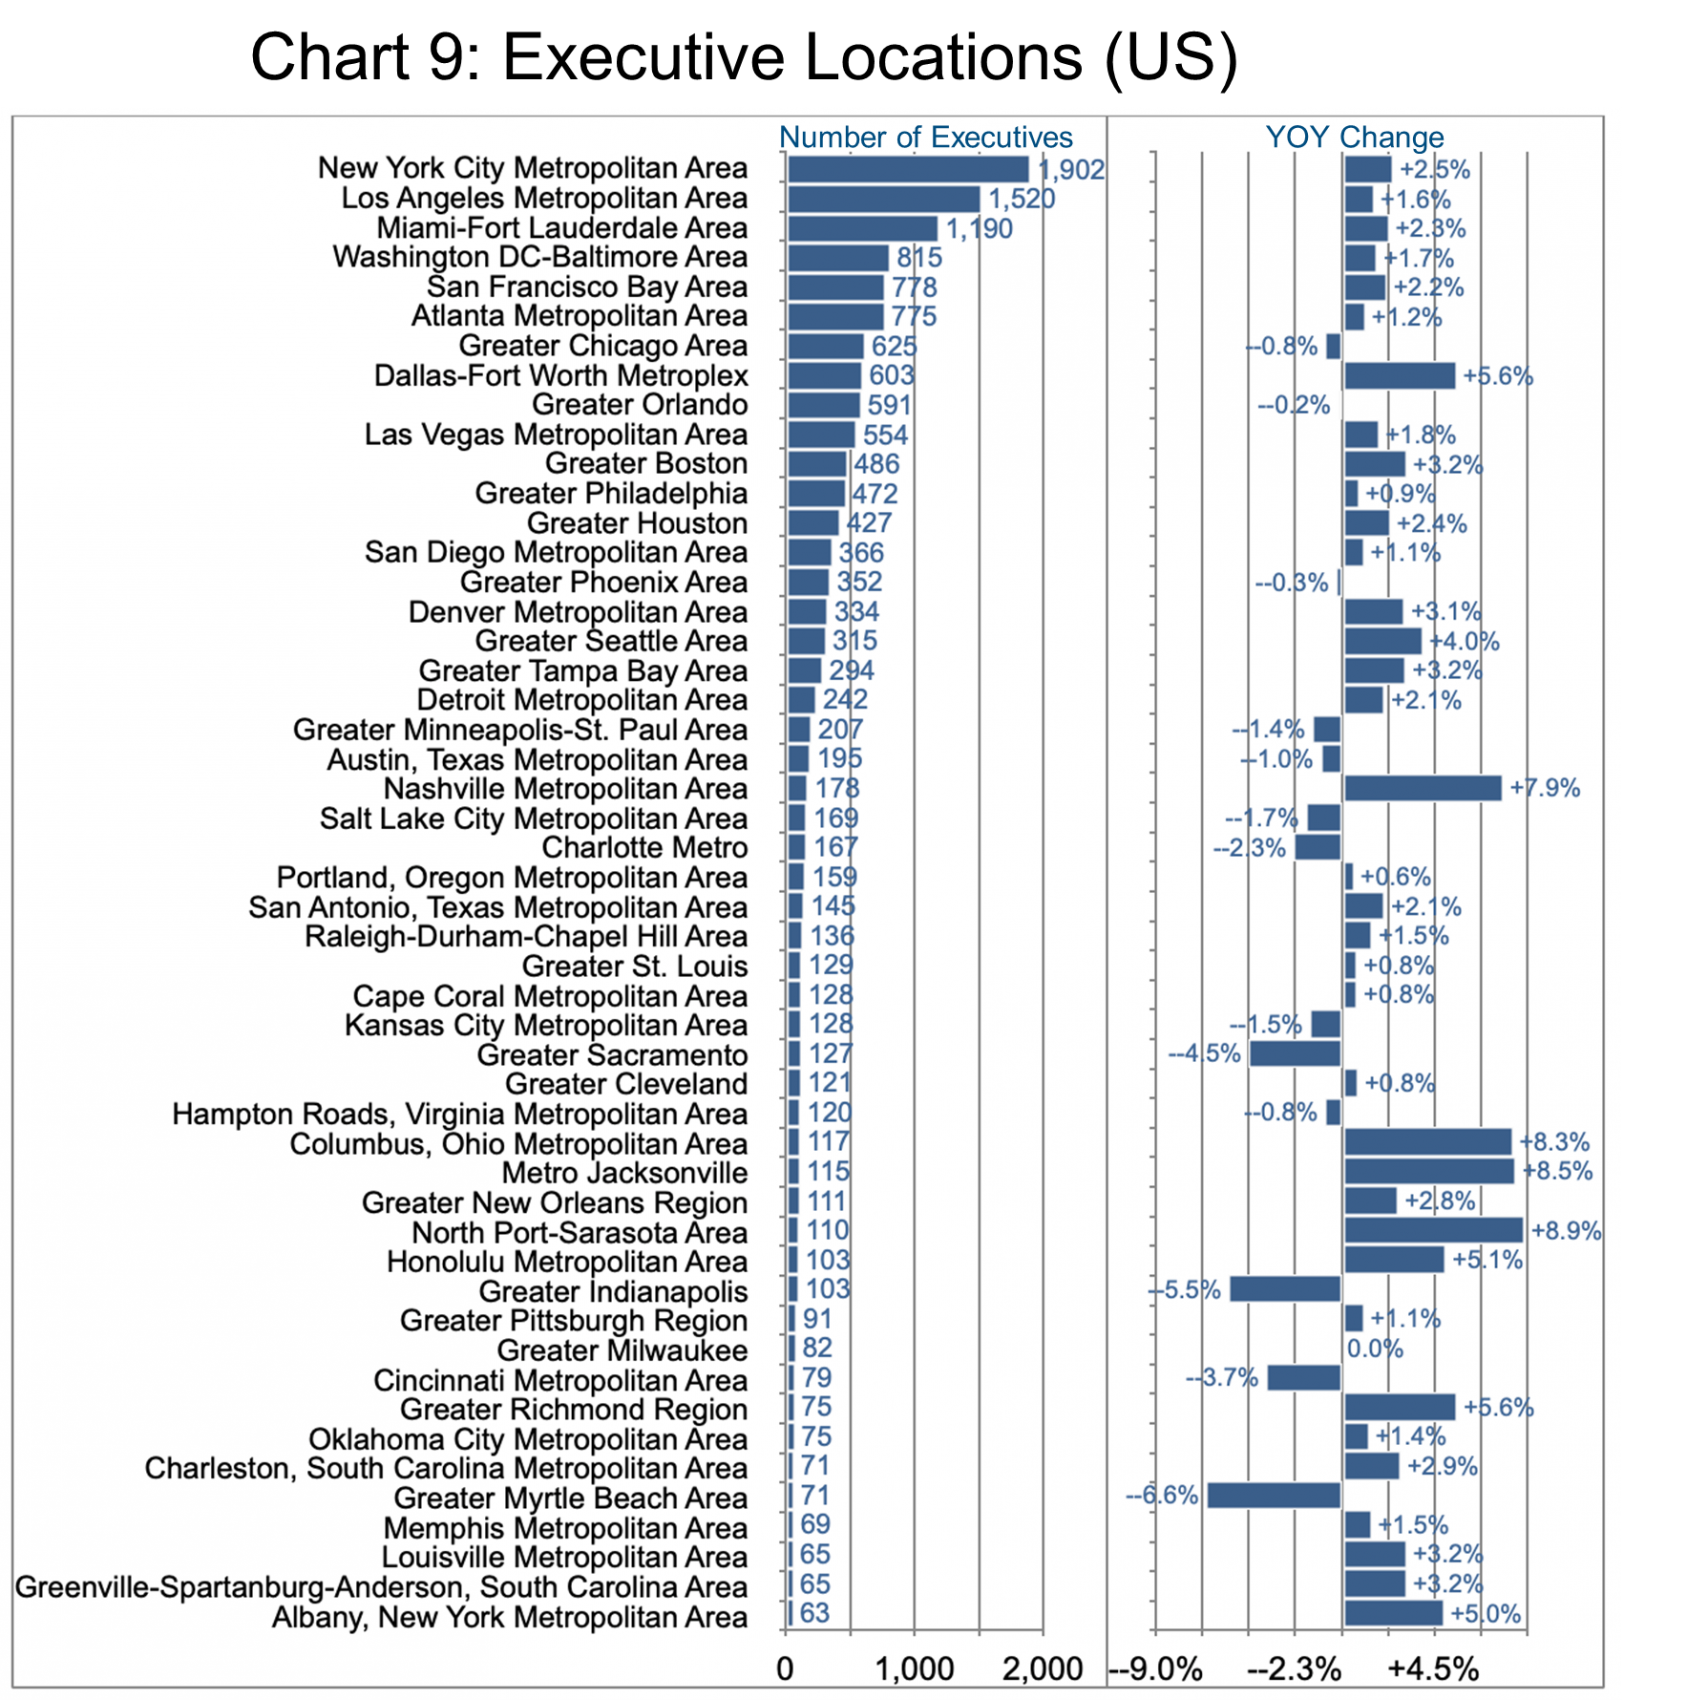
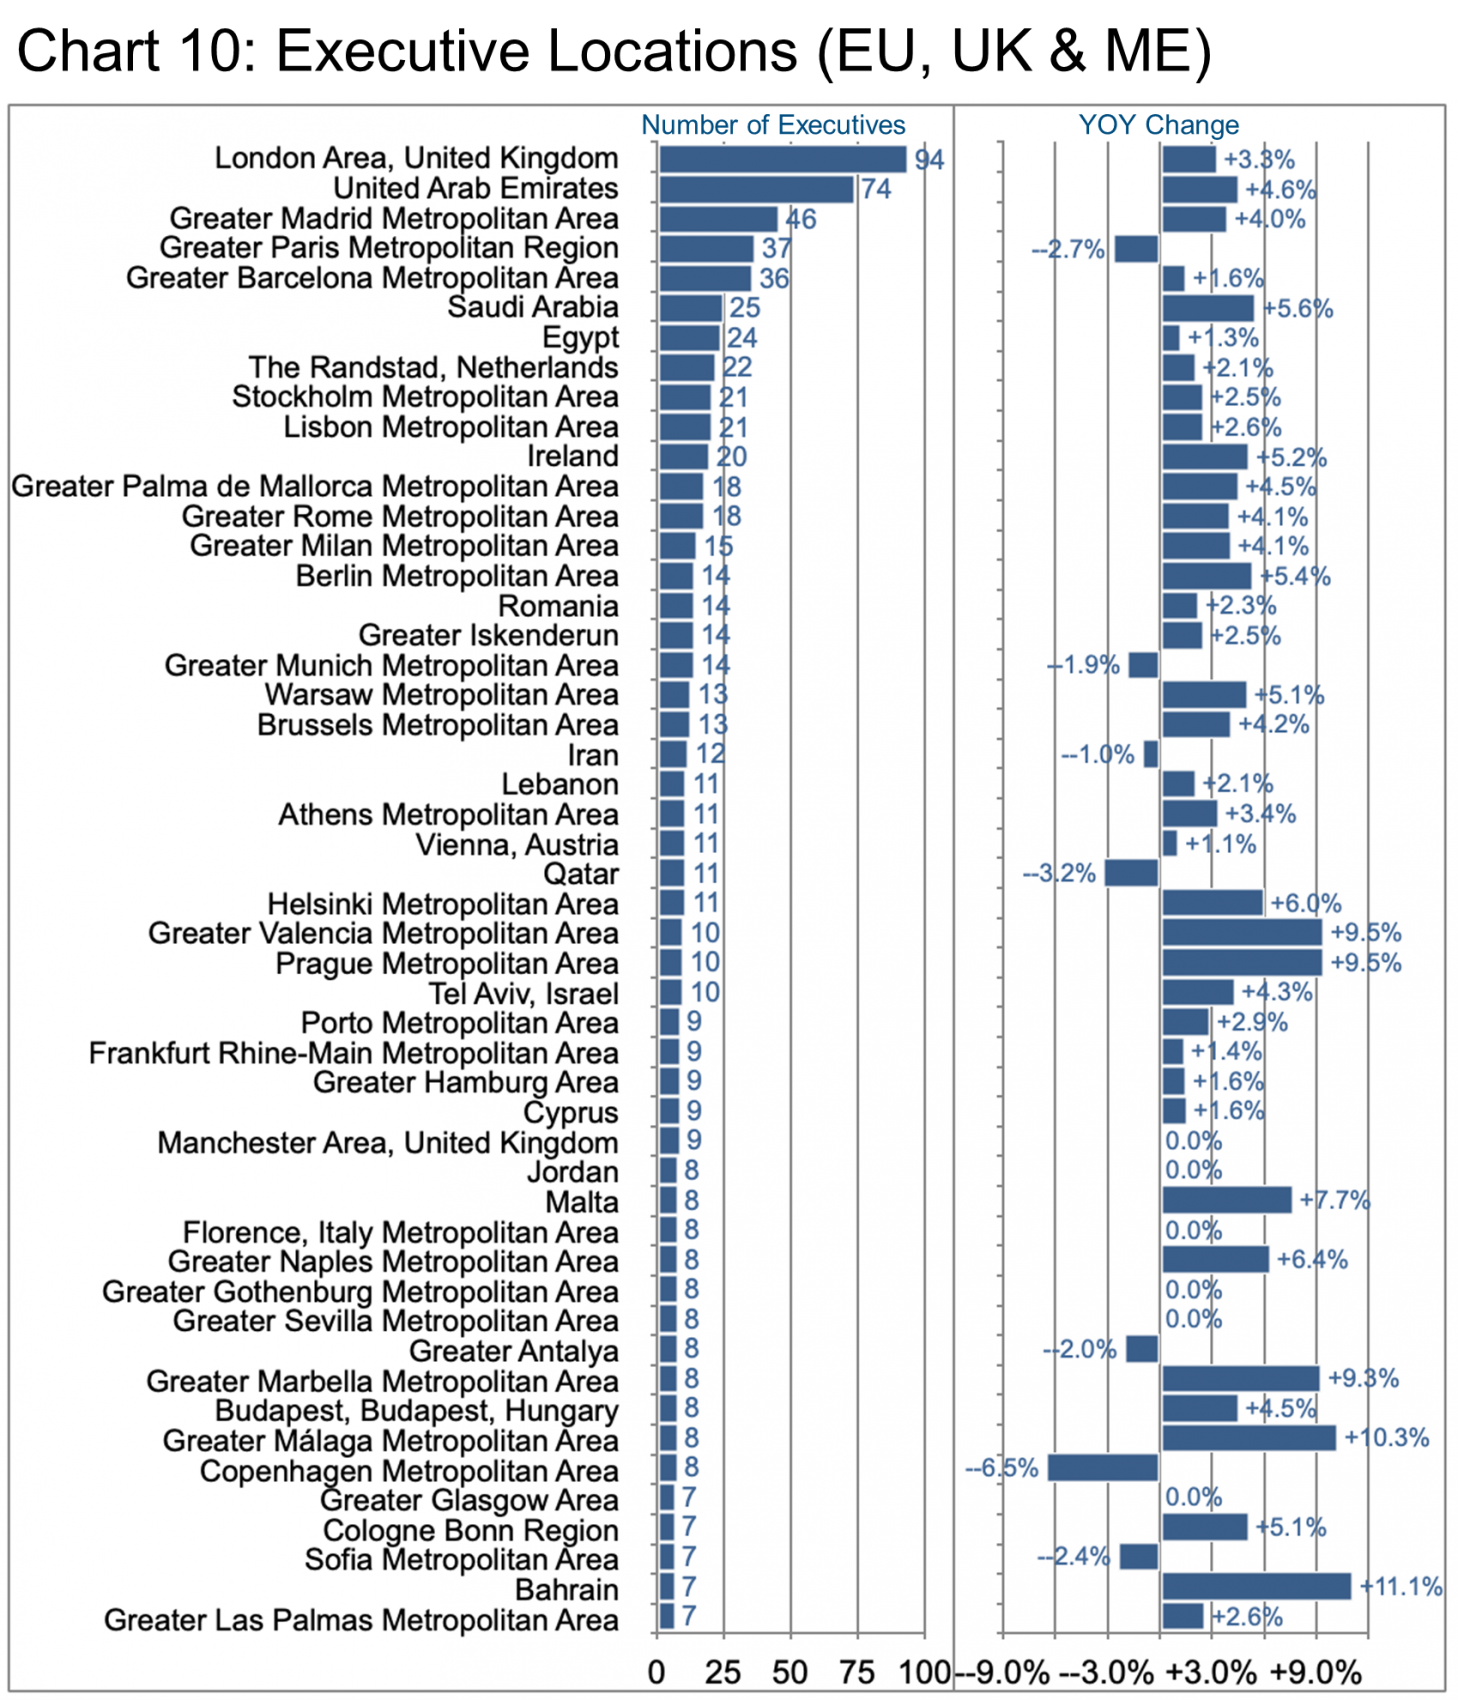
As we mentioned in the introduction, the Middle East is demonstrating heady growth as the region builds more and more hotels. So it is no surprise that the UAE shows up high on the list of executive locations. Demand in Spanish locations (Valencia, Malaga, and Marbella) is also growing fast. This is the case in Bahrain, Prague, Malta, and Naples.
Peter Irish, CEO The Barrett Group
Click here to download a printable version: Industry Update – Hospitality
Editor Note:
In this Industry Update “executives” will generally refer to the CEO, CFO, COO, CTO, CIO, CMO, and Vice President titles only. Unless otherwise noted, the data in this Update will largely come from LinkedIn and represents a snapshot of the market as it was at the time of the research. Is LinkedIn truly representative? Here’s a little data: LinkedIn has approximately 722 million users, 174 million in the US, and 163 million in Europe. (See Source) It is by far the largest and most robust business database in the world, now in its 18th year. LinkedIn defines the year-over-year change (YOY Change) as the change in the number of professionals divided by the count as of last year. “Attrition” is defined as the departures in the last 12 months divided by the average headcount over the last year.


