
Private Money In Your Future – Who’s Who and What’s What
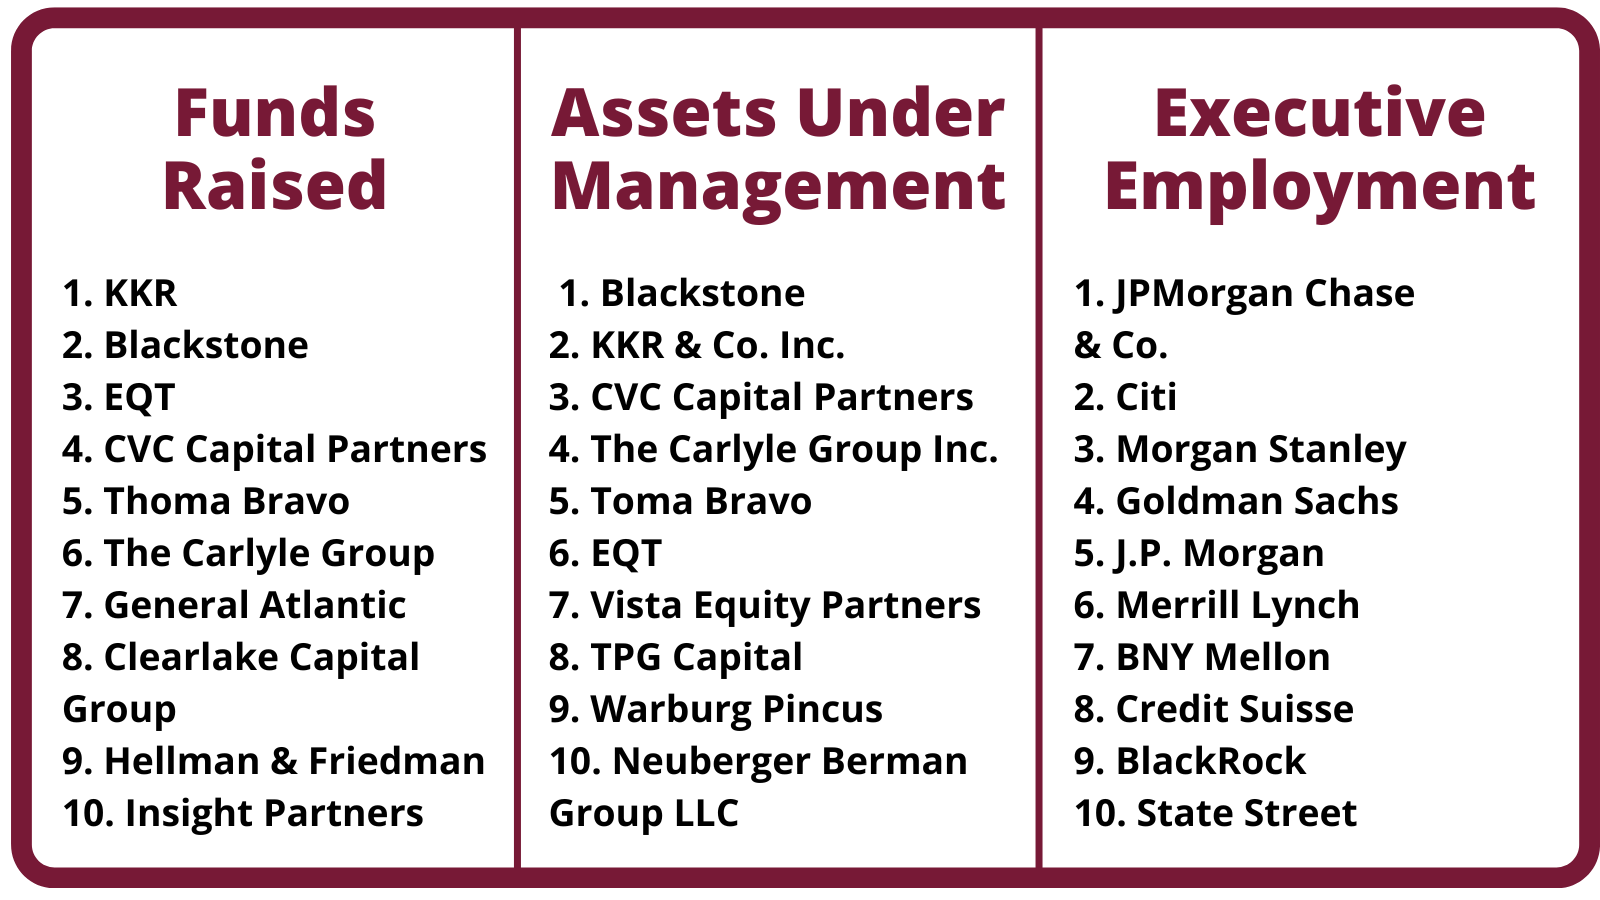
Frankly, not everyone can work for the biggest players in the PE/VC industry, nor is that particularly advantageous career-wise, however, let us get our bearings by looking at three different ways of ranking the top companies in this field before we look under the hood: 1) funds raised, 2) assets under management, and 3) executives employed.
Private Equity International publishes a helpful PEI 300 report that ranks companies based on capital raised—beginning at the $1.85 billion mark. The top ten firms raised almost $550 billion in new capital in the latest year. The top two alone managed more than $200 billion. (See table below.)
Alternatively, choosing the assets under management approach, we have a slightly different ranking whose top ten manage some $2.656 trillion in assets. (2021 Data. See source.)
Choosing only executives as we define them (see Editor’s Note) and those who identify themselves as being in the PE/VC industry, we derive the Executive Employment ranking below as of October 2022. These ten firms employ some 68,500 executives in this field, a total that grew by about 5.8% over the last year—excluding employment at portfolio companies.
It is therefore important to bear in mind that raising funds or managing assets does not necessarily correlate with the number of executives employed. Furthermore, much of the executive opportunity in this area is not in the PE companies at all but in their portfolio companies. Let us examine this subject in a little more detail.
To begin, we will choose a representative company from the top of the rankings, for example, Blackstone.
Blackstone highlights currently a number of portfolio companies on their website as follow:
- Candle Media (entertainment, Los Angeles) – C/VP level, 3*
- Transmission Developers Inc. (renewables & environment, New York) – C/VP level, 3*
- Ancestry (consumer, Lehi, Utah) – C/VP level, 7*
- Refinitiv (financial services, London) – C/GC level, 3*
- Bumble (internet, Austin) – C/GC level, 3*
- ServPro (building repair, Gallatin, Tennessee) – C/VP level, 5
*executive number according to LinkedIn
This sample serves to illustrate the breadth of the opportunity at the portfolio company level. Blackstone, by the way, says it encompasses more than 200 portfolio companies and half a million employees. To quantify the executive opportunity then in these portfolio companies, let us take the companies highlighted above as a baseline, which, on average, boasted 9 senior executives. Then the at least 200 portfolio companies Blackstone has invested in may employ up to 1,800 executive positions.
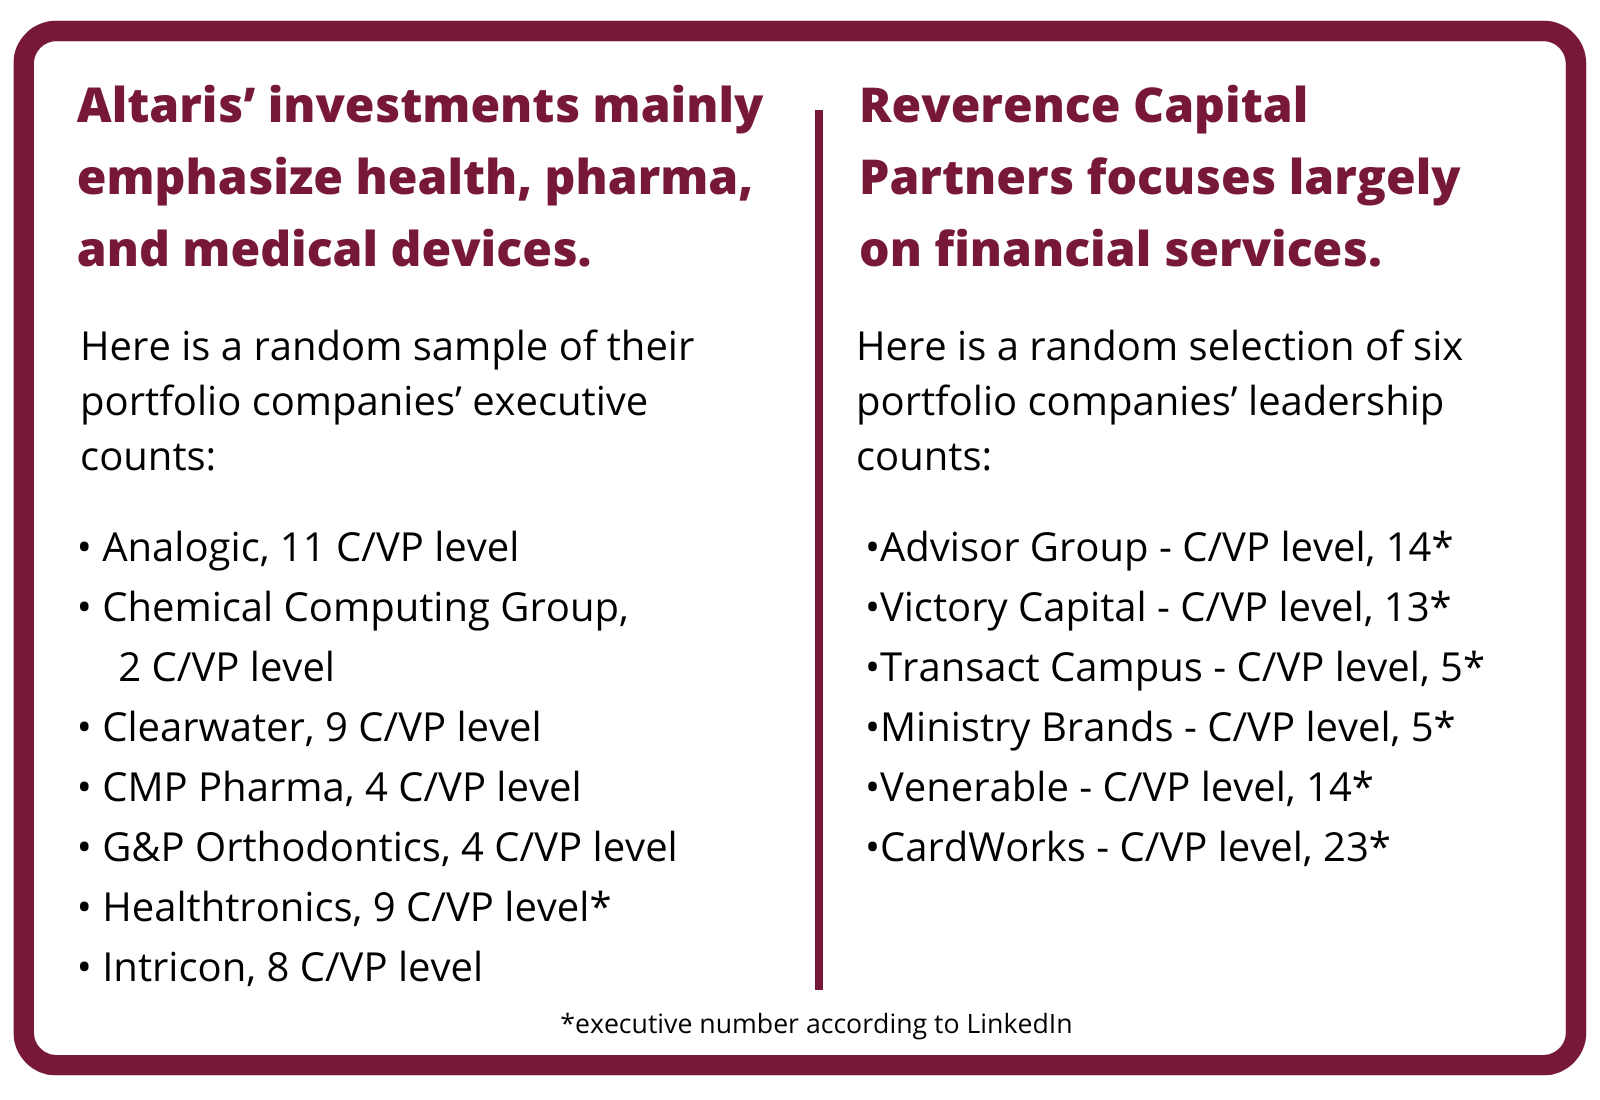
To discover whether this is a typical management team average size for a PE portfolio company, let’s look now at the middle of the ranking, for example Altaris Capital Partners (PEI #149) with 14 listed portfolio companies and then the other end of the spectrum (PEI #300), Reverence Capital Partners that listed 13 portfolio companies at the time of this publication.
So, the larger PE firms have hundreds of portfolio companies and the smaller ones perhaps 10 or 15.
If we average these to a conservative mid-point, say, 25 portfolio companies multiplied by the average number of executive roles (let us choose 10 as a simple assumption), we arrive at approximately 75,000 executive positions. Keep in mind this covers only the top 300 PE companies who raised at least $1.85 billion in the past year. The total number of executives at PE portfolio companies could well be 3 or 4 times that assumption—a huge population of executives probably with a normal turnover and a faster-than-average growth rate.
As will also be obvious from the examples above, portfolio companies vary not only in size and scale as well as geography, but also in industrial focus. Some PE funds focus in specific industry verticals such as Altaris Capital’s focus on health care and related industries, while others are generalists. Additionally, stage of development is key as VCs tend to focus on start-ups while PEs often focus on existing companies, funding buyouts, for example, or other structural changes.
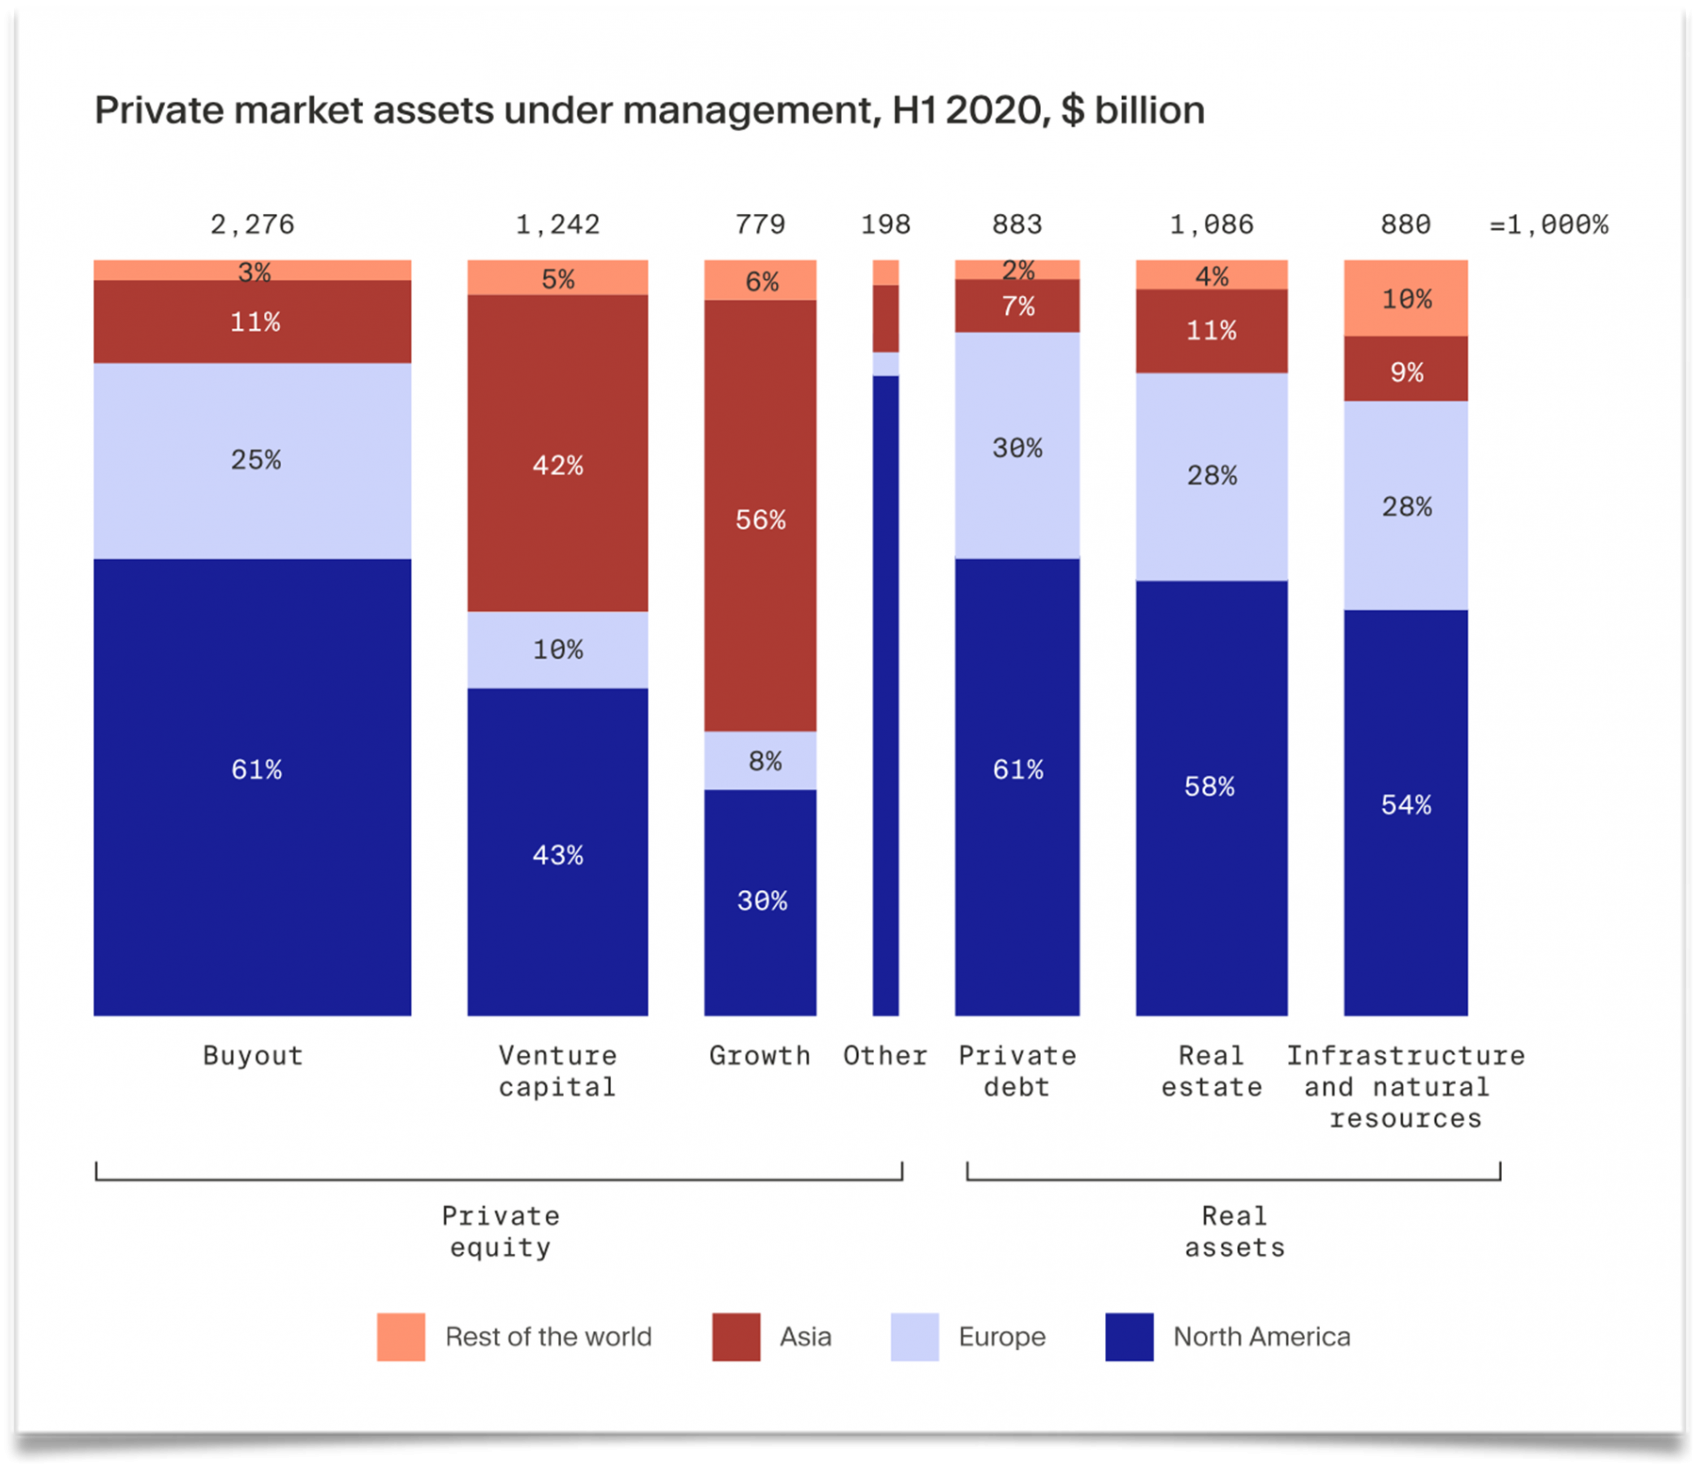
How are all of the funds invested in PE actually being used, readers might ask perhaps as a prelude to choosing a potential employer at the PE firm or portfolio company level. To begin to answer this question we offer this excellent overview of where the assets under management were invested in 2020. (See graphic “Private market assets under management…”) While a bit cryptic, it does begin to peel back the layers on the geography of these investments and their general objective/focus. (See source.)
It is difficult to generalize about the investment strategies of the industry, because of the very specific objectives individual funds define that presumably drive their choice of portfolio companies. At a higher level, McKinsey highlighted the following general themes influencing PE investments at the end of 2021 (See source):
- Infrastructure (“more than roads and bridges”)
- Sustainability transition (“transforming unsustainable business models” and “decarbonizing”)
- Diversity (some progress at more junior levels but more work required)
- Digitization and analytics (“front and back office”)
As far as industries of focus are concerned, as of 2021, the top-ranking industries attracting PE investment included (See source):
- Software
- Manufacturing
- Healthcare
- Technology
- Food & Beverage
- Financial Services
- Digital
- Education
- Industrial Services
- E-Commerce
The same source also highlights some of the major PE firms investing in each of these industries, too.
If this is all beginning to sound complex, frankly, it is.
That is one of the reasons executives hire the Barrett Group—to gain access to the six-member team of professionals they can leverage to perform detailed research first at a broad industry level and then at a specific company or individual executive level, particularly to gather background on the hiring manager(s) they will encounter during candidate interview processes. The Barrett Group maintains subscriptions to multiple state-of-the-art databases that encompass literally hundreds of millions of executives.
For example, find out why our client Paul Cabellon who landed in 2022 at a PE-backed start-up firm says “I really wish I had known about The Barrett Group in week one of my job search. If I ever transition again, Barrett will be a part of that transition. Period!” [See source.]
Peter Irish, CEO
The Barrett Group
Editor’s Note:
In this particular monograph “executives” will generally refer to the Vice President, Senior Vice President, Chief Operating Officer, Chief Financial Officer, Managing Director, Chief Executive Officer, Chief Human Resources Officer, Chief Marketing Officer, Chief Information Officer, Managing Partner, General Counsel, Head, and President titles. Unless otherwise noted, the data in this Update will largely come from LinkedIn and represents a snapshot of the market as it was at the time of the research.
Is LinkedIn truly representative? Here’s a little data: LinkedIn has approximately 850 million users. (See source.) It is by far the largest and most robust business database in the world, now in its 19th year. LinkedIn defines the year-over-year change (YOY Change) as the change in the number of professionals divided by the count as of last year and “attrition” as the departures in the last 12 months divided by the average headcount over the last year.


