INDUSTRY UPDATE: Manufacturing – September 2022
Introduction
The US Bureau of Labor Statistics (BLS) reports that the overall manufacturing output in the US returned in Q2 2022 to the pre-Covid 19 peak of Q4 2018. (See Graphic below and Source).
Buttressing this generally positive result is further evidence that the number of “establishments” (essentially, businesses) also continues to grow as does the number with job gains while the number with job losses continues to shrink. (See Source).
Of course, this picture varies by industry and location. We will address that shortly.
Still, it seems safe to say that for the moment, the US is out of the woods, so to speak.

Europe may yet face a harsher test due to the energy bottlenecks confronting governments, industry, and consumers alike, but as of June, the picture still looked pretty much like a recovery (See Graphic and Source).
However, every crisis carries the seeds of new opportunity, and environment-related businesses—including energy production, storage and transmission—are receiving vast capital in-flows, so we expect this surge of investment will also help Europe cope with the constraints in due course. (Read more.)

Manufacturing Executives
More than 1 million executives as we define them (see Editor’s Note) work in the manufacturing sector in our area of geographic focus (the US, EU, UK, and Middle East). This total grew by about 7,000 (+0.7%) and almost 37,000 of them changed jobs over the last year. This sector remains predominantly male (83%), offers a medium tenure of 3.4 years, and is characterized by LinkedIn as having a “High” hiring demand.
Approximately 340,000 of these executives are in the EU, UK, and Middle East, a population that grew by about 1%. Additionally, more than 15,000 changed jobs, bringing the total new career opportunities in this sector in the last year to more than 18,000. In the US, this sector comprises almost 700,000 having grown by about 0.5%, and a further 21,400 changed jobs, meaning there were about 25,000 new executive opportunities in the past year.

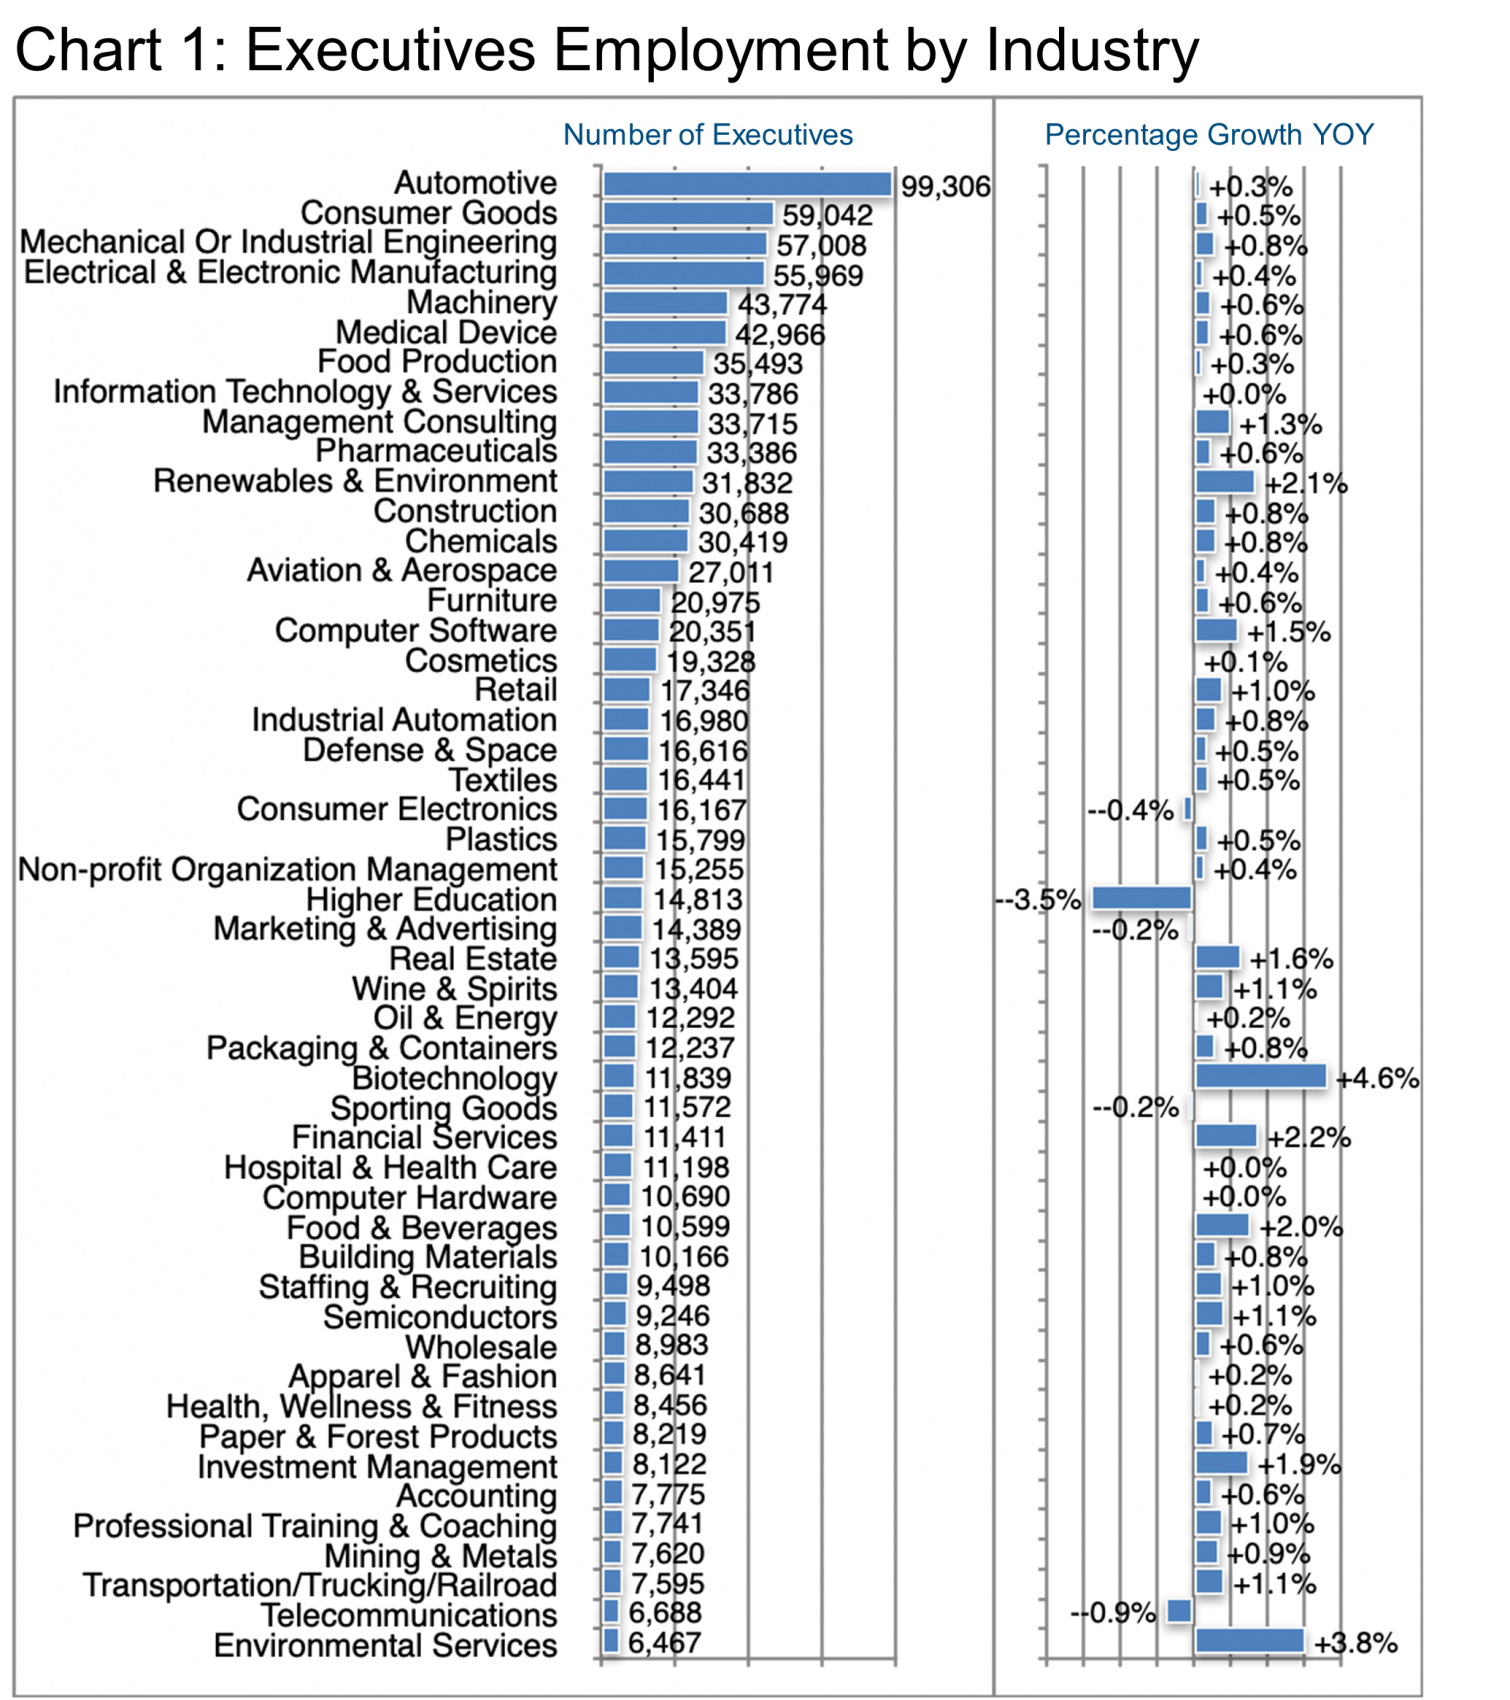
Chart 1 describes the industries that employ these executives. Clearly the automotive subsector is by far the largest but is also growing very slowly, as are the other four in the top five by number of executives employed (Consumer Goods, Mechanical/Industrial Engineering, Electrical & Electronic Manufacturing, and Machinery). The leading companies by number of executives in the top five subsectors include Ford Motor Company, Procter & Gamble, Emerson, Schneider Electric, and Stanley Black & Decker, Inc.
On the high-growth end of the spectrum, Biotechnology (+4.6%), Environmental Services (+3.8%), Financial Services (+2.2%), Renewable & Environment (+2.1%), and Food & Beverages (+2%) all stand out as having relatively strong executive hiring trends. In descending order the leading companies in terms of the number of executives in each of these high-growth segments include Novo Nordisk (Denmark), Mann+Hummel (Germany), Truist (North Carolina, US), Vestas (Denmark), Flowers Foods & Subsidiaries (Georgia, US).

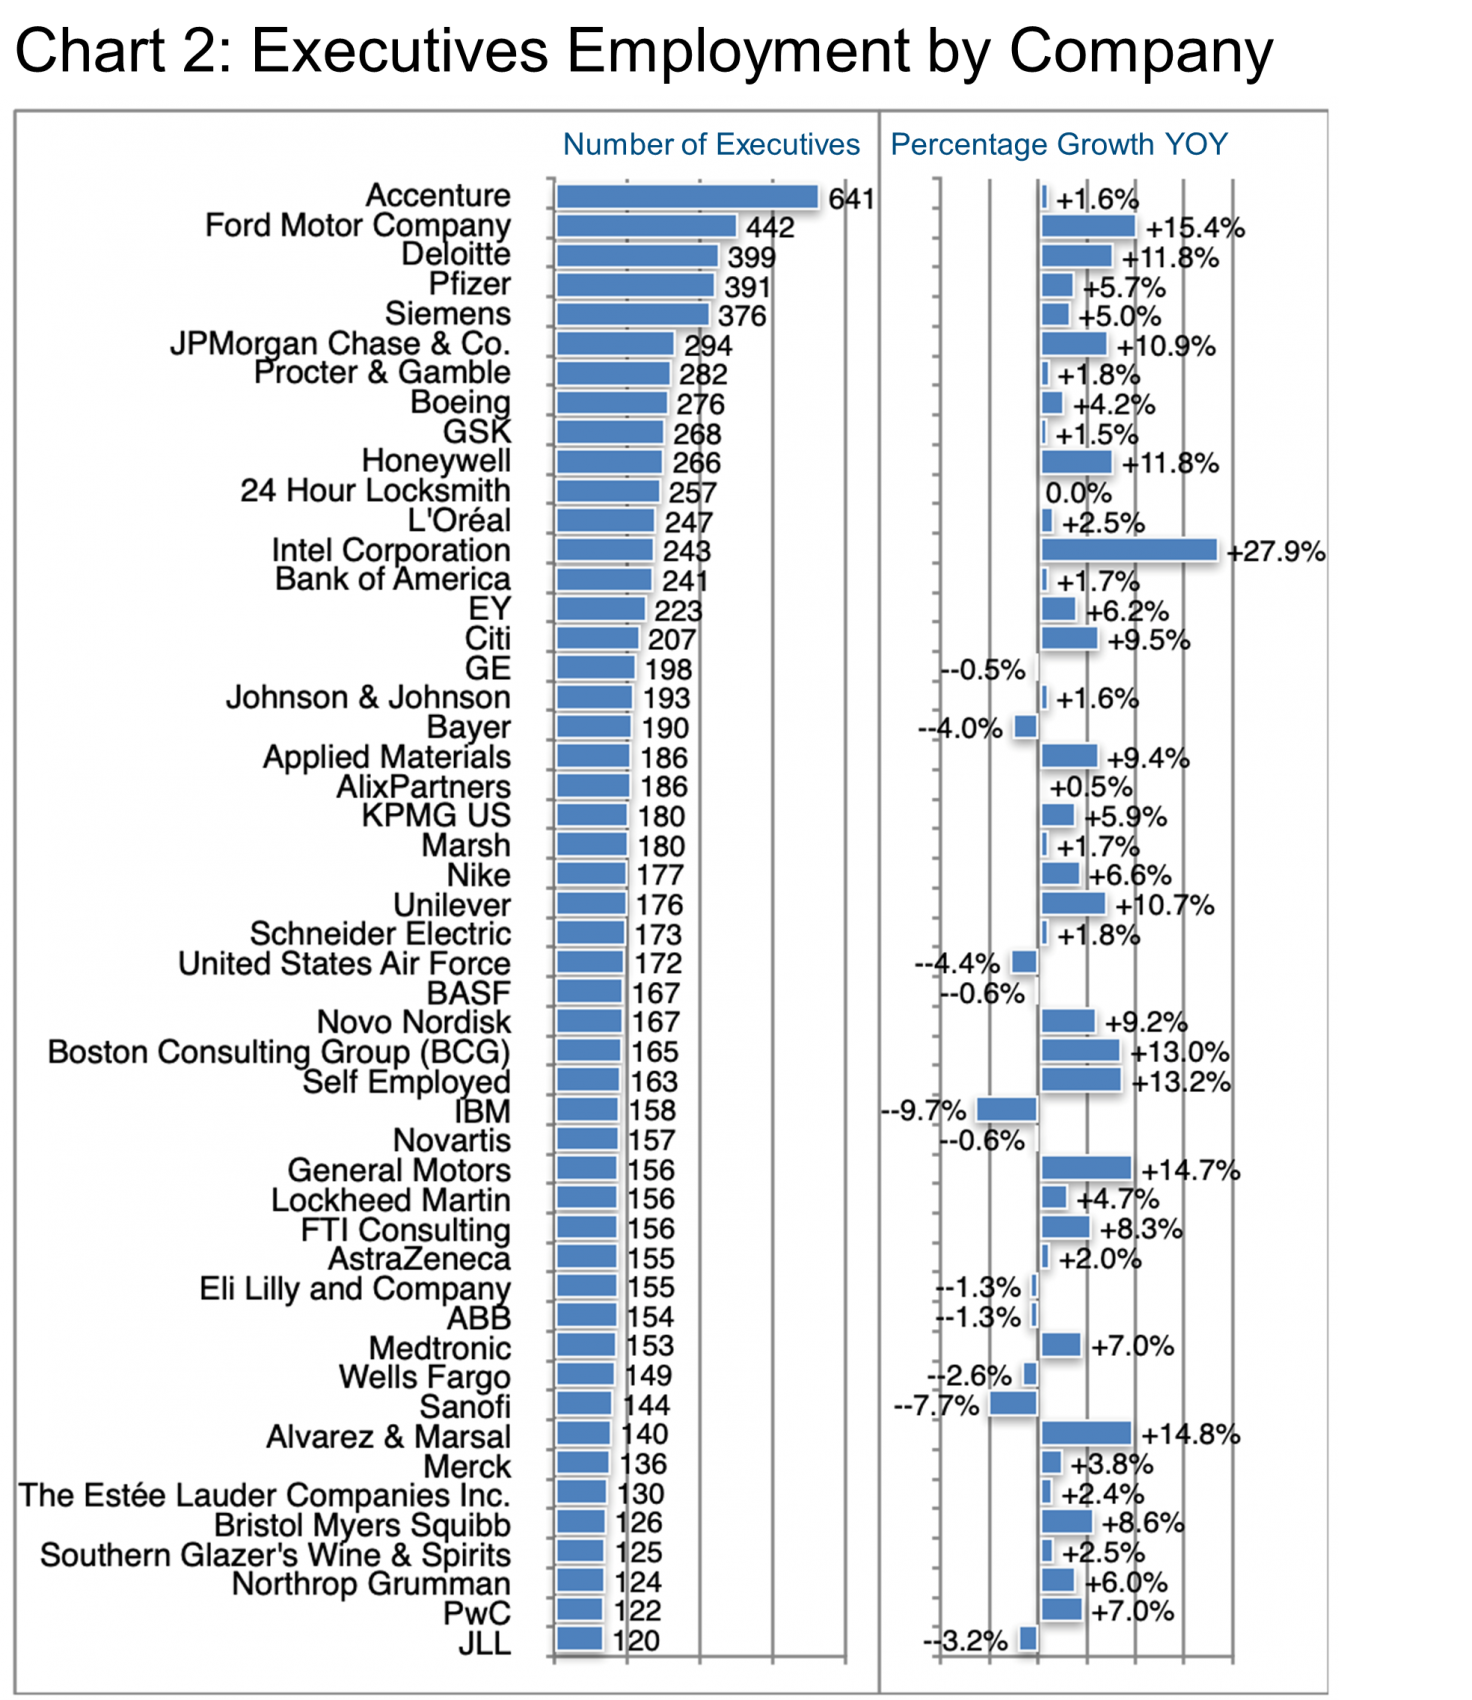
More generally, Chart 2 contains the top fifty companies employing manufacturing executives, and clearly these cover a huge swath of industries as evidenced by the top ten:

That Ford Motor Company with only 442 executives ranks so highly in an industry that employs almost 100,000 execs suggests how broadly distributed those executives most be, spread as they are across primary automobile manufacturers and their entire supply chains.
Of course, the growth of the executive ranks corresponds to some extent to the fortunes of the underlying industrial segment, but also to the strategies and performance of the companies themselves. Intel stands out as having hired 27.9% more execs recently as the company attempts to claw back market share from others in their core industry. Most of the car companies are in a hiring mode, too, perhaps as they respond to the pick up in vehicle demand that followed the Covid 19 trough. But the results are quite mixed for the pharmaceutical industry, for example, with Novo Nordisk (+9.2%), Bristol Myers Squibb (+8.6%), and Pfizer (+5.7%) actively hiring while Novartis (-0.6%), Eli Lilly and Company (-1.3%), and Sanofi (-7.7%) doing the opposite.
To peel back a layer or two on the companies who have been most active, let’s look at where Intel is recruiting its new hires, and also losing talent on occasion. Frankly, here are relatively few surprises in this list containing as it does major semiconductor and chip manufacturers as well as software and hardware specialists:
- AMD
- Qualcomm
- Micron Technology
- Synopsys Inc.
- Microsoft
- Apple
- NVIDIA
Another net acquirer of executive talent during the period was Ford Motor Company (+15.4%) who hired significantly from these companies:
- Stellantis
- Cognizant
- General Motors
- Tata Consultancy Services
General Motors (+14.7%) hired from a similar list:
- Stellantis
- Ford Motor Company
- FCA Fiat Chrysler Automobiles (London)
- Amazon
- ZF Group (Germany)
- Magna International (Canada)
Another fast grower, though less well known, is Alvarez & Marsal (Management Consulting, New York, +14.8%) who acquired talent mainly from the following companies:
- EY
- Deloitte
- PWC
- KPMG

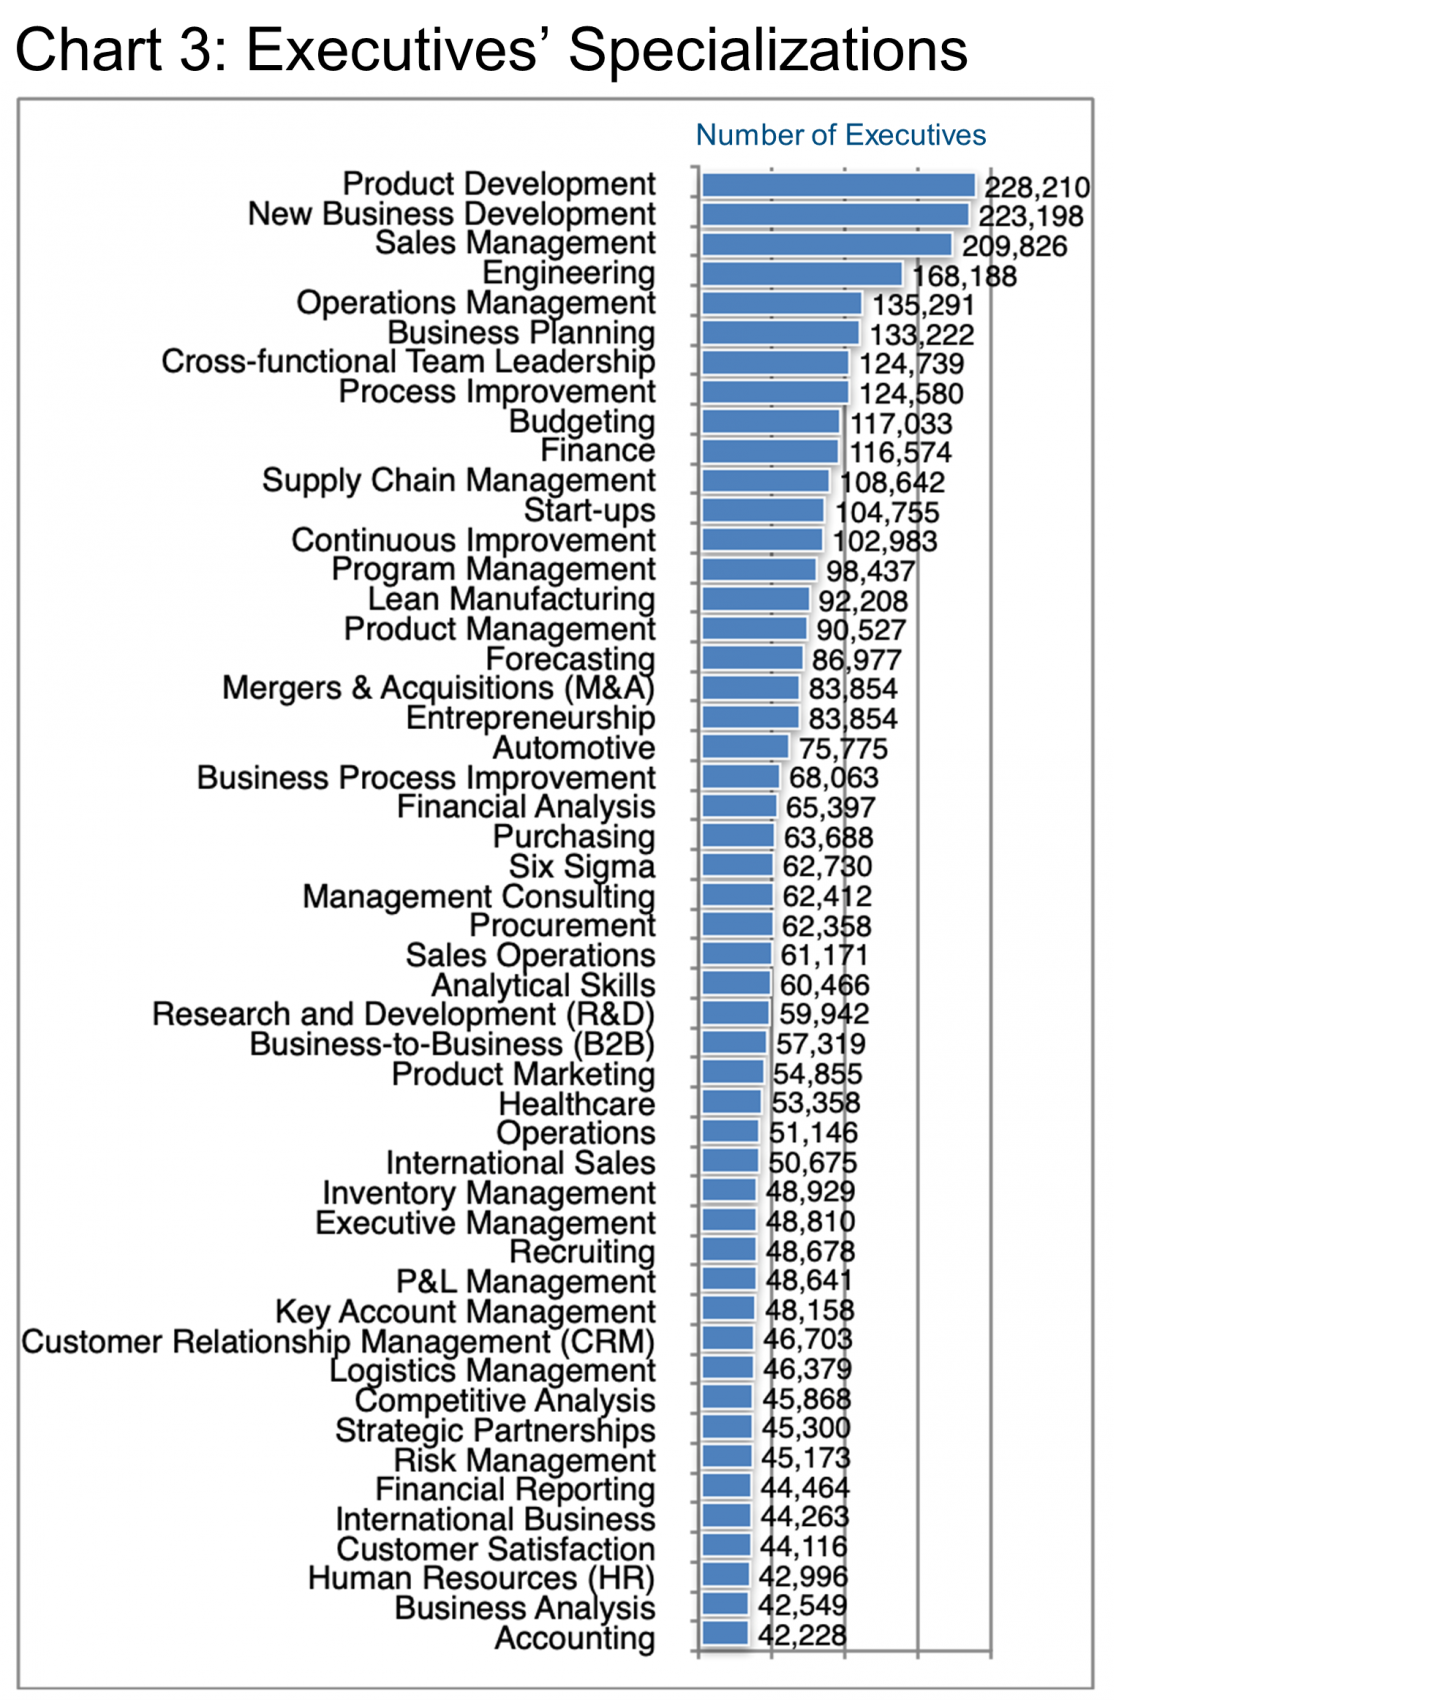
Chart 3 offers an overview of the major specializations manufacturing executives have cited in their LinkedIn profiles, though it is important to note that most executives will have more than one specialization listed. Not surprising is the high rank of New Business Development and Sales Management, two skills that virtually always rank high in these lists regardless of industry.
While some of these specializations are relatively unique to manufacturing, notably Supply Chain Management or Six Sigma, most seem quite transferable from other industries, a perspective borne out in our review of skills transferability earlier in 2022 (See source), whereby manufacturing demonstrates the broadest transferability (into or out of the industry) of any of the specializations we studied.

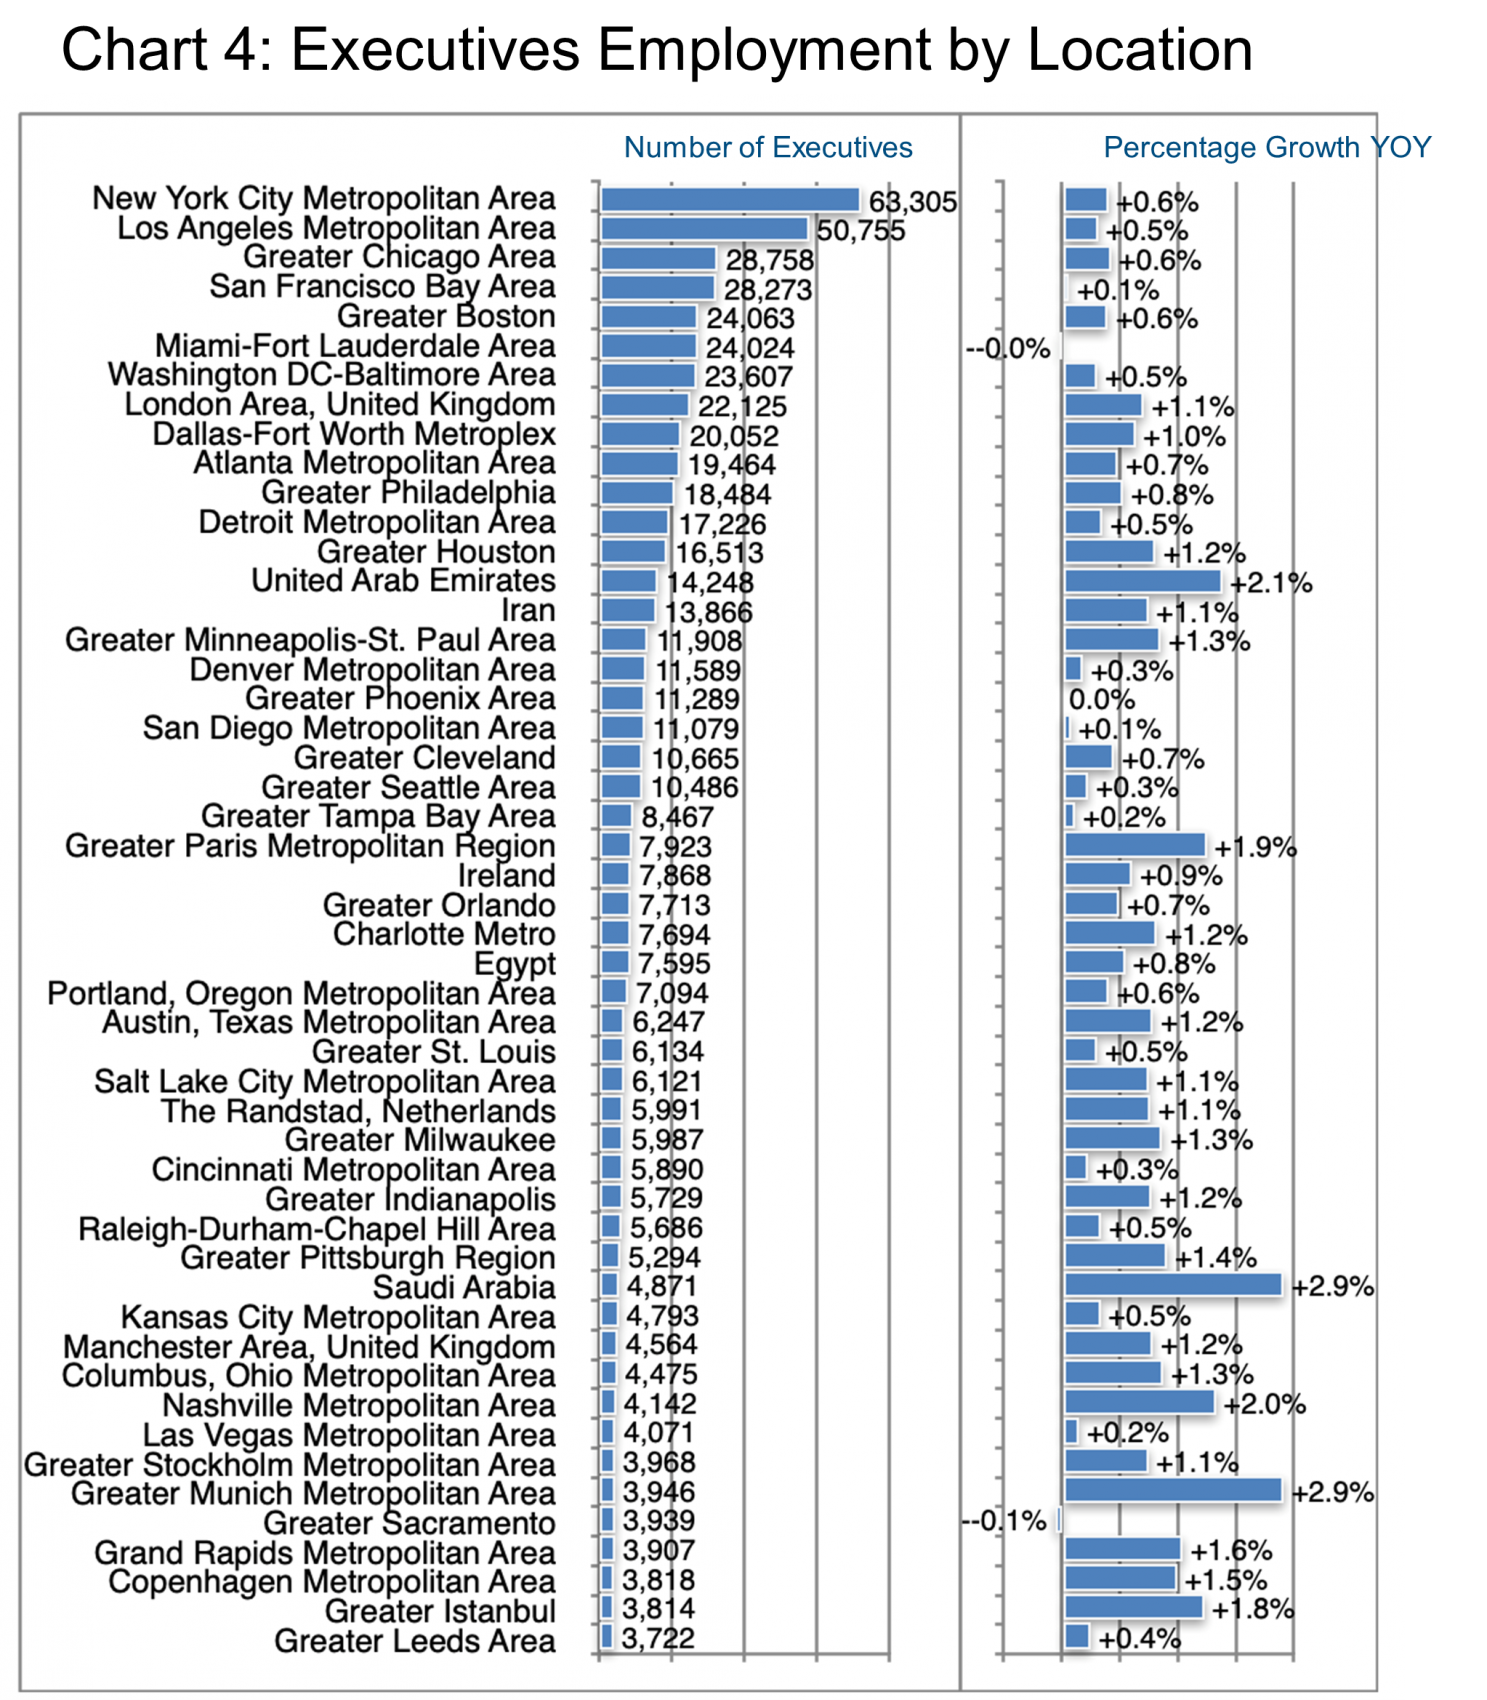
Lastly, Chart 4 outlines the top locations of these executive positions. To find a large pool of manufacturing executives, in the US you need look no farther than the usual suspects, i.e., New York, Los Angeles, Chicago, San Francisco, Boston, Miami-Fort Lauderdale, and Washington DC that collectively boast about 40% of the US-based manufacturing executive population. Typically, size and growth correspond negatively and that is true in this grouping as the largest populations grew more slowly while Houston, Minneapolis, Charlotte, Austin, Salt Lake City, Milwaukee, Pittsburgh, Columbus, Nashville, and Grand Rapids all show better than 1% growth year on year.
In the EU, UK, and Middle East cohort, the UAE, Saudi Arabia, and Munich all show more than 2% annual growth while Paris comes in close at 1.9%.

Peter Irish CEO The Barrett Group
Click here to download a printable version: Industry Update – Manufacturing 2022
Editor’s Note:
In this particular Update, “executives” will generally refer to the Vice President, Senior Vice President, Chief Operating Officer, Chief Financial Officer, Managing Director, Chief Executive Officer, Chief Human Resources Officer, Chief Marketing Officer, Chief Information Officer, Managing Partner, General Counsel, Head, and President titles. Unless otherwise noted, the data in this Update will largely come from LinkedIn and represents a snapshot of the market as it was at the time of the research.
Is LinkedIn truly representative? Here’s a little data: LinkedIn has approximately 850 million users. (See source.) It is by far the largest and most robust business database in the world, now in its 19th year. LinkedIn defines the year-over-year change (YOY Change) as the change in the number of professionals divided by the count as of last year and “attrition” as the departures in the last 12 months divided by the average headcount over the last year.