
INDUSTRY UPDATE: Construction & Real Estate – April 2022
Introduction
In this Update, we decided to marry two industries that are quite intertwined. We felt we could provide a better prospective on the total executive market in these sectors if we combined them. Nevertheless, at least at the outset, let us look into the major segments of Construction and Real Estate. And understand some of the underlying factors driving demand.
In the US, conventional wisdom expected the housing market to cool off a bit in 2022. Here’s what Fortune has to say about the current state of play:
“Entering into 2022, the consensus among much of the real estate industry was that the spring housing market—the industry’s peak season—would be a bit less frenzied this year. After all, it couldn’t get much worse than the 2021 spring housing market, when over 70% of home listings saw a bidding war, right?”
“Unfortunately for would-be homebuyers, that conventional wisdom has shifted. Not only does the spring housing market look like it’ll be red-hot, there’s a chance this goes down as the hottest spring home-buying season ever. Already, bidding wars are picking up again.”
Apparently, there is simply a lack of residential inventory in the US. [See source.]
Europe shows a similar trend in the imbalance between supply and demand. But there is another factor apparently driving pricing in the European residential market. Daniela Gabor is a professor of economics and macro-finance at the University of the West of England. Sebastian Kohl is at Berlin’s Free University. Research carried out by Gabor and Kohl suggests that Europe’s housing has become an increasingly attractive “asset class” for investors. This is in part due to near-zero interest rates and an encouraging regulatory framework.
“European central bank data shows that real estate funds in the Eurozone reached €1tn in 2021, the size of Spain’s GDP, from about €350bn in 2010. Within that, residential assets are said to be an increasingly important part.” [See source.]
Another key factor is the shift that the pandemic has brought to the utilization of real estate for offices or hotels versus other uses.
“Institutions’ deployment patterns are shifting, with sector allocations moving away from traditional segments such as offices and retail, and toward emerging areas of focus, including rental housing, healthcare, student accommodation, and self-storage, which offer stable income streams. Capital market activity in 2020 across offices and retail [was] down 31% and 6% year-on-year, respectively, in stark contrast to the pan-European logistics space, which saw investment volumes up 14%. [See source.]
Construction also seems set for continued growth. One source highlighted an expected spending increase for construction in the US from $1.67 to $1.79 trillion between 2021 to 2023 (See source.) This increase is provided the industry can find the roughly 650,000 incremental employees required to support this increase.
While demand for residential housing remains high, there appear to be five major types of projects driving the demand on the commercial side of the construction industry in the US. These are distribution centers and warehouses, data centers, shipping ports, life sciences, and state and federal infrastructure. (See source.)
In Europe the trends are similar.
For example, we have this news coming out of Germany: “Financial figures from the [construction] associations indicate that a high order backlog in 2021 means that sales will increase by 5.5% next year. [This is] significantly higher than the €143.5 billion achieved in 2021, which was only 0.5% up on 2020.”
“The growth projection is likely to be led by the strong performance of the country’s residential construction sector, which has remained resilient throughout the pandemic.” (See source.)
The Middle East (ME) is also expected to see an uptick in construction growth. This is powered perhaps by four major trends: large new commercial and residential projects, sustainable energy investments, growth in modular housing, and digitalization infrastructure. (See source.)
The ME market’s construction demand will therefore also most probably recover. For example, “…[the] construction industry in the United Arab Emirates is expected to grow by 6.8% to reach AED 245,982 million in 2022.” (See source.)
The Demand for Executives
In total some 917,000 executives as we define them (see Editor’s Note) worked in these industries in the latest period. This is an increase of just 1% year on year (YOY). Only about 2% changed jobs in the most recent months. This is a relatively low churn rate compared to other industries we have studied. Approximately one-third of these are located in the EU, UK, and ME markets. They are a pool that grew by 2% in the last year. This is while the remaining roughly 600,000 worked in the US. The U.S. is a group that grew by just 0.8% YOY.
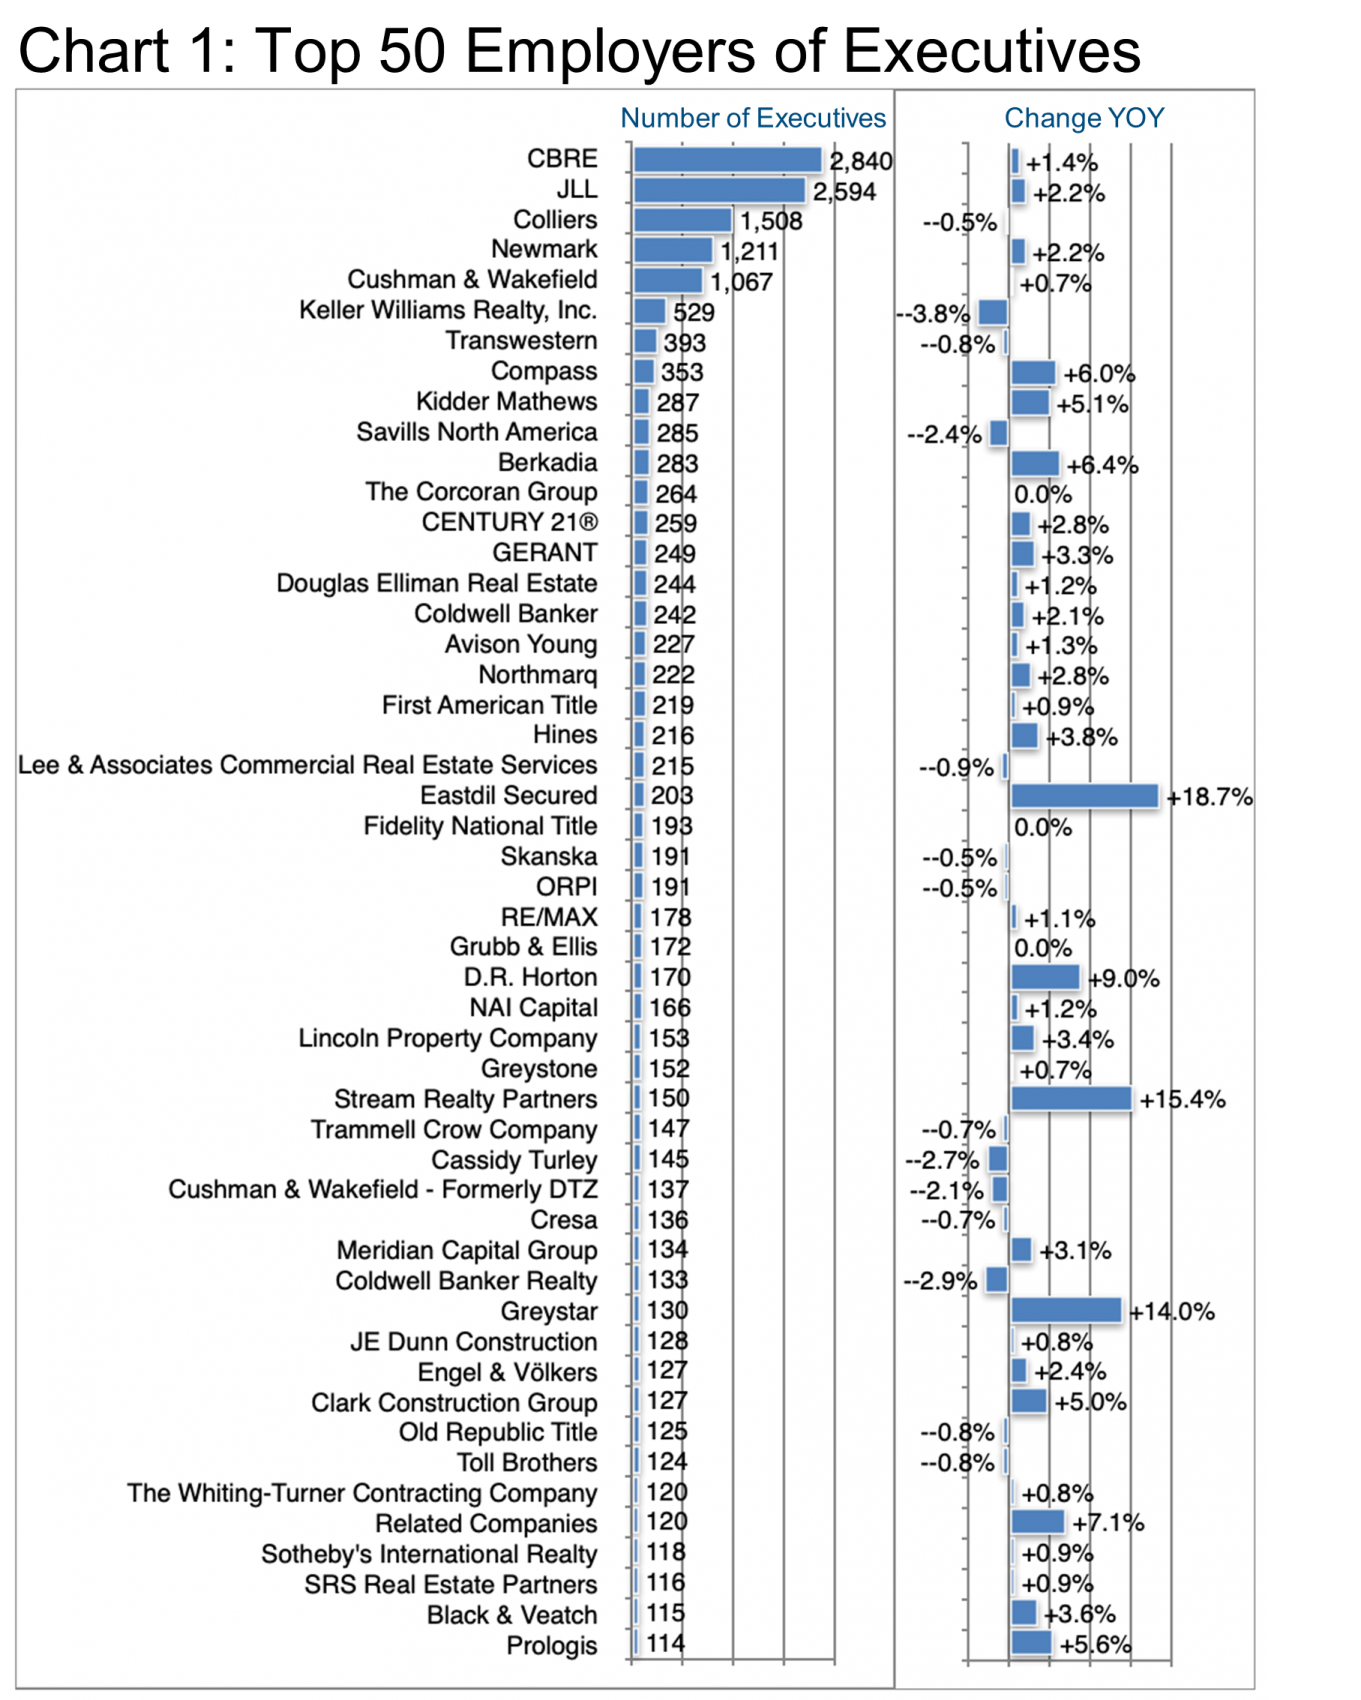
In the US, this cohort breaks down further into three major segments: about 341,000 in construction, 233,000 in (residential) Real Estate, and 31,270 in Commercial Real Estate. The latter shows the largest growth (+2%). D.R. Horton, Clark Construction Corp, and Black and Veatch are the largest employers of executives in the construction industry. While CBRE, JLL, and Newmark lead the general Real Estate area. Colliers, Cushman & Wakefield, and Transwestern represent the top tier in the Commercial Real Estate ranking.
In the EU, UK & ME cohort some 200,000 are active in construction (+1%). There’s 118,000 in (residential) Real Estate (+2%), and 10,000 in Commercial Real Estate (+2%). Skanska, Strabag, and Ance are the largest employers of executives in the construction segment. Gerant, ORPI, and JLL in the general Real Estate area. Colliers, Eastdil Secured, and Cushman & Wakefield employ the most executives in the Commercial Real Estate sector.
Overall it would seem that the transatlantic integration is most advanced in the Commercial Real Estate segment. Though in the sheer number of executives employed, CBRE, JLL, and Colliers lead the way. (See Chart 1.) Growth in executive employment, however, is a different story. Firms such as Eastdil Secured, Stream Realty Partners, and Greystar lead the pack. Eastdil Secured saw a spike in hiring and departures in June of 2021. They added staff from Wells Fargo, JLL, CBRE, SEO London, Newmark, KPMG, and Accenture (among others). Stream Realty has grown steadily during 2021 and into 2022. Stream Realty acquired talent mainly from JLL, Colliers, CBRE, Cushman & Wakefield, and Transwestern. Greystar had net talent gains from FPI Management, The Finger Companies, and Asset Living.
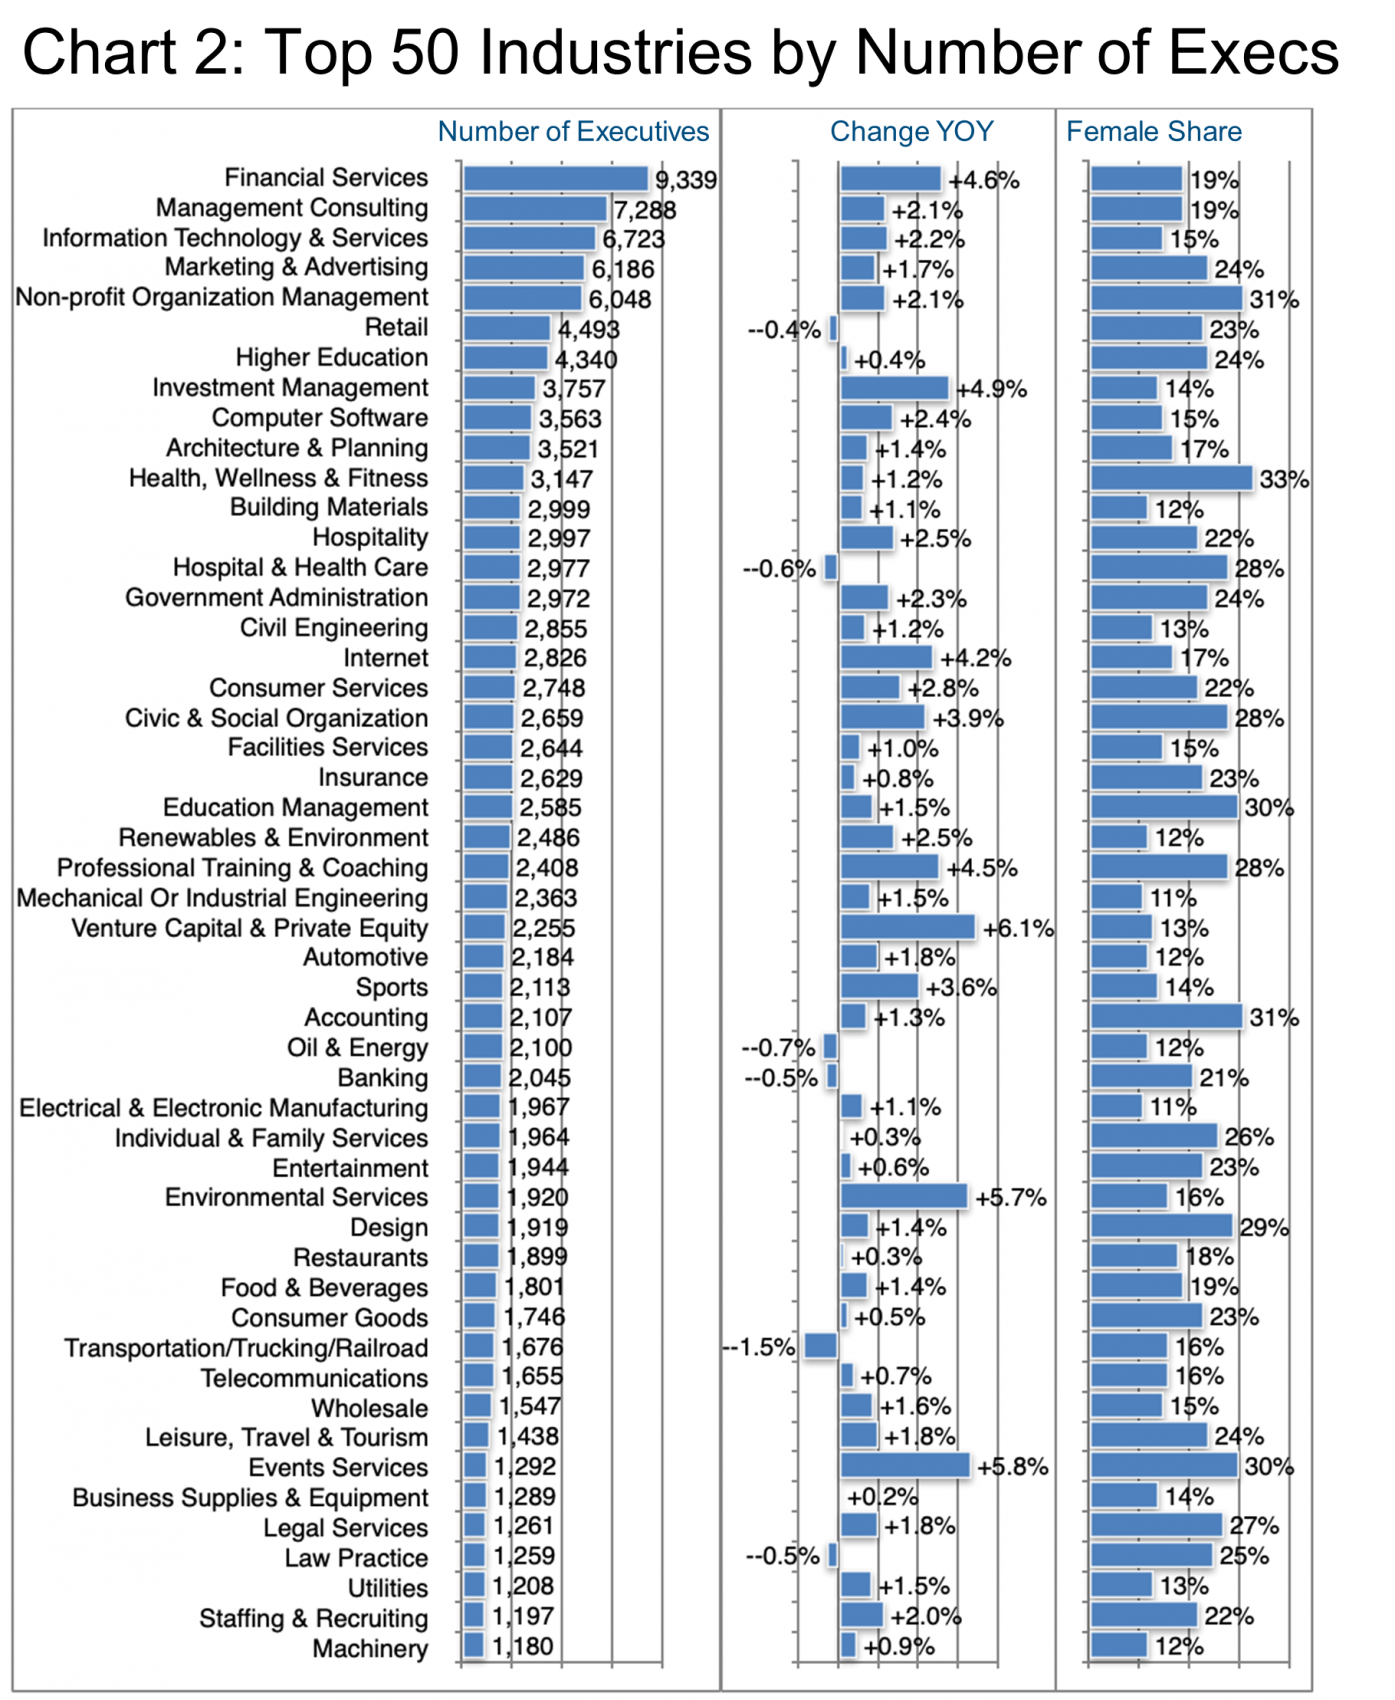
Within the overall industrial grouping of Construction and Real Estate, executives list a vast range of sub-industries that employ them. Chart 2 quantifies these industries. Financial Services is the largest. It is followed by Management Consulting, IT, Marketing & Advertising, and Non-profit Management as the top five.
Several segments have added executives in the last year at an above-average rate. These segments include Venture Capital & Private Equity (+6.1%), Events Services (+5.8%), Environmental Services (+5.7%), Investment Management (+4.9%), and Financial Services (+4.6%).
It is probably no surprise that the share of female executives in this industrial grouping is relatively low (just 17% overall). But there are pockets with higher ratios. Some are, for example, Health, Wellness & Fitness (33%), Non-profit Organization Management and Accounting (both 31%), Education Management and Event Services (both 30%), and Design (29%). Of course, recent corporate focus on diversity may actually lead to higher demand going forward. Let’s stay tuned.
There are 180,000 executives who cited Construction and/or Construction Management as their primary specialization. Aside from those 180,000, we find a rather broad spectrum of additional specializations within the Construction & Real Estate business area. These are highlighted in Chart 3.
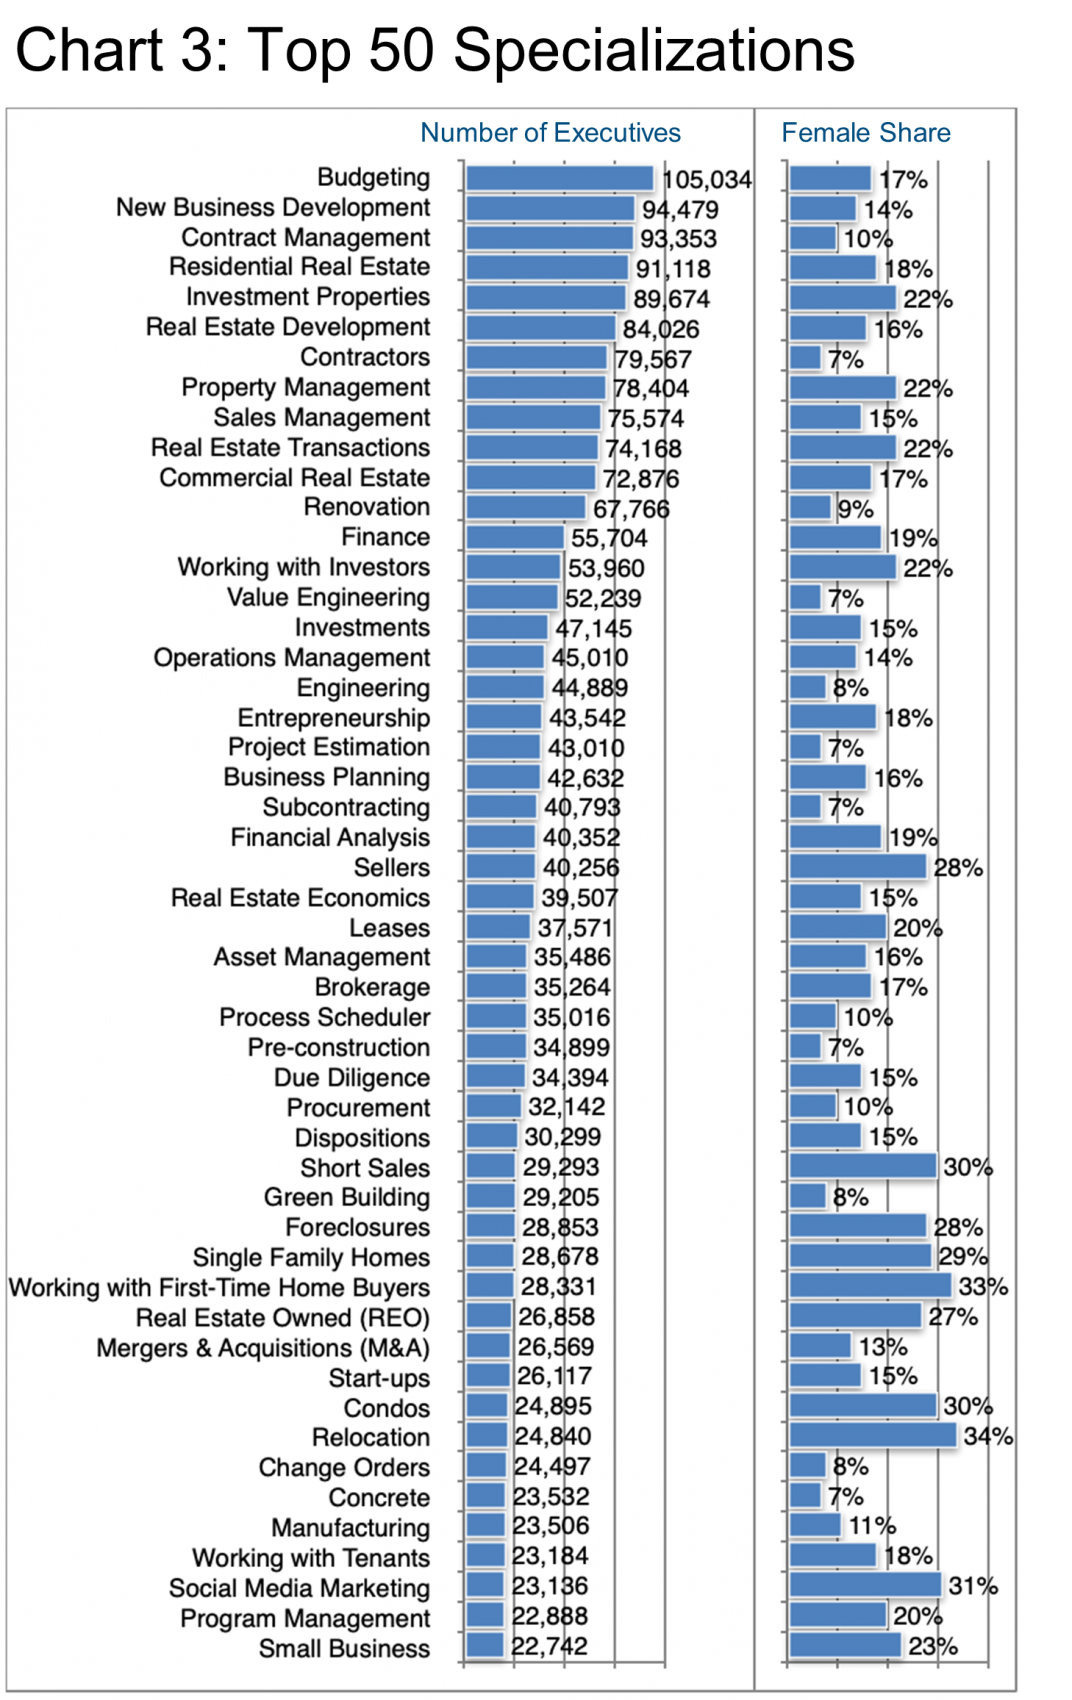
Obviously, some of these specializations are indeed particular to this industrial cohort such as expertise in Residential Real Estate, Real Estate Development, Commercial Real Estate, Renovation, Real Estate Economics, Green Building, and many more. Roughly speaking, about 40% of these executives have cited specializations specific to this industry grouping. That means, of course, that about 60% of these specializations are relatively generic and could represent an opportunity for executives who want to enter or leave this sector to demonstrate transferability of skills and thereby move laterally or vertically to another industry, role, company, and/or geography.
Editor’s note: The Barrett Group team are experts at helping our clients demonstrate the transferability of their skills and experience. Providing assistance in changing industry verticals is a major area of focus for us.
Returning to the subject of gender for a moment, let us highlight specializations that show a relatively high female share (Chart 3). It certainly seems that subjects involving higher emotional intelligence such as Working with First[1]Time Home Buyers, Relocation, and Social Media Marketing attract a higher share of female executives. However, there are other pockets where the reasons are less evident. These are such as Short Sales, Condos, and even Foreclosures. Again, it is certainly our belief that over time this broad industry will become more diverse in multiple ways, including an easing of the historical male gender bias so that growth in opportunity for women may well be disproportionately large in the coming years.
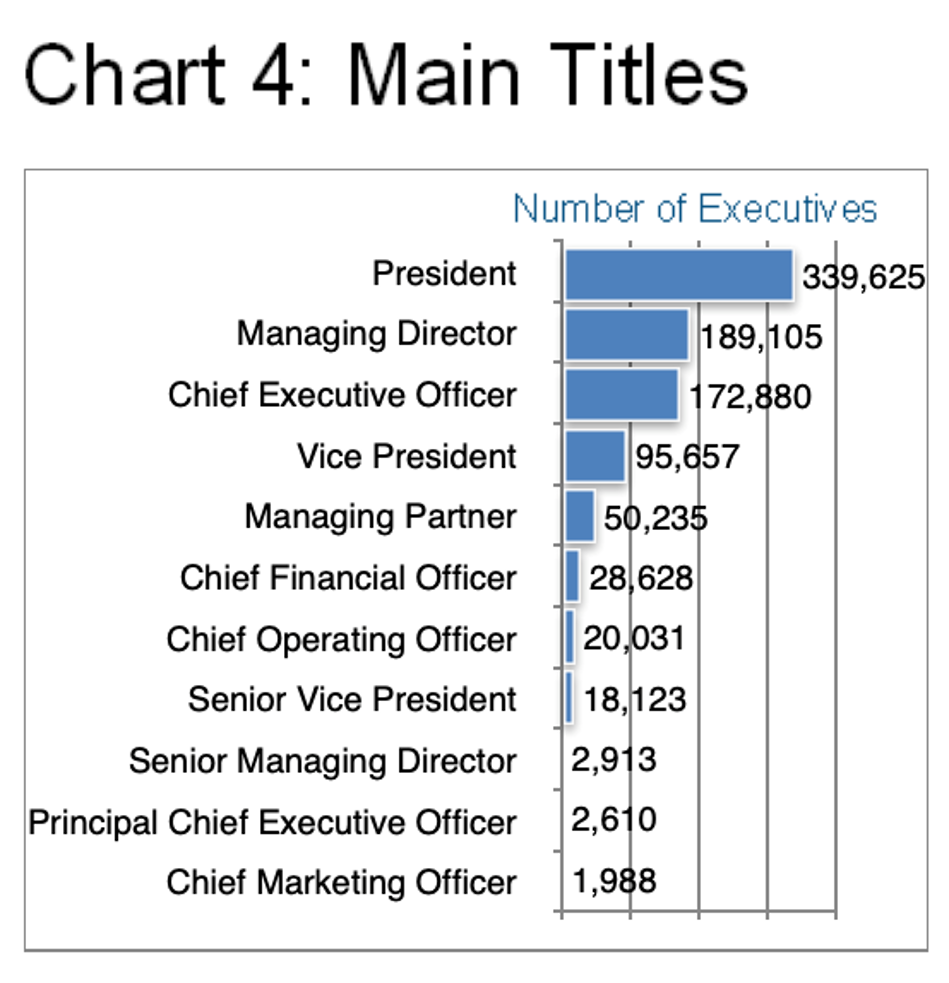
Chart 4 provides an overview of the main titles within this cohort. Whereby only the CFO (33%) and Chief Marketing Officer (38%) show significantly higher females shares.
So where are all of these executive positions in the Construction & Real Estate industry grouping?
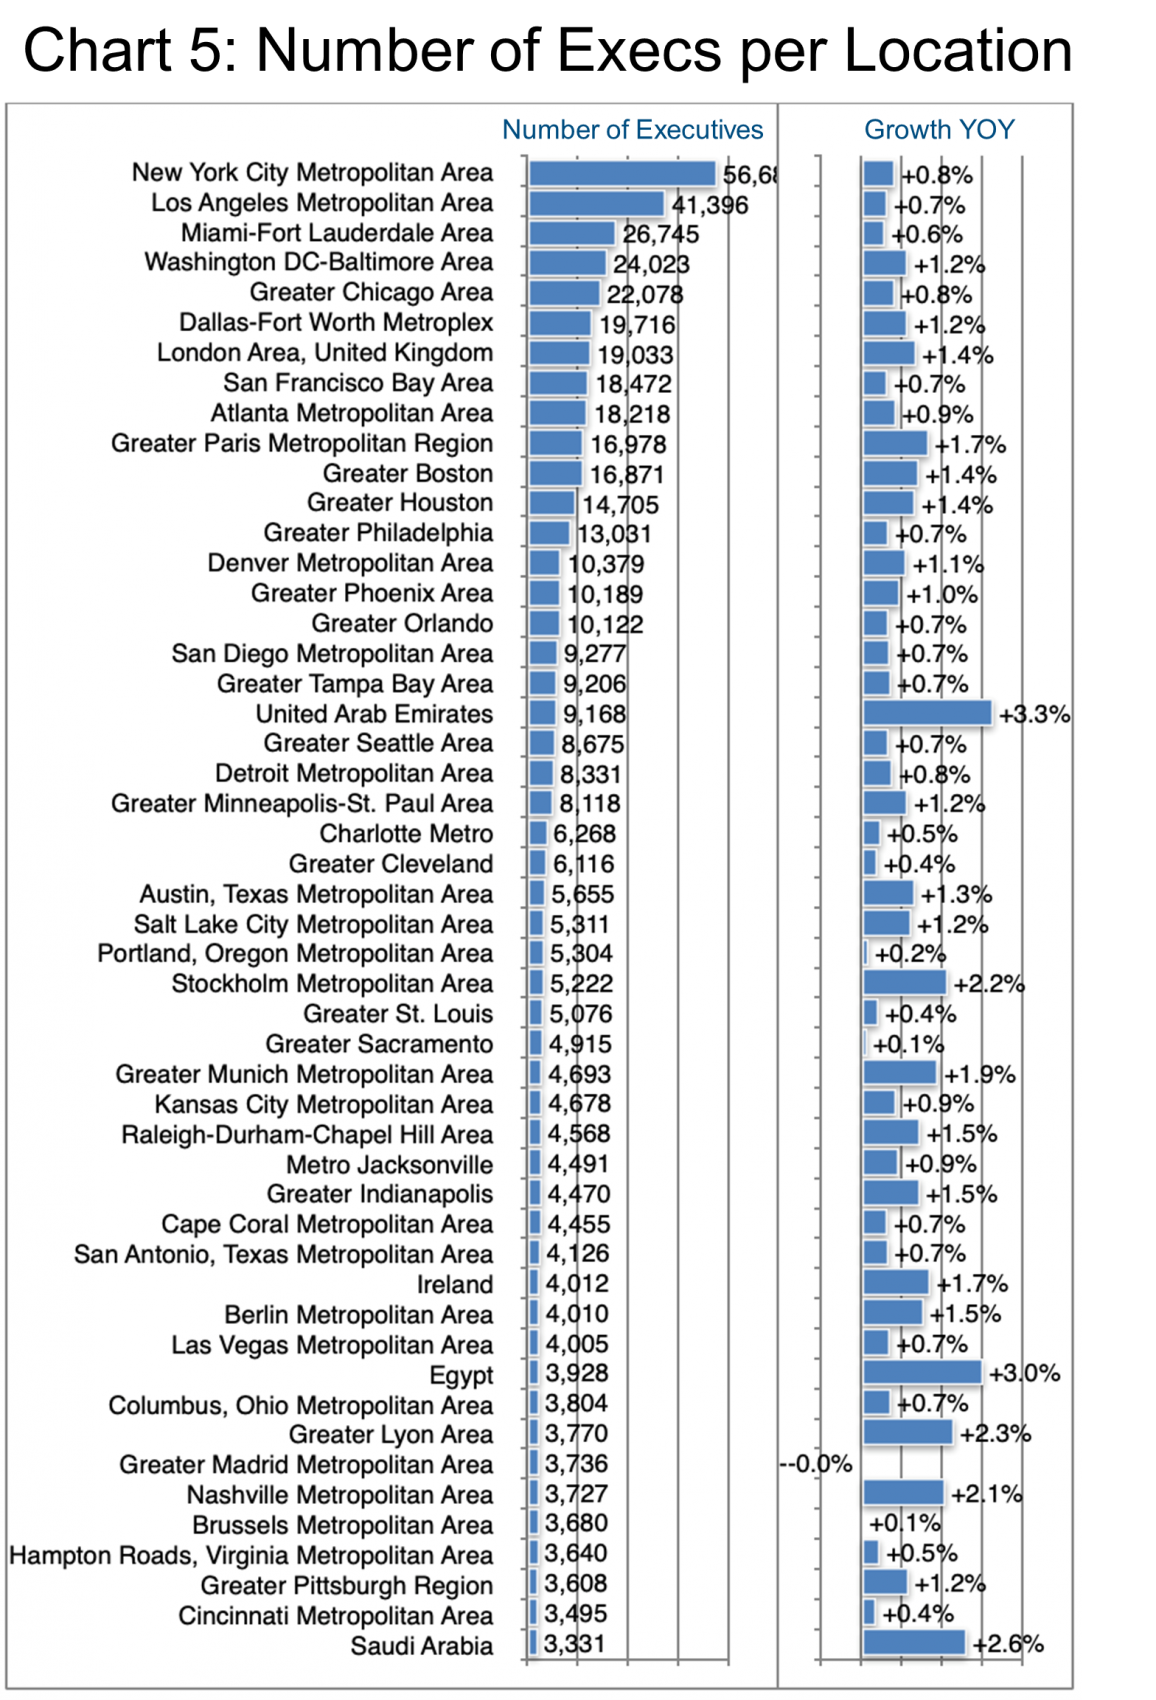
Readers of these Updates will not be surprised to see New York at the top of the list in terms of the total number of executives. Though the difference in this cohort is not as extreme as in many others that we have studied. Los Angeles is not that far behind. Numbers 3 and 4, Miami and Washington DC, are still almost 50% as large as New York.
Still, none of those important centers of concentration is showing high growth in the number of executives employed. The growth is definitely in the ME region (UAE, +3.3%, Egypt, +3%, and Saudi Arabia, +2.6%). Growth is then in Europe (Lyon, +2.3%, and Stockholm, +2.2%). In fact, according to our data, only one US city in the top 50 makes it to 2% growth—Nashville (+2.1%).
In the ME region, ALDAR (+23%, UAE), Amer Group (+11%, Egypt), DAMAC Properties (+10%, UAE), and Talaat Moustafa Group (+29%, Egypt) are among the top five employers of executives in this industry grouping. These help to drive regional growth to about 3% YOY.
In Sweden, Stockholm and Gothenburg are both showing approximately 2% growth in executives employed. They are propelled by Skanska, Newsec, Fastighetsägarna, HSB, Serneke, and Framtiden Byggutveckling AB. In greater Lyon (France), this executive pool has grown by more than 3% in the past year. These top employers are such as ORPI, Guy Hoquet L’Immobilier, and Laforêt France. They are helping to drive the trend.
Peter Irish, CEO The Barrett Group
Click here to download a printable version: Industry Update – Construction & Real Estate
Editor Note:
In this particular Industry Update, “executives” will generally refer to the Vice President, Senior Vice President, Chief Operating Officer, Chief Financial Officer, Managing Director, Chief Executive Officer, Chief Human Resources Officer, Chief Marketing Officer, Chief Information Officer, Managing Partner, and President titles. Unless otherwise noted, the data in this Update will largely come from LinkedIn and represents a snapshot of the market as it was at the time of the research.
Is LinkedIn truly representative? Here’s a little data: LinkedIn has approximately 722 million users, 174 million in the US, and 163 million in Europe. (See Source.) LinkedIn is by far the largest and most robust business database in the world, now in its 18th year. LinkedIn defines the year-over-year change (YOY Change) as the change in the number of professionals divided by the count as of last year. “Attrition” is defined as the departures in the last 12 months divided by the average headcount over the last year.