INDUSTRY UPDATE: Manufacturing – August 2021
INDUSTRY UPDATE: Manufacturing
The Barrett Group serves executives internationally in clarifying their career objectives. We help them discover the professional opportunities of their choice. We employ a five-step career change system. It has proven extremely effective over the last three decades. Of course, our executive clients want to understand the macroeconomic developments in our regions of focus. We keep up to date in order to advise clients during their career change programs on industries, regions, and specific companies of particular interest.
LinkedIn is by far the largest professional network in the world. It comprises more than 700 million individuals in the meantime. So how many of them are executives? If we select only the top C-level titles (CEO, CFO, and COO) and only the Vice President titles we come up with a reasonable answer. In the US, 2.1 million individuals on LinkedIn fit these criteria. That pool has increased by about 1.4% over the last year. It also shows a modest “churn” of 69,000 who have changed employers in the same period, ca. 3.5%. The corresponding data for the EU is 826,000 (up almost 3% versus the prior year). Of those, 40,000 changed companies (approximately 5%).
Apparently, the 2020 recession at just two months was the shortest recession in the US in living memory.
Many industrial segments have seen a significant recovery since the depths of 2020. We plan to review each of these over the coming months. Let’s begin with Manufacturing which has seen one of the largest turnarounds.
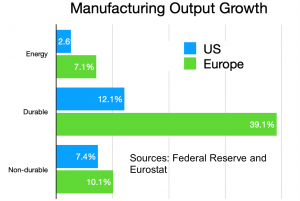
In the Manufacturing Output Growth graphic, we use data from the Federal Reserve in the US and Eurostat for Europe. The periods are year over year, May (Europe) and June (US). The US recovered faster and Europe is now catching up, hence the difference in their YOY stats.
Applying the same selection criteria as above, LinkedIn tells us that the EU population of executives in manufacturing comprises about 33,600. It has increased by about 3% year on year. And has experienced a relatively high churn of 8.5% of executives who have changed employers. In the US these data look a little different. Approximately 115,700 executives hold these roles in this sector, up about 2% since the prior year with a churn of about 6,700 or 5.8%.

Much of the growth in executive jobs, though, appears to be in mid-sized to smaller companies. Let’s look at the top employers in each of these segments. Based on the number of executive roles as defined above (see the Most Executives in Manufacturing, above and Changes Year on Year graphics, above), we see Honeywell occupying the top spot in the US, followed by GE and Siemens. The blue column in the graph represents the current net executive population as defined above. The green shows growth over the prior year. While the red line quantifies the attrition over the same period. Based on this, Aerospace (Boeing and Safran) are showing high attrition, while Schneider and Thermo Fisher are both showing high growth.
The EU equivalent top ten also includes Siemens and Schneider, as well as ABB. Airbus and Safran show the deepest attrition while only ABB shows significant growth.
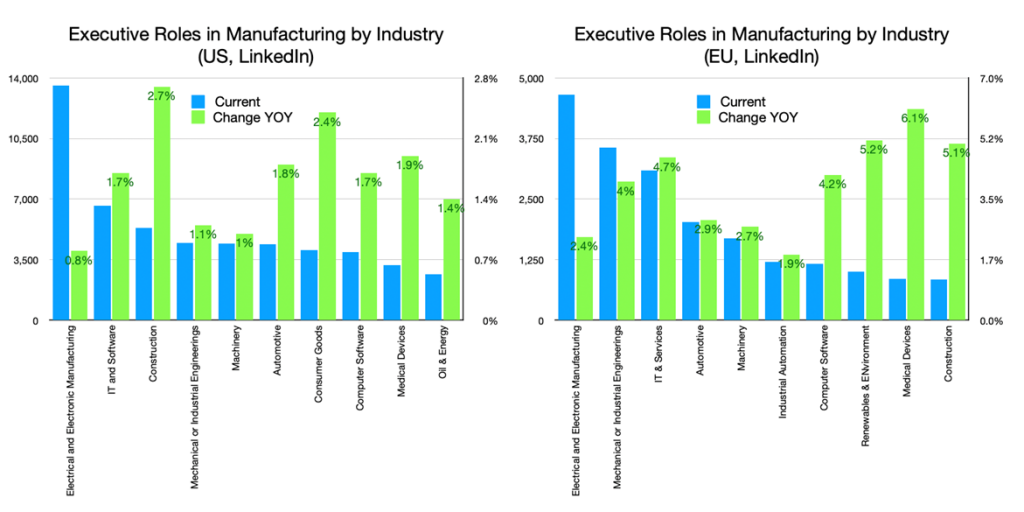
As far as industries are concerned, LinkedIn continues to show an interesting perspective. LinkedIn shows changes in the top sectors employing executives in the US and EU as follows (see the Executive Roles in Manufacturing by Industry graphics, above). In the US, Construction and Consumer Goods show the highest growth in executive roles. In the EU, Medical Devices top the bill, followed by Renewables, Construction, and IT & Services.
Let us now isolate two relatively high-profile sub-segments within the manufacturing space: automotive and aerospace.
Automotive represents a surprisingly small slice of the overall executive population as defined above. Automotive is just 4,400 in the US, up 2% versus the prior year with a churn of about 4.6% having changed employers. In the EU, the executive population is even smaller. EU automotive is just 2,000 executives, up about 3% YOY with a churn of approximately 7%.
In the following two charts we see a lot of familiar brand names. Most of these show significant growth in their executive ranks over the past year. This is certainly the bounce-back from the extreme decline in 2020 when used car sales spiked while new cars slumped. There are at least two clouds however hanging over the automotive industry in 2021 and 2022. One being the general question of what will happen to consumer confidence as the pandemic drags on. But more pressingly, there is a severe shortage of computer chips now raging that is already causing the curtailment of production at some plants both in the US and Europe.
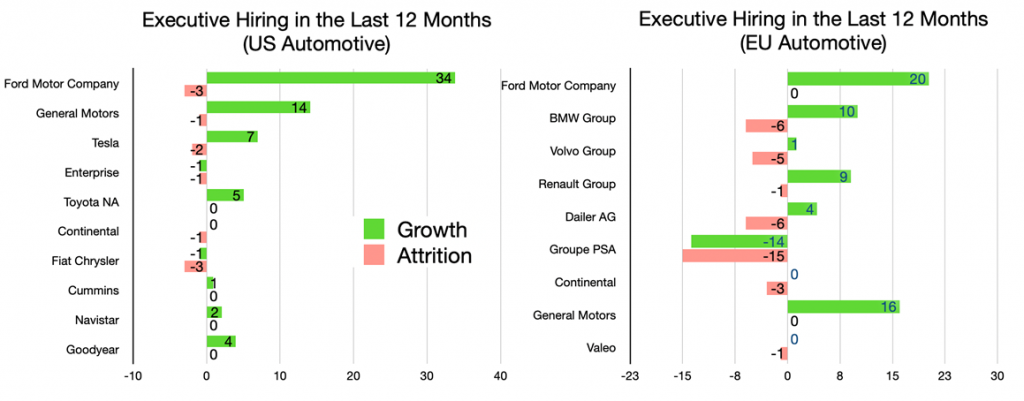
By the way, the total executives listed above in the automotive industry in the US comprise about 520, up about 14% in the prior year. For the EU that number is 505, up about 10% year on year.
Aerospace employs about 550 executives as defined above in the EU. This number is up 2% with a churn of just 4% of the executives who have changed employers. In the US, circa 2,400 executives work in this industry, up 0.5% YOY and with a similarly low churn. The top players in the industry showed more growth among executives in Europe (263, up 6.3% YOY). The US showed 344 (down 2.2% versus the prior year).
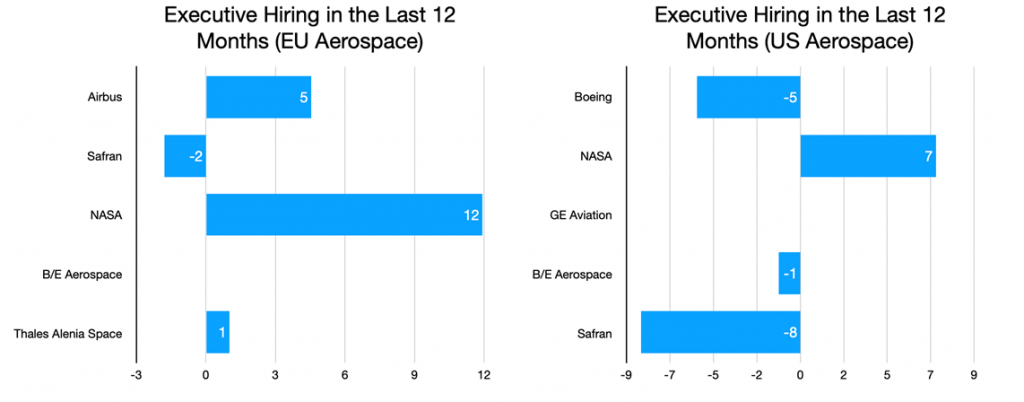
Aerospace, like the automotive industry, will be acutely affected by consumer demand. So far, industry predictions for the return of airline passengers are cautious at best, with full recovery possibly still years away. However, more generally, the outlook at the moment for the overall economy is relatively rosy. The Economist (8-6-2021) reports that the IMF now “projects GDP will rise an impressive 7% in 2021 as a whole, and by a further 5% in 2022.” That is a lot of scope for further growth in manufacturing executive jobs.
The Barrett Group serves clients across all industries because we work for the client, not the employer.
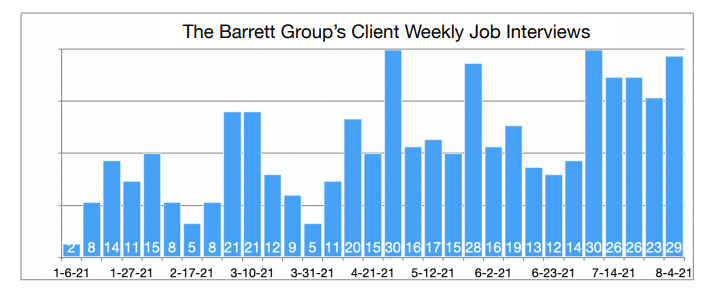
Our clients are currently enjoying a very strong upward trend in interviews (more than 100 in the month of July 2021). One of the factors that truly sets the Barrett Group apart is that we focus initially on the specific targeting for our clients. Many of our clients want to change industries, roles, and even locations. Our Clarity Program© provides the perfect setting for clarifying your true desires and objectives. The remaining four steps of the career change program assure a very high rate of success. Our databases provide information on companies and executives around the world. We help our clients make the right choice and prepare professionally for those all-important interviews. As the “cherry on the top” we almost invariably add tens of thousands to our clients’ compensation packages at the offer stage through our negotiation support services.
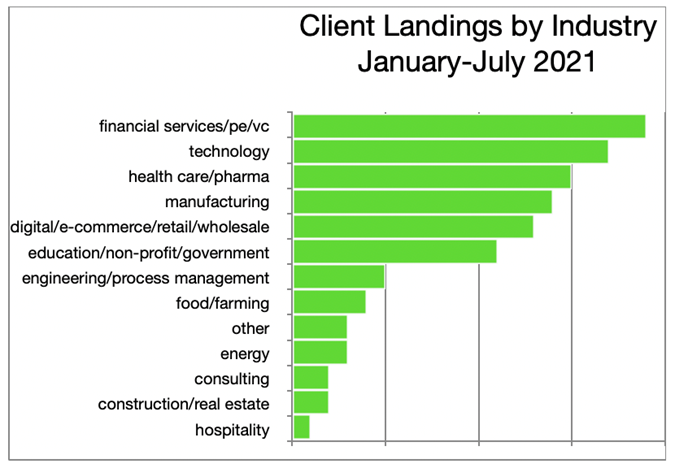
As a consequence, our clients are landing in a broad range of industries (see the Client Landings by Industry graphic).
We look forward to providing further Industry Updates in the future and to helping executives like you live a more productive and satisfying life while earning higher compensation. We make it our job to help you find yours.
Peter Irish CEO The Barrett Group
Click here to download a printable version Industry Update – Manufacturing – August 2021