INDUSTRY UPDATE: Legal Services – February 2022
Introduction
As in other industries, there has been a seismic shift in focus in the legal industry over the last year or two. This is in part because of the pandemic and the rise in remote working. On the one hand, this relates to the content of the work whereby compliance with the fast-changing masking, vaccination, and other pandemic-related legal proscriptions have tilted the playing field. Working from home has also stretched not only the HR community. But also those who practice labor law. We have seen numerous issues float to the top. These include the rights of employers to require in-office work versus the rights of employees to stay home and feel safe.
Then there is the whole issue of legal teams being able to work effectively while being remote. One source (See Source) highlights these five trends affecting the legal industry as a result:
- Legal workflow automation
- Increased collaboration within law firms
- Data security
- Flexible options for client communication
- Employee retention
How big is the legal services market?
“The legal services market reached a value of nearly $713.7 billion in 2020, having increased at a compound annual growth rate (CAGR) of 3.4% since 2015. The market is expected to grow from $713.7 billion in 2020 to $908.26 billion in 2025 at a rate of 4.9%. The market is then expected to grow at a CAGR of 4.8% from 2025 and reach $1,145.9 billion in 2030.” (See Source.)
Of course, “legal tech” is also growing, automating some of the more laborious aspects of forming companies, legal filings, etc. Another source reports that the value of these legal on-line services in the US reached just shy of $11 billion in 2021. And it seems on track to continue growing at the 8.5% annual pace seen over the last five years (See Source).
There are other trends that are likely to affect the industry. These include merger and acquisition, navigating increasing environmental regulation, and on-going employee recruitment and retention matters. Given all the challenges, 2021 was apparently a banner year for external legal advice. And 2022 is looking even better:
“As became the norm during much of 2021, corporate clients increasingly sought external expertise to help them navigate these choppy waters, so that now corporate law departments’ typical spend on outside counsel in 2021 is as high as it has ever been — in fact, 35% higher than the typical spend in 2016.”
“Looking forward, market optimism in legal spending is currently at its strongest point in the last decade. Globally, four in 10 corporate clients are anticipating an increase in legal spending in the coming year; only half as many (20%) are expecting a decrease. This represents the highest proportion predicting an increase and lowest expecting a decrease in the last 10 years.” (See Source.)
What about in-house counsel? Here’s what one source says about when it is practical to bring on or expand in-house counsel:
“Attorneys range in price from an average of $727 per hour for senior partners at big law firms to an average of $343 per hour for partners at smaller firms. Some prestigious law firms charge as much as $1,500 per hour. If your law firm is on the high end of the spectrum and charges $1,000 per hour, your business would need to have 200 hours of legal work each year to justify a GC’s $200,000 price tag. However, if your law firm charges just $200 per hour, your company should have 1000 hours of legal work per year to benefit financially from hiring a GC. That’s nearly 20 hours of legal work each week.” (See Source.) The source goes on to point out that all of these legal hours should be in related areas of law, otherwise, you will end up hiring specialists in addition.
Most companies have already made this decision one way or the other. And so far the number of in-house lawyers at least in the US is outpacing growth in government and big-law firms. (See Source.) But there are clearly some distinctions to be drawn here.
LinkedIn lists 1.2 million attorneys of all types in the US, EU, UK & Middle East (ME) geography, a population that has grown by about 1% year on year (YOY). Approximately 645,000 of them are in the EU, UK & ME, and 592,000 in the US. Both of these groups show a relatively high female gender share at 48% and 40% respectively.
If one focuses only on Senior Attorney titles, this pool shrinks to 44,000 in the same geographic areas. But it grew by 2% YOY. And, again shows a high 46% female gender share. Circa 16,000 are located in the EU, UK & ME areas, with the other 28,000 or so in the US.
For the purposes of this Update, however, we choose to further focus on the In-house and General Counsel titles. These seem to be much coveted by our senior legal executive audience. Therefore the bulk of this Update will be devoted to this specific cohort.
General Counsel and In-house Counsel
LinkedIn reports about 83,749 General and In-house Counsels (G/IC) in the US, EU, UK, and Middle East (ME), a group that has grown by about 4% YOY and is 43% female. Three-quarters of these lawyers are located in the US (61,886). And almost 11% (6,626) have changed jobs and companies in the past year. In the EU, UK & ME grouping (21,863) relatively fewer changed companies in the past year (1,916, or 8.7%).

The titles listed in Chart 1 help to some extent to describe the population on which we are focused. General Counsel as being by far the most common. In any case, the gender balance is far more equitable in this segment than in many that we have studied so far.
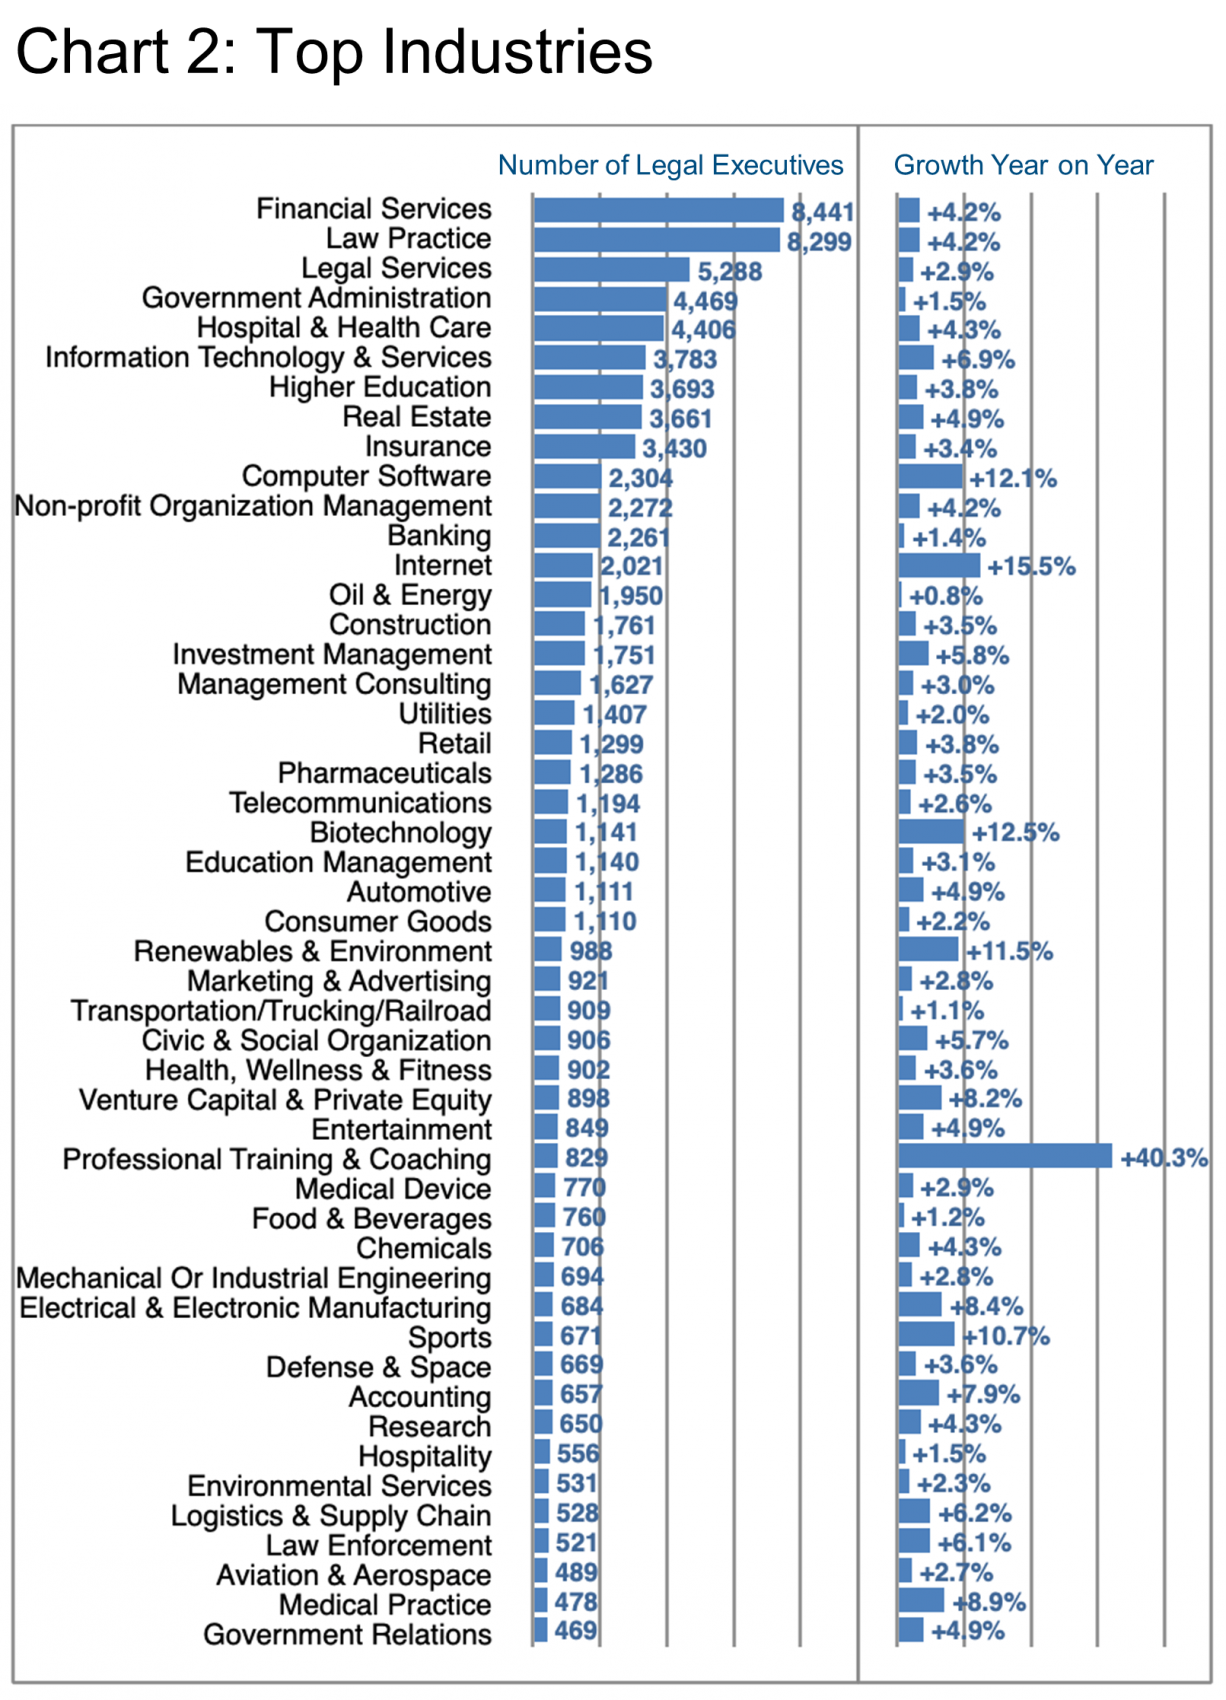
Chart 2 begins to peel back the layers. Highlighting the industries where these professionals work. It would seem that relatively few actually work in a law practice (not quite 10%). As far as the largest employers are concerned, this detail on the top five industries provides insight into who the major employers are in each industry. Please note, the grey-shaded employers belong to the EU, UK & ME cohort.
Among the fastest-growing industries employing G/IC legal executives, (Chart 2) certainly Professional Coaching and Training stands out. It shows +40% YOY, albeit from a small base. The Coach HUB (Germany), Kelly Roach Coaching (US), and Instituto de Estudios Cajasol (Spain) are the top employers driving this trend. Other fast-growers include familiar industries. These are such as Internet (+15.5%), Biotechnology (+12.5%), Computer Software (+12.1%), and Renewables & Environment (+11.5%). Meta/Facebook, Microsoft, and Amazon play a significant role in the Internet and Software industries’ growth in demand. Genentech, Amgen, and Gilead Sciences are the top employers of G/IC in Biotech.
Note that Barrett Group clients enjoy considerably more insight into targeted industries, employers, and relevant executives’ professional histories as available and necessary during a career change program.
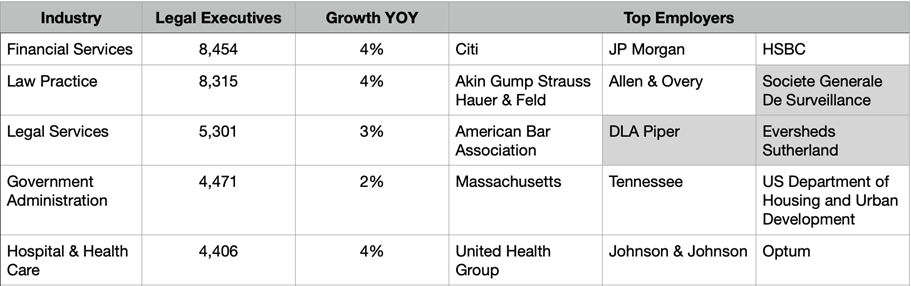
Chart 3 examines the areas of specialization listed by G/IC legal executives on LinkedIn. Bear in mind that many legal executives will have listed several areas of specialization in their LinkedIn profiles. However, the sheer breadth of this list recalls that, indeed, no one lawyer can probably handle all of the legal bandwidth required in a larger role. This shows that teams of in-house counsel, or external specialists are often required to really comprehend and manage complex subjects and/or situations.
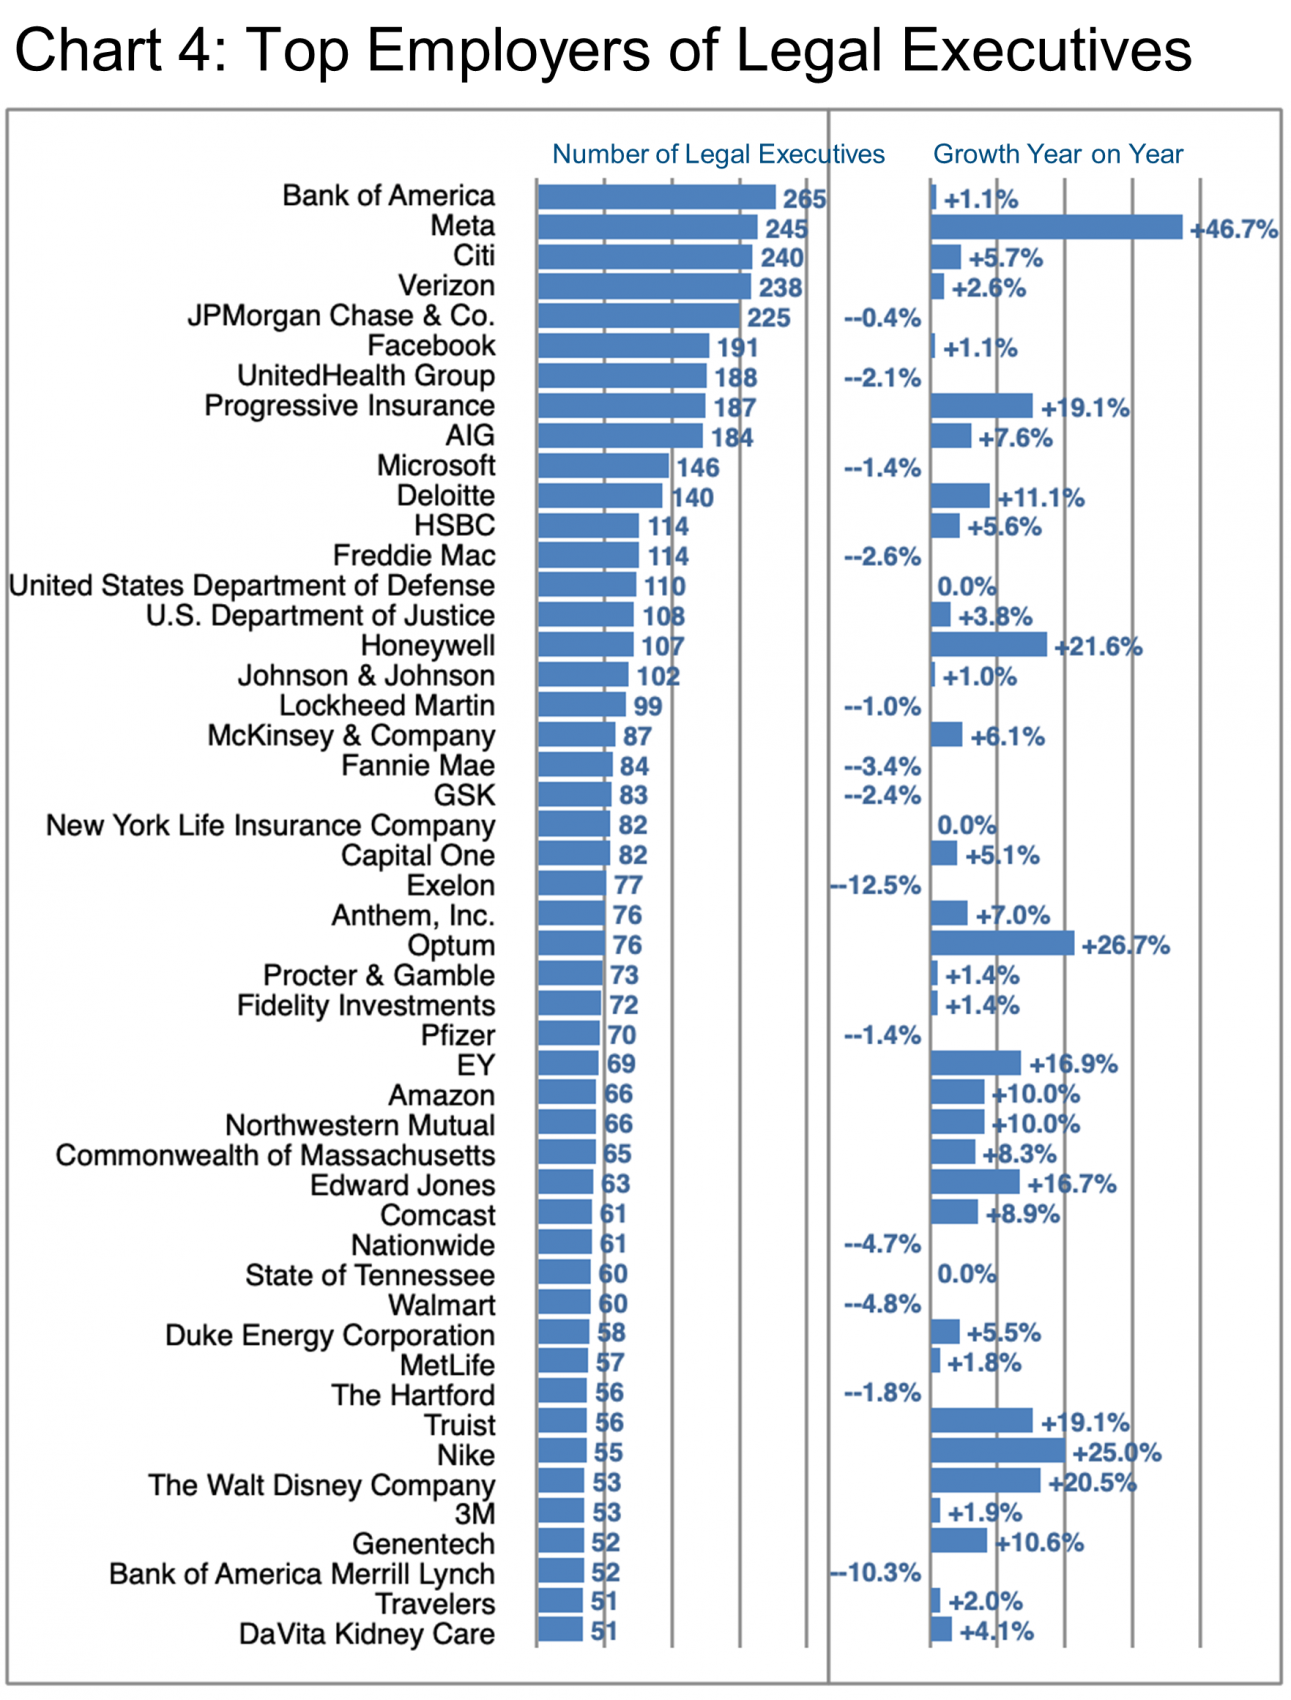
Chart 4 makes it clear that we are looking mainly at G/IC counsel in this data set as extracted from LinkedIn. This is because there are no big law firms listed as employers in this top 50 overview although there are many familiar names on display.
Let us examine some of the companies with the fastest growth in G/IC executive employment (Chart 4).
Meta is, of course, the rebranded Facebook. So much of their apparent growth is actually associates moving from Facebook to Meta (33 in total, mainly between June and December of 2021). Meta also picked up a smattering of G/IC legal executives. These came from competitors such as Amazon (+2), Microsoft (+2), and Apple (+1). They also came from legal specialists such as the US Attorneys’ Offices (+2), William Fry LLP (+2), and Morgan, Lewis & Bockius LLP (+2). Net net, Meta added 138 legal executives, lost 15 to attrition, and therefore gained a net 123, less those who simply transferred from Facebook for a net-net gain of 90. This is still impressive and perhaps highly understandable considering Meta’s myriad legal challenges.
In the healthcare space, Optum added 53, while losing 44 to attrition. Optum gaining a net of 9 G/IC legal executives. UnitedHealth Group is the biggest donor (-2 /+6 from Optum’s perspective). Rally Health also contributes another 5. The remaining changes were all relatively diffuse.
Honeywell stands out as well. They had 82 hires and 49 departures. This is for a net gain in G/IC legal executives of 33. GE Renewable Energy, ITW, and BP all lost 2 attorneys each to Honeywell. The remainder is well distributed across a broad range of companies. Notably, Quantinuum acquired 3 legal executives from Honeywell in the period as well.
In the Financial Services area, Progressive Insurance added 45, lost 12. Progressive, therefore, gained 33 legal executives in the period. They are notably from competitors Geico (+7), Allstate (+3), Farmers Insurance (+3), and a number of less familiar companies.
Nike also grew considerably, though from a lower baseline. Nike adds 71 G/IC legal executives, lost 15, and so posts a net gain of 56 mainly since August 2021. They hired from a very broad range of companies. These include John Deere, WeWork, and the Minnesota Vikings, so there was no specific donor organization that stands out.
Lastly in Chart 4, Walt Disney posted a significant net gain in legal executives of 129 (+141 / -12). They bring in talent from Hulu, ESPN, Blue Sky Studios, and Shopify plus a long list of others.
Even if you are working remotely, the location of your employer remains important, of course. Where are all of these G/IC positions?
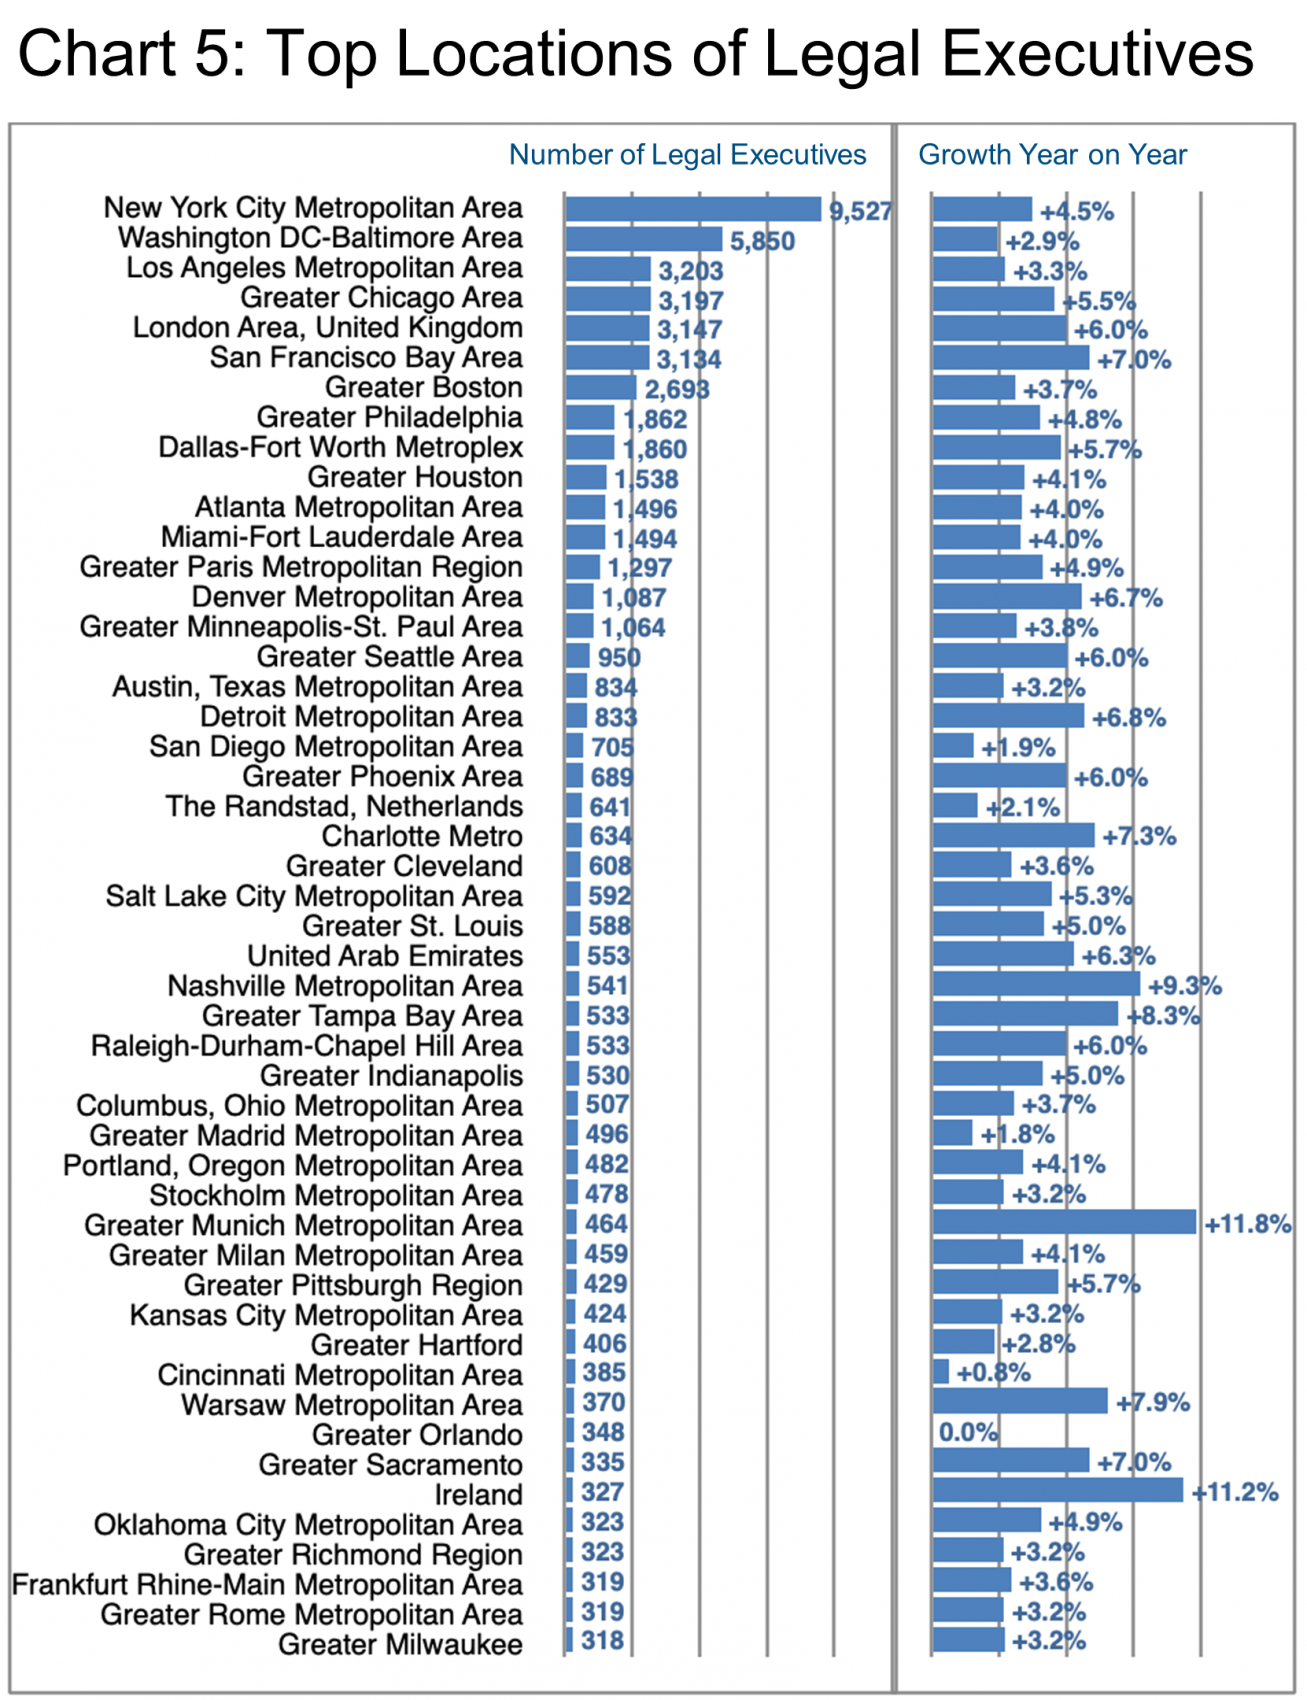
New York, Washington DC, Los Angeles, and Chicago have the largest numbers of these G/IC executives in the US (Chart 5). Only London represents the EU, UK & ME cohort in the top five locations. Munich and Ireland, however, show the fastest growth YOY. And is followed by Nashville, Tampa, Warsaw (Poland), Charlotte, and San Francisco. All of the top six locations show a “very high hiring demand” according to LinkedIn except Washington DC. The top employers in these markets include a who’s-who of well-known brands. These include Citi, AIG, Verizon, Walt Disney, Snap (software), JP Morgan, HSBC, Bank of America, and Meta. The last three being focused on London.
Peter Irish, CEO The Barrett Group
Click here to download a printable version: Industry Update – Legal Services
Editor Note:
In this particular Industry Update “executives” will generally refer to the Vice President, Chief Financial Officer, CEO, Managing Director, Chief Operating Officer, General Counsel and In-House Counsel titles with functional responsibility for legal matters. Unless otherwise noted, the data in this Update will largely come from LinkedIn and represents a snapshot of the market as it was at the time of the research.
Is LinkedIn truly representative? Here’s a little data: LinkedIn has approximately 722 million users, 174 million in the US, and 163 million in Europe. (See Source) LinkedIn is by far the largest and most robust business database in the world, now in its 18th year. LinkedIn defines the year-over-year change (YOY Change) as the change in the number of professionals divided by the count as of last year. “Attrition” is defined as the departures in the last 12 months divided by the average headcount over the last year.