
INDUSTRY UPDATE: Health Care
Introduction
For decades analysts simply expected health care costs to significantly outpace inflation. But this trend has now reversed, and health care spending in the OECD has fallen back toward its 2008 level. The Economist suggests that several factors are contributing to this sea change:
- health care provision has become more efficient in part because technology is supporting and enabling productivity growth,
- insurance availability has improved (for example, due to the Affordable Care Act in the US),
- fiscal prudence on the part of health care providers (for example in the UK, limiting staff pay raises), and
- the replacement of brand-name pharmaceuticals with generics. [See source.]
A recent survey of insurers also predicted a near-term decline in the growth of medical costs. It cites falling inflation as well as the easing of a spike in elective procedures delayed due to Covid-19. [See source.]
| In 2023 the global health care market was valued at just short of $8 trillion, up 6.3% from the prior year. It is forecast to grow to about $9.8 trillion by 2027. |
Market Size and Dynamics
Nevertheless, these are huge markets and, with an aging population, a relatively safe bet on continued demand. “Over half of insurers (58%) anticipate [a] higher or significantly higher medical [cost] trend over the next three years.” [See source.] As far as the market size and dynamics are concerned, we highlight here a few nuggets. We caution readers, however, that the data from different sources may not be truly comparable due to differing methodologies:
- In 2023 the global health care market was valued at just short of $8 trillion, up 6.3% from the prior year. It is forecast to grow to about $9.8 trillion by 2027. [See source.]
- In the same year, the US market value reached $3.6 trillion [see source], a per capita spend of about 17.3% of GDP. [See source.]
- Governmental spending on health in the EU came in at €1.2 trillion in 2022 or 7.7% of GDP. [See source.] On the other hand, “Current healthcare expenditure in Germany, France and Austria was equivalent to 12.9 %, 12.3 % and 12.1 %, respectively, of gross domestic product (GDP).” [See source.]
- In the Middle East, the market reached a value of $243.6 billion in 2023, up from $185.5 billion in 2019. [See source.] Spending in the region stood at about 3.7% of GDP in 2021. [See source.]
Trends in the Health Care Marketplace
What trends can we see emerging in the health care marketplace? First, note that we are combining the hospital, medical device, and pharmaceutical sub-industries in this Industry Update for the simple reason that there is an extensive exchange of executive talent between these related industries. Despite this heterogeneous mix, we can generalize about some of the larger trends affecting this market. One source that describes itself as a “healthcare media company that delivers business intelligence” to executives in this marketplace does a neat job of summarizing these as follows:
- mounting financial pressures (particularly labor costs);
- physician and nursing shortage (a shortfall of “124,000 physicians and 450,000 nurses”);
- rising influence of payers (insurers have grown and gained some leverage versus health care providers);
- regulatory and policy changes (drug pricing restrictions, for example);
- surge in M&A (“31 announced hospital mergers in the first half of 2024” [see source]);
- non-traditional competitors (“digital natives and retail health giants” entering the market);
- technology and digital transformation (administrative short-cuts, robotic surgery, tele-health); and
- workforce recruitment and retention [See source.]
And then there is artificial intelligence (AI).
Some see this trend as dehumanizing health care, exposing patients to data privacy risks, potentially introducing unintended bias in decision making, adding to data quality issues, being rendered cumbersome due to interoperability barriers, and/or driving the overprescribing of treatment. But clearly, technology and health providing companies smell opportunity:
“…in 2023 the health-care world spent about $13bn on ai-related hardware (such as specialised processing chips and devices that include them) and software providing diagnostics, image analysis, remote monitoring of patients and more. [The source] sees that number reaching $47bn by 2028. Analysts at cb Insights reckon investors transferred a whopping $31.5bn in equity funding into health-care-related ai between 2019 and 2022. Of the 1,500 vendors in health ai over half were founded in the past seven years.” [See source.]
| Some see AI as dehumanizing health care. But technology and health providing companies smell opportunity. |
On the positive side of AI in health care, another source cites the following potential advantages:
- expansion of telemedicine and remote monitoring,
- accelerated diagnosis and disease detection,
- drug discovery and development,
- treatment planning and personalization,
- predictive analytics and risk assessment, and
- increased administrative efficiency [see source.]
The Drugs Shaking Up Health Care
This summary would be incomplete without a mention of the new class of drugs shaking up health care, the so-called GLP-1 agonists. Consumers know these as Ozempic, Wegovy, Mounjaro, Zepbound, etc. The important commonality is that they allow unprecedentedly effective treatment of a broad range of conditions from diabetes, to obesity, cardiovascular diseases, liver function, addiction, and possibly even Alzheimer’s. Without going into too much detail here, the class of drugs seems to work by having a broad anti-inflammatory effect and the ability to suppress appetite. Some even see potential for slowing the effects of aging. Imagine how impactful and therefore valuable this new pharmaceutical family will be as it proliferates! [See source.]
In any case, the challenges and the opportunities are relatively clear. Who will solve this puzzle? Let us now turn our attention to the thousands of women and men who meet these challenges every day—the health care executives.
The Market for Executives
Almost 840,000 executives fit the criteria for this Industry Update, down 1% over the last year but with a significant 4% changing jobs in the period—30,000 executive opportunities in total. (See the Editor’s Note for more details on how we define executives.) Nearly 550,000 of these executives were in the US and Canada (-2.0%), 258,000 (-0.5%) in the EU and UK, and almost 34,000 in the Middle East (-0.78%). The median tenure came in at about 3.5 years. Lastly, an unusually high percentage of these executives are female—40%.
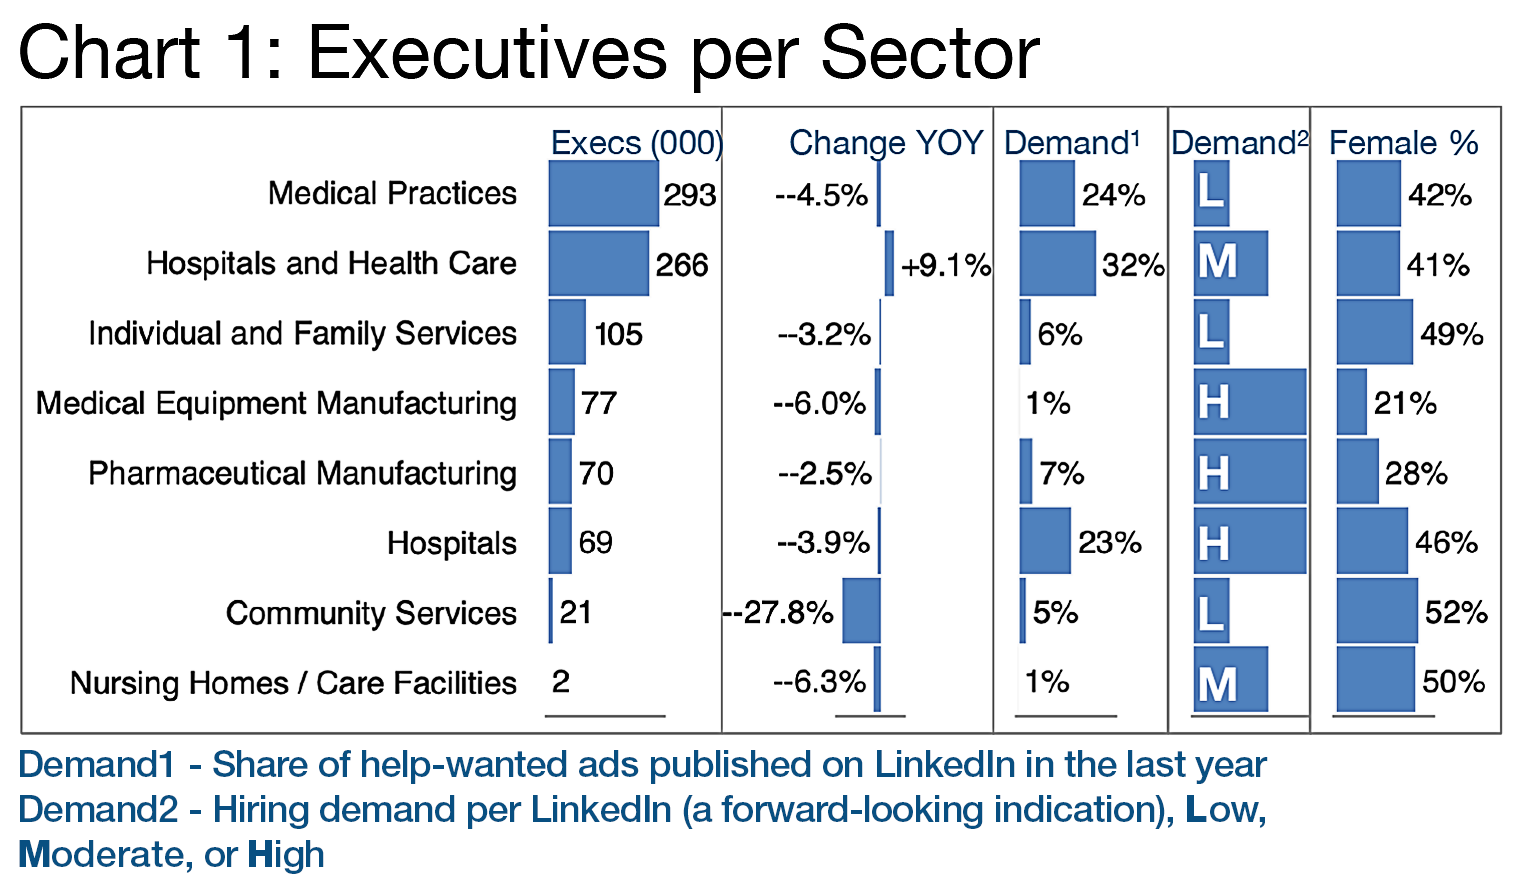
We mentioned the heterogeneous mix of sub-industries covered in this Update earlier. Chart 1 provides more clarity on the sectors in which these executives work. Apparently Hospitals and Health Care as a LinkedIn industrial category have grown the fastest recently and still exhibit moderate hiring demand. Community Services is contracting and is unfortunately also the sector with the highest female executive share. Still, women hold a high share in other segments, too as detailed in Chart 1.
The diverse structure of this industrial grouping is somewhat invisible in Chart 2 because, while a mid-sized hospital system might have only one CEO and a few VPs or Directors, a large pharmaceutical manufacturer is likely to have more VPs and Directors per CEO. The relatively high number of CEOs per Chart 2 nevertheless suggests that this is still a relatively unconcentrated industry and therefore, M&A is quite likely to accelerate over time.
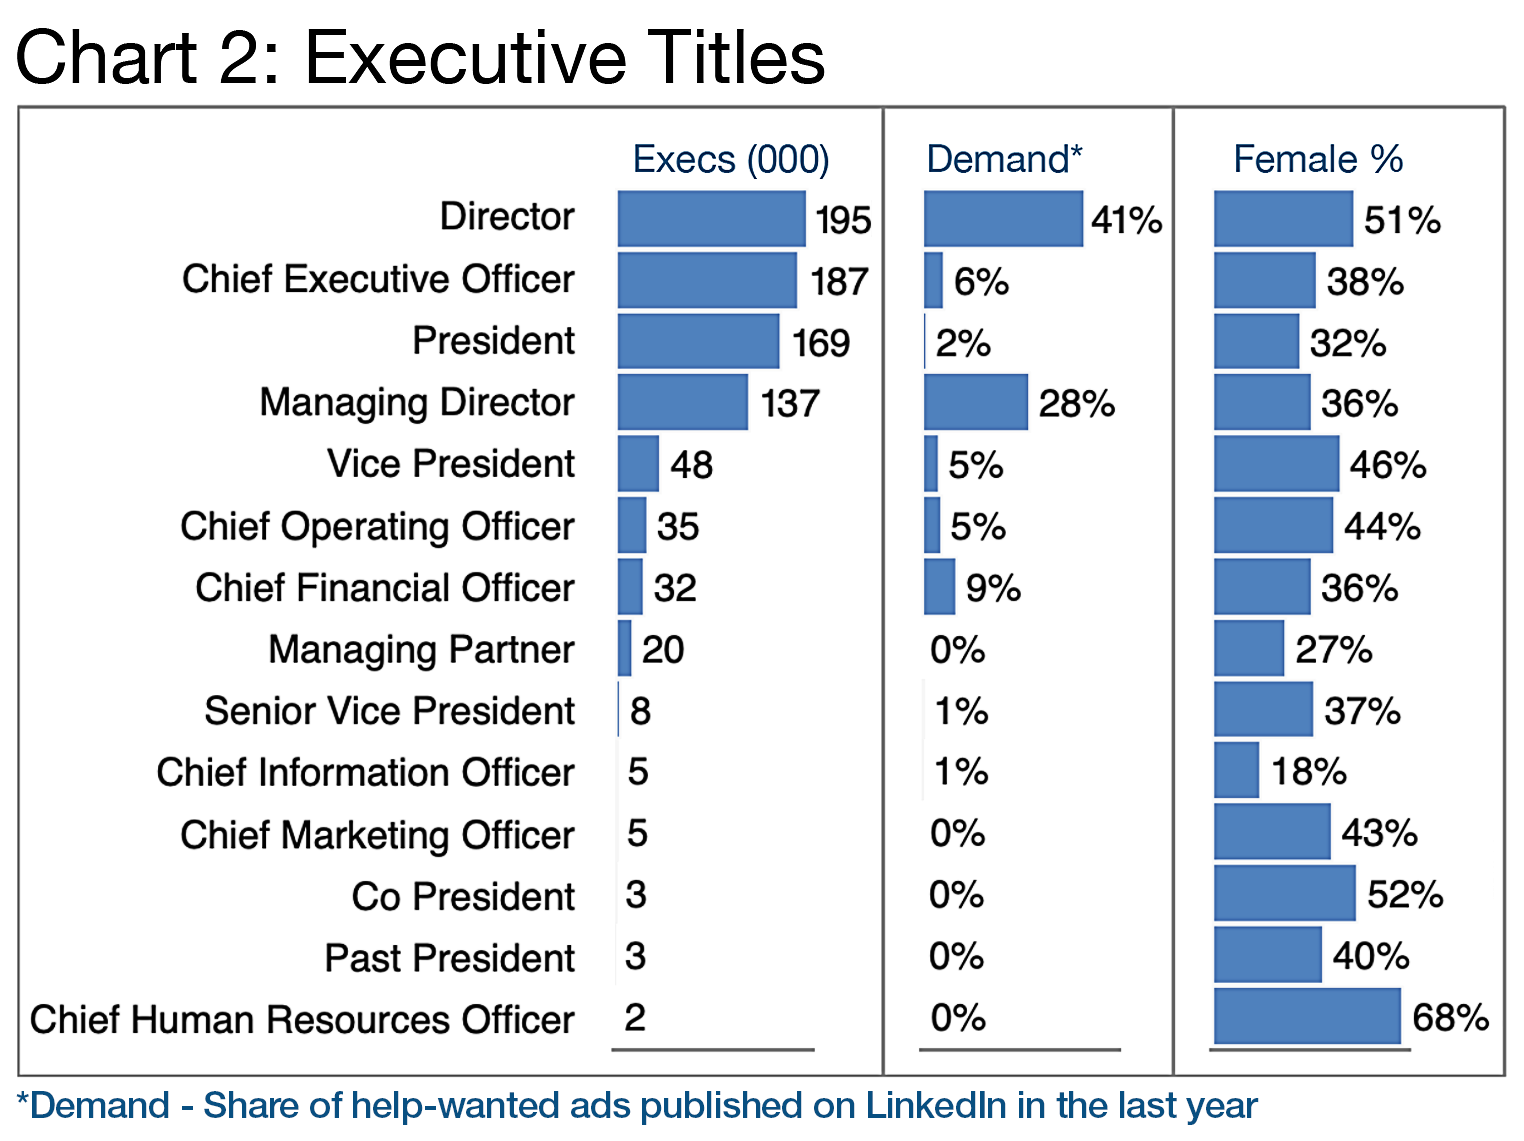
Still, as things stand, per Chart 2, the industry saw the most demand for Director and Managing Director roles in the past year, and, as we have mentioned above, female executives are relatively prevalent versus other industries, reaching their nadir in the CIO role (18%) and their peak in the CHRO position (68%).
Health Care’s Top 20 Employers of Executives
Chart 3 explores the diversity of this multi-sector industry in more detail by comparing the sectors’ top twenty employers of executives. Except privately to our clients we are not at liberty to divulge the actual numbers per company but they range from a low of 45 to a high of almost 1,600 executives across these segments.
In general, the pharmaceutical companies seem to have been on a hiring streak which is interesting given that the sector has also performed well as a group of stocks recently (+14.37% YTD return versus the total industry’s 9.36% YTD return.) But medical facilities have actually outperformed even pharma (+24.61%) and medical instruments have done even better (+26.14%), though all of these returns may well have changed by the time you read this. [See source.]
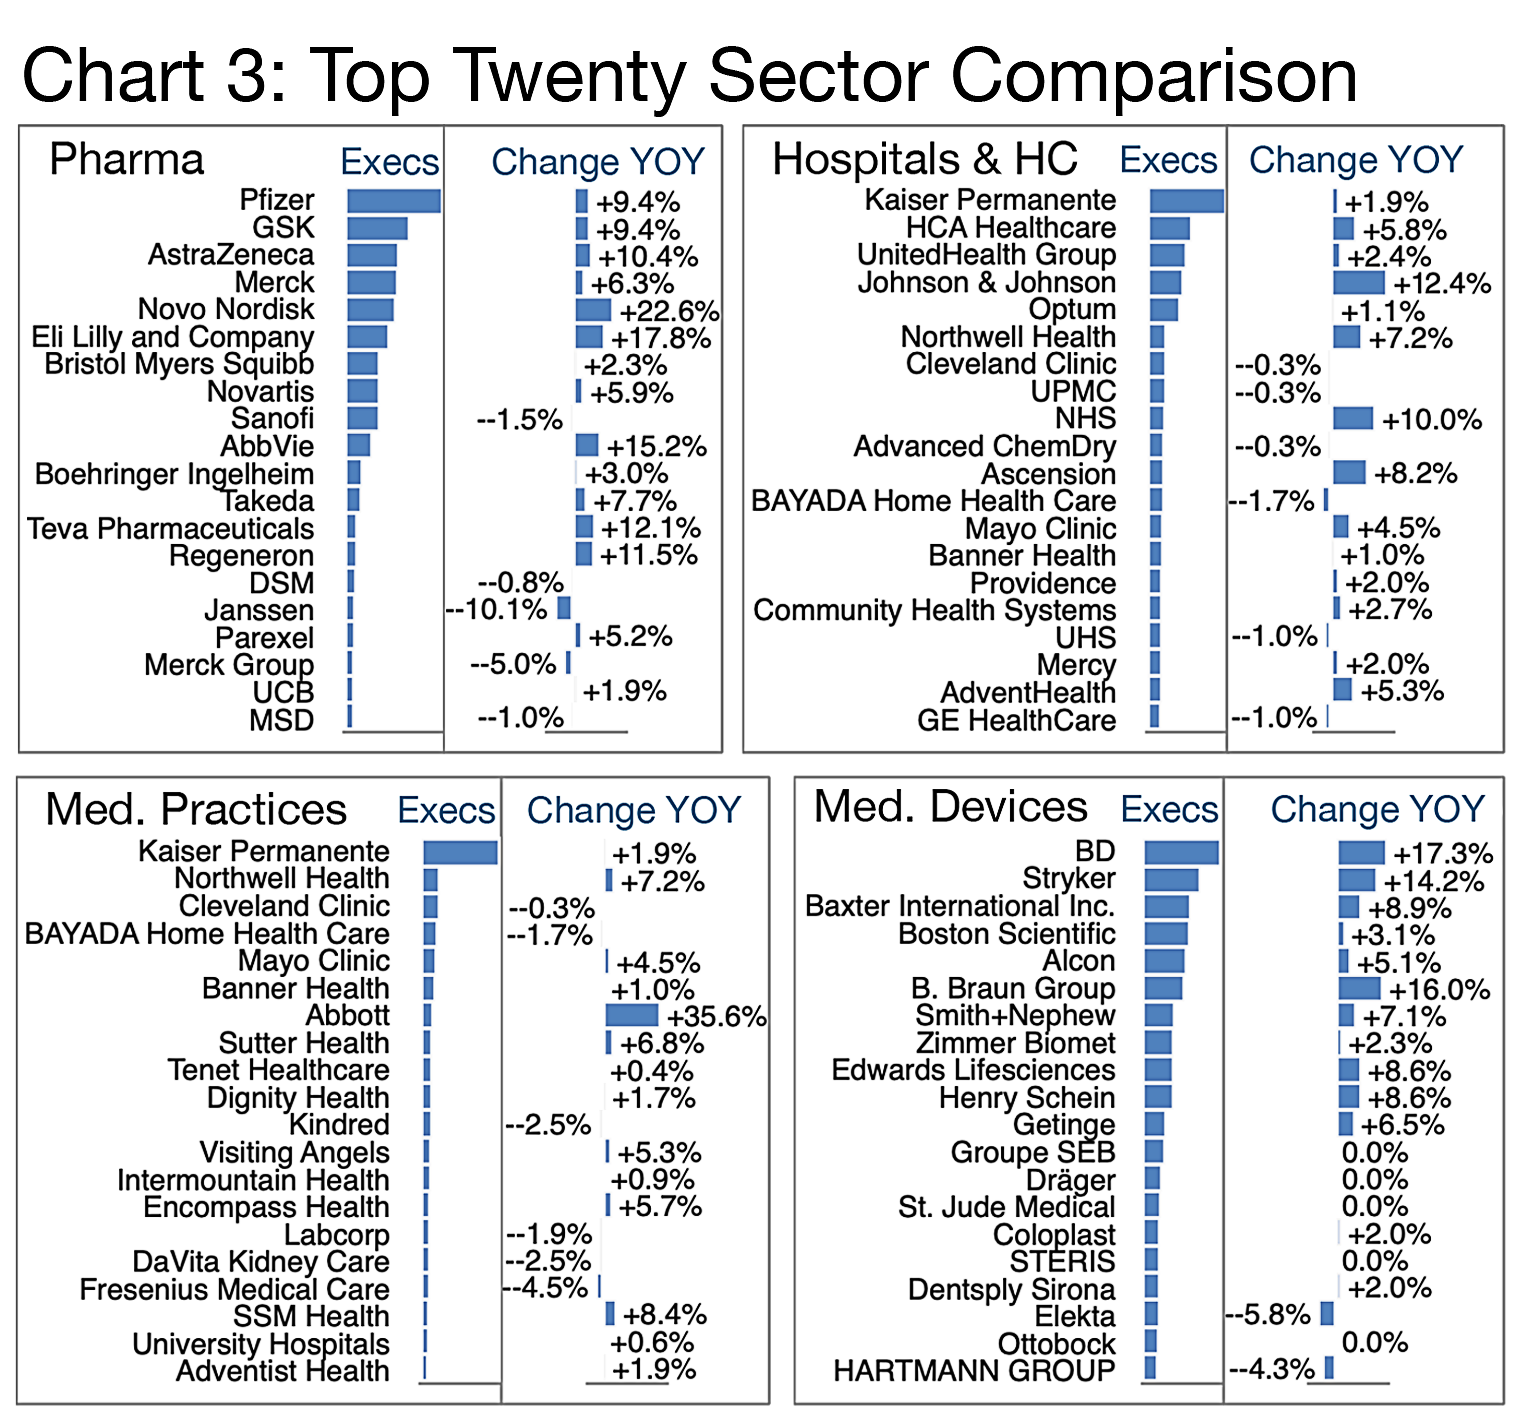
Kaiser Permanente shows up in multiple segments as do a few others. While most of these players are in private hands or public companies, NHS refers to Britain’s national health service. Suffice it to say, the term ‘heterogeneous’ captures the industry well.
Executive headcount growth such as Abbott’s (+35.6% per Chart 3) typically does not come organically, and that is indeed the case. The company has reportedly made 27 acquisitions since 1999, including Bigfoot Biomedical and Cardiovascular Systems in 2023. [See source.]
Novo Nordisk’s exceptional growth (+22.6%) may well come from its wildly popular Ozempic and Wegovy products as well but it undoubtedly also derives from a number of recent acquisitions including Cardior Pharmaceuticals, Embark Biotech, and Biocorp—all in 2023 or 2024. [See source.]
Medical devices are also seeing their share of M&A activity. Just the top five in the last two years came in at over $25 billion in deal value. For example, Johnson & Johnson, Becton Dickinson and Co. (BD), Thermo Fisher Scientific, and Ingersoll Rand all executed significant acquisitions ranging between $2.5 billion and $13 billion between 2023 and 2024. [See source.]
Executive Specializations
Chart 4 collects the special skills that industry executives list on their LinkedIn profiles. In many industries the bulk of skills appear to be rather generic and transferable from industry to industry. In this case, however, most of these specializations are highly technical and require an industry-relevant background; only a few such as Life Coaching and New Business Development appear to provide a generalist route into this industry.
The demand column highlights the specializations for which help-wanted ads were posted on LinkedIn in the last year. This suggests that Healthcare Management (16% of help-wanted ads), Quality of Care (8%), Managed Care (7%), etc. are the skills most in demand. We encourage executives to recognize that in most industries this “published market” is only the tip of the iceberg. In general, 75% of The Barrett Group’s (TBG’s) clients land through what we call the unpublished market—positions so new they have not yet been advertised. In any case, Chart 4’s demand figures probably greatly understate the demand in this industry.
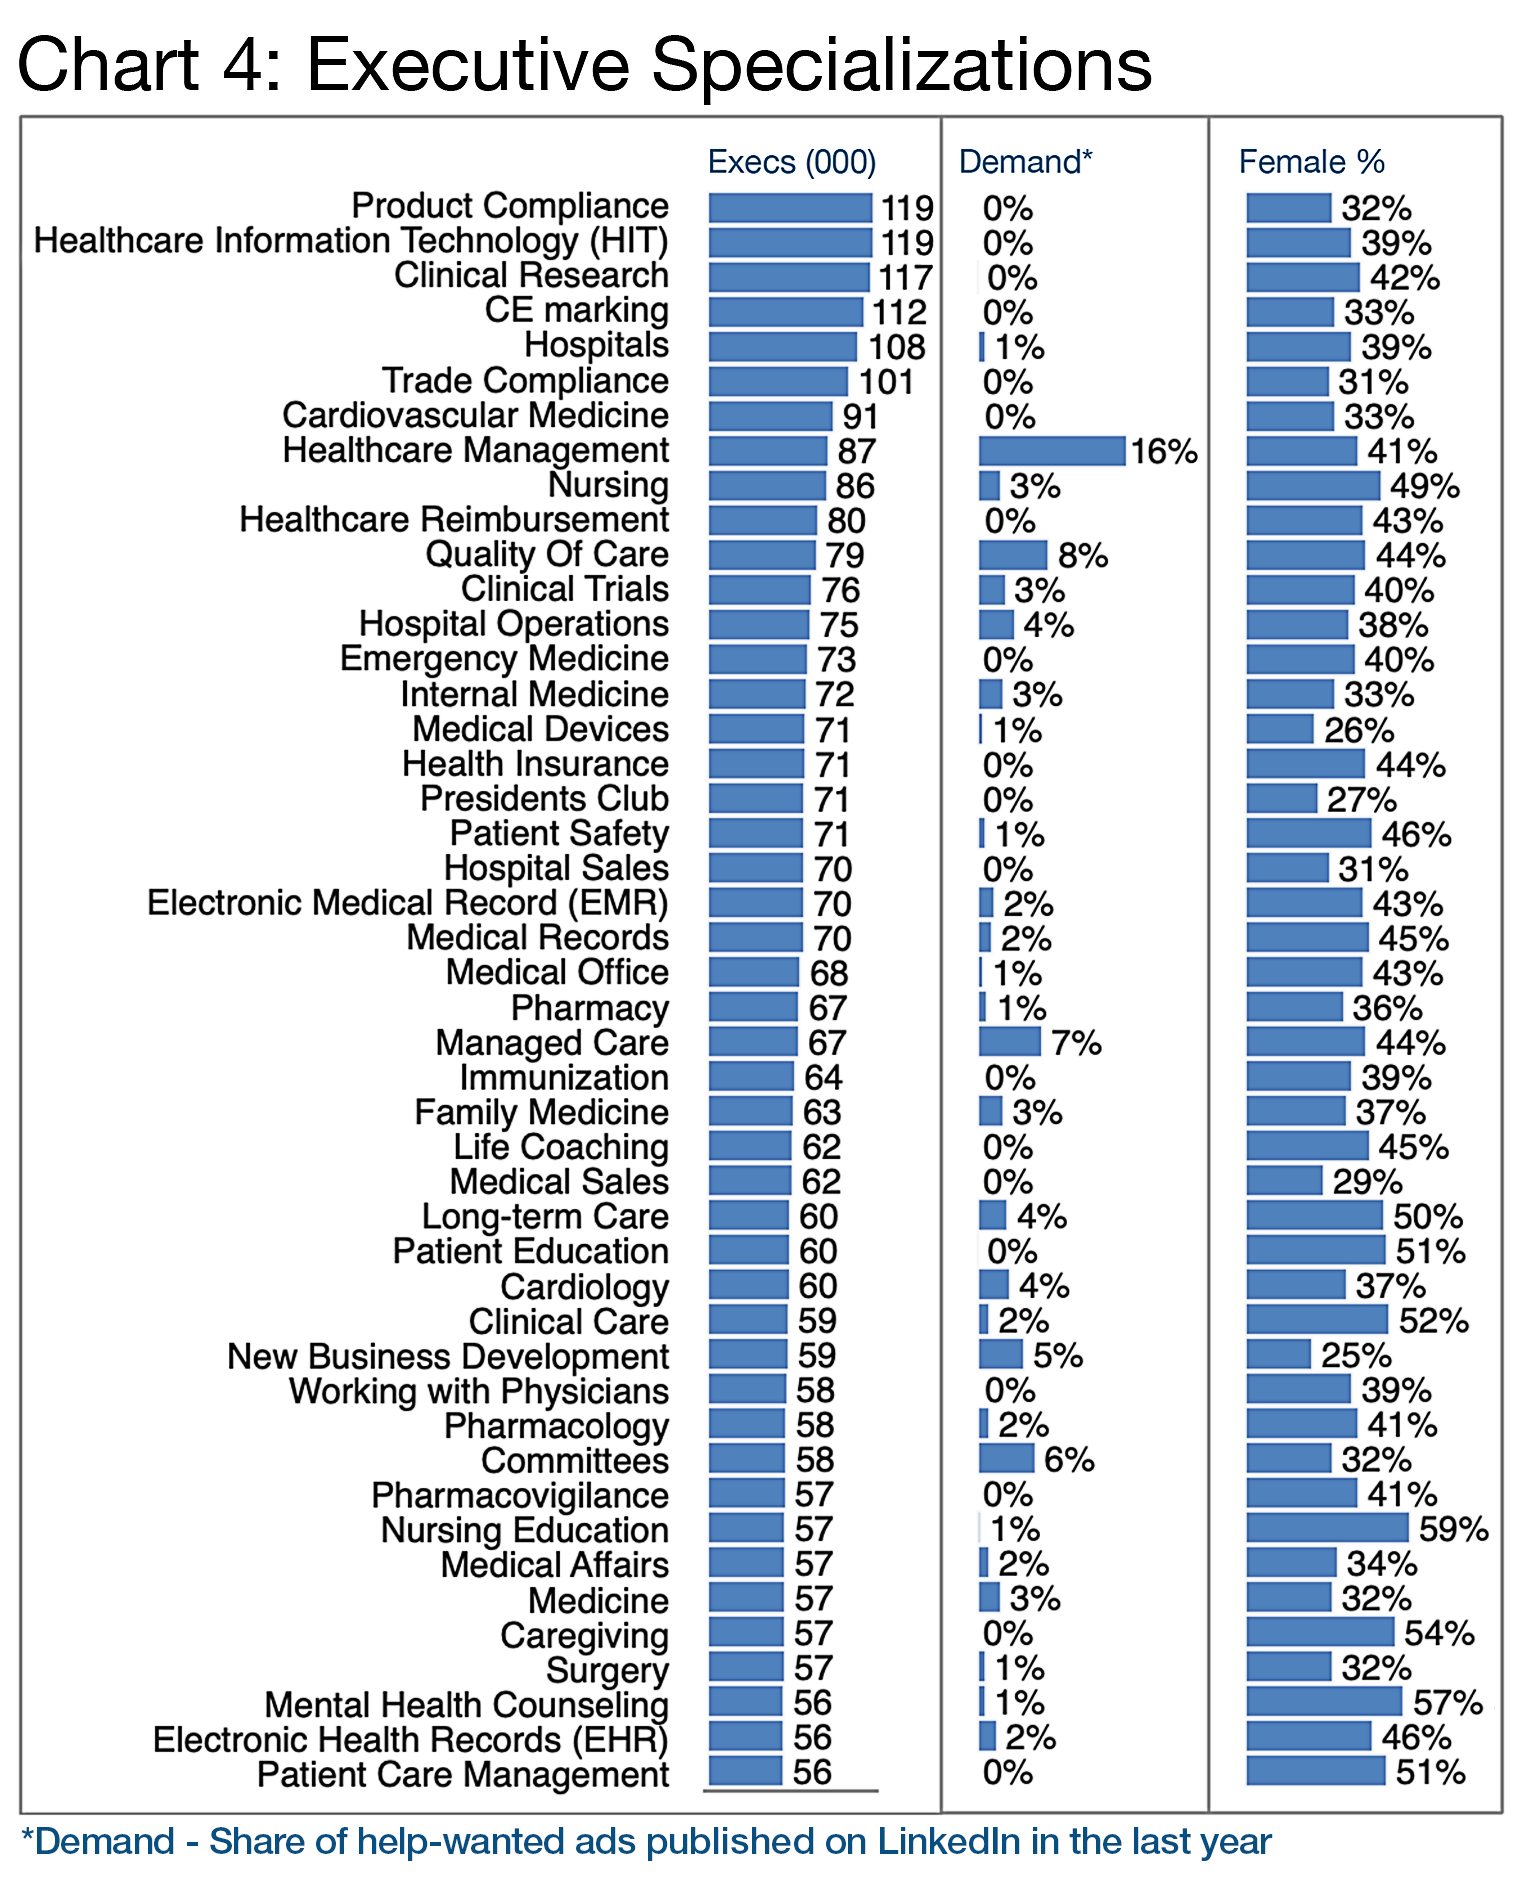
Chart 4 also sheds some light on which specializations are currently most relevant for female executives. Nursing Education (59% female) and Mental Health Counseling (57%) certainly stand out in this regard, as do Caregiving (54%), Clinical Care (52%), Patient Care Management (51%), Patient Education (51%) and Long-Term Care (50%).
Judging by this description of an executive leadership certification for the health care industry, there are probably also many less specialized roles available in this industry: “topics covered will help health care executives, managers, and administrators deal with a variety of issues they experience day-to-day, like finding common ground with finance personnel, finding a solution to health care inequity, dealing with internal departmental conflict, and more.” [See source.]
Executive Employment Locations
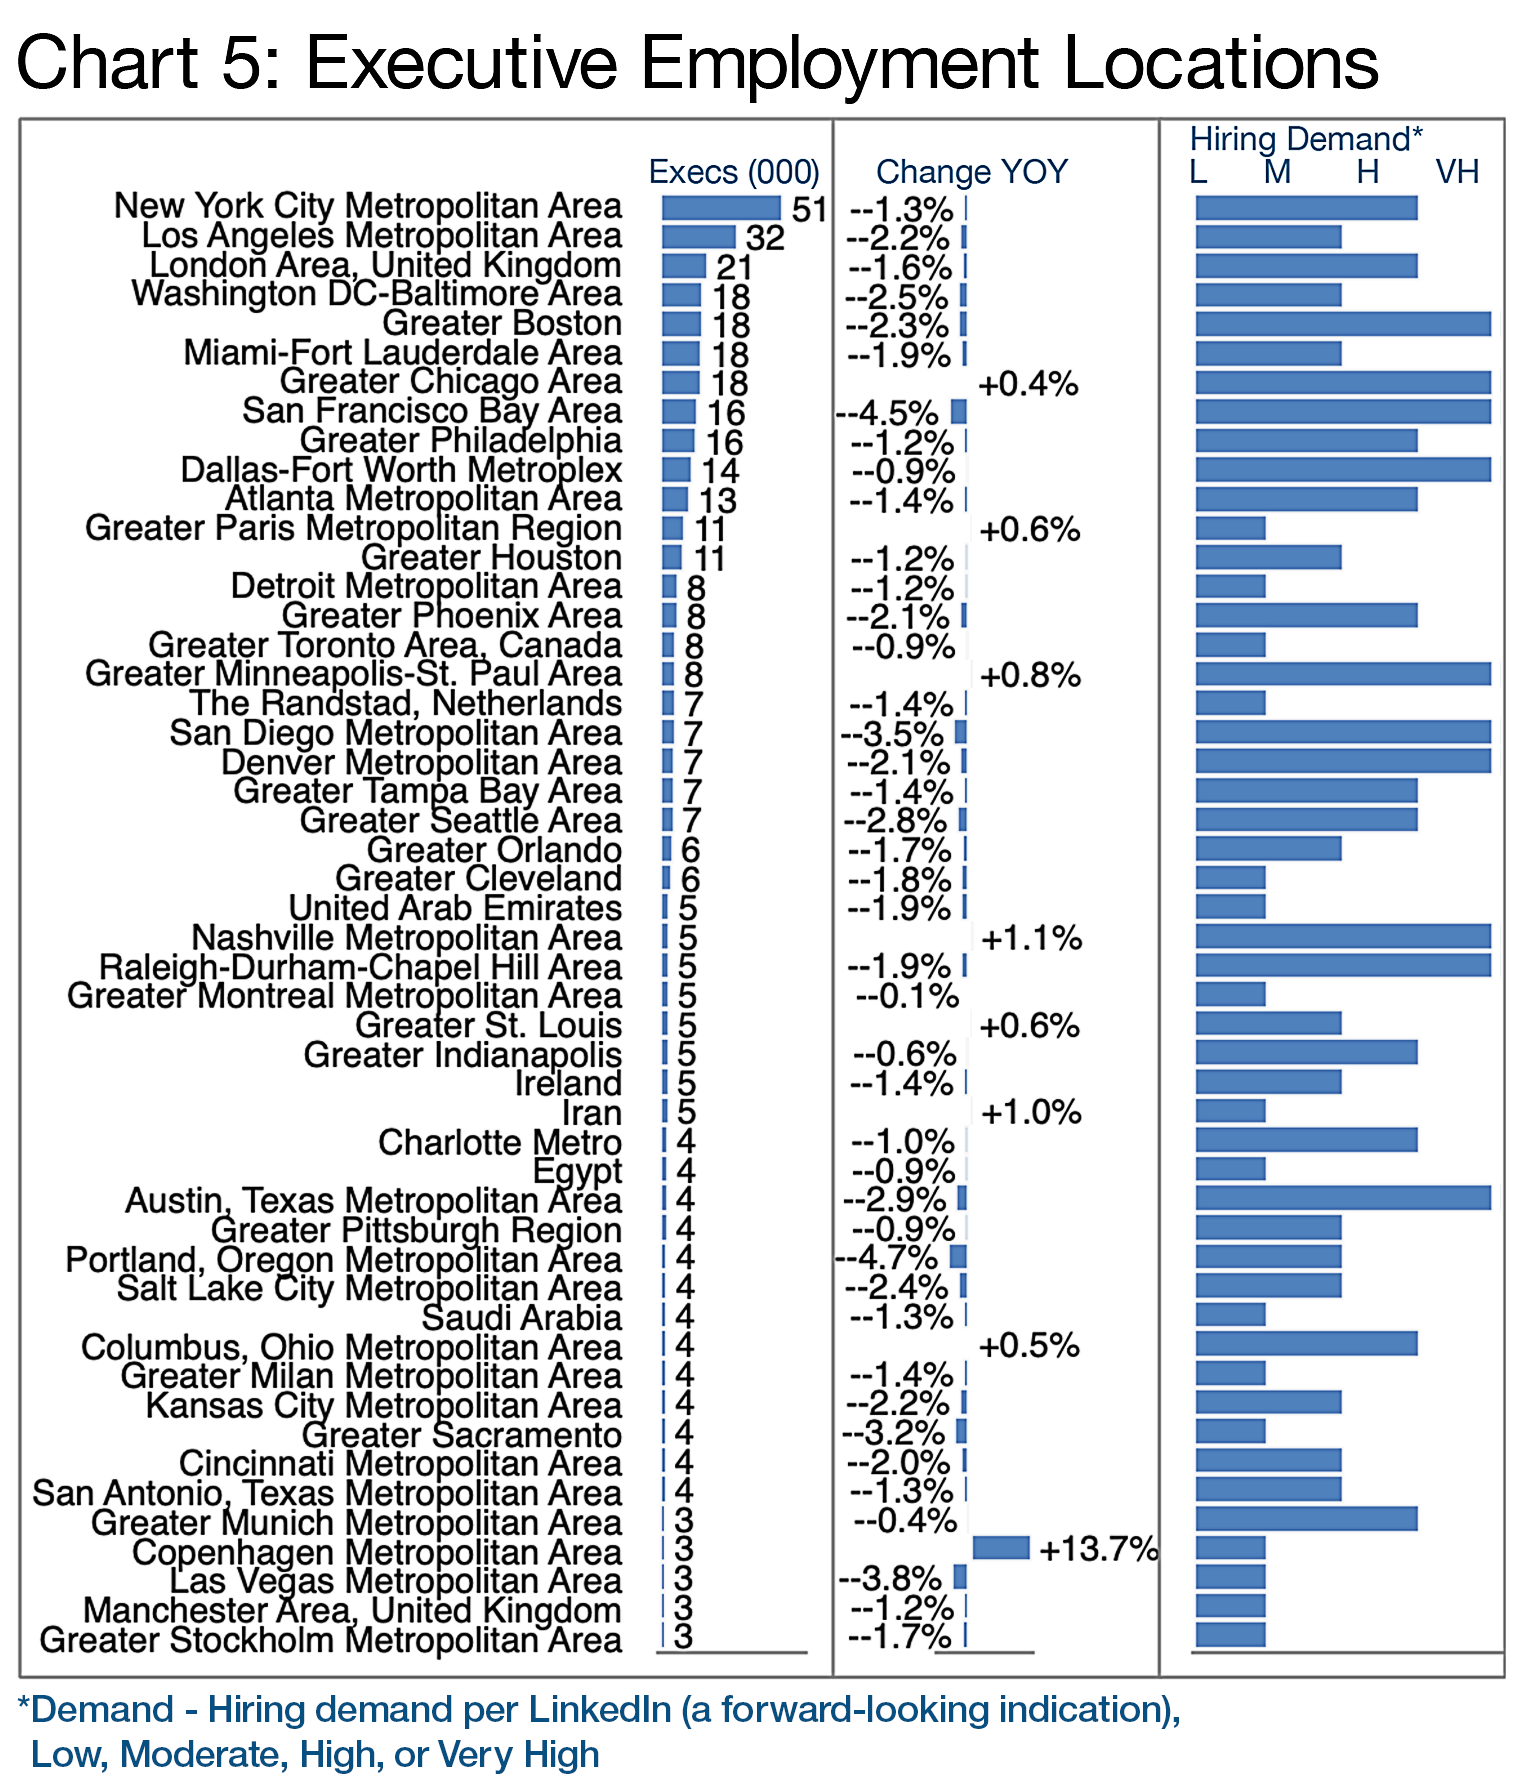
Of course, an industry that is shrinking can reasonably be expected to shrink almost everywhere, and indeed, per Chart 5, that is exactly what’s happening. However, the shrinkage could be due to a lack of demand or a lack of supply. In this case it seems to be very much the latter as indicated by the hiring demand data which in many cases is high or very high per LinkedIn—consistent with the talent shortage noted in the introduction.
Editor’s Note:In this Update “executives” will generally refer to the Vice President, Senior Vice President, Chief Operating Officer, Chief Financial Officer, Managing Director, Chief Executive Officer, Chief Marketing Officer, Chief Information Officer, Managing Partner, General Counsel, Head, President and Director titles principally located in the US, Canada, Europe, the UK, and/or the Middle East. Unless otherwise noted, the data in this Update will largely come from LinkedIn and represents a snapshot of the market as it was at the time of the research. Is LinkedIn truly representative? Here’s a little data: LinkedIn has more than 1 billion users. (See source.) It is by far the largest and most robust business database in the world, now in its 20th year. LinkedIn Talent Insights data is derived by aggregating profile data voluntarily submitted by LinkedIn members. As such, LinkedIn cannot guarantee the accuracy of LinkedIn Talent Insights data. |
Peter Irish, Chairman
The Barrett Group
Click here for a printable version of INDUSTRY UPDATE: Health Care


