INDUSTRY UPDATE: Health Care – December 2022
Introduction: Health Care
As much as we might all prefer to see Covid-19 in the rearview mirror, it is not yet behind us. Coupled with increased infection rates from flu, the winter of 2022/23 will probably see resurgent strain on health care providers as they struggle to manage a lack of trained personnel, confusing health directives from public authorities, anti vax rhetoric on social media, and many other challenges. Specifically, nurse shortages, rising physician retirement rates, support personnel turning to more lucrative or less stressful professions, and extreme variations from one region to another will also complicate the life of health care professionals in the coming years. (See source)
Yet there are some solutions on the horizon, for example:
Better use of health data as wearables and big data analytics permeate the health space.
- Patients will have more options for telehealth and home health care.
- We are likely to see an increased focus on mental health care. (See source)
- More integrated patient data through electronic health records can improve overall health maintenance.
- Remote monitoring utilization will aide prevention and seems likely to expand. (See source)
- Many countries and local authorities are reexamining how public health systems responded to the Covid-19 challenges to avoid failures in the future. (See source)
Taken together, change in the industry seem inevitable and there is clearly a role for medical technology or “MedTech” to enhance health services. (See source) Apparently health care investors are also planning to continue investing:
“A recent survey of leaders of private equity firms by McDermott Will & Emery and WSJ Intelligence, part of The Wall Street Journal, found that 40% of respondents had the most interest in investing in healthcare IT and telehealth in the next three years, followed by 37% interested in partnerships with large health systems.”
So, as we say, expect change. And whatever change comes, it will require skilled executives to manage the transitions and deployment of new approaches, increasingly many executives without medical backgrounds.
The same source continues…
“Nearly three-quarters agreed that “the health care sector was ripe for structural change prior to the onset of the pandemic, which has accelerated opportunities for investing in new modes of health care delivery.” (See source)
Robotics, for example, may also play a growing role in how health care is delivered—beyond the remote surgery technology already in use. In fact, six specific uses of robotics in the field include. (See source)
- Nursing (in place of human nurses)
- Sanitation
- Exoskeletons
- Companions
- Doctors and coaches
- Microrobots
The Healthcare Executive Market
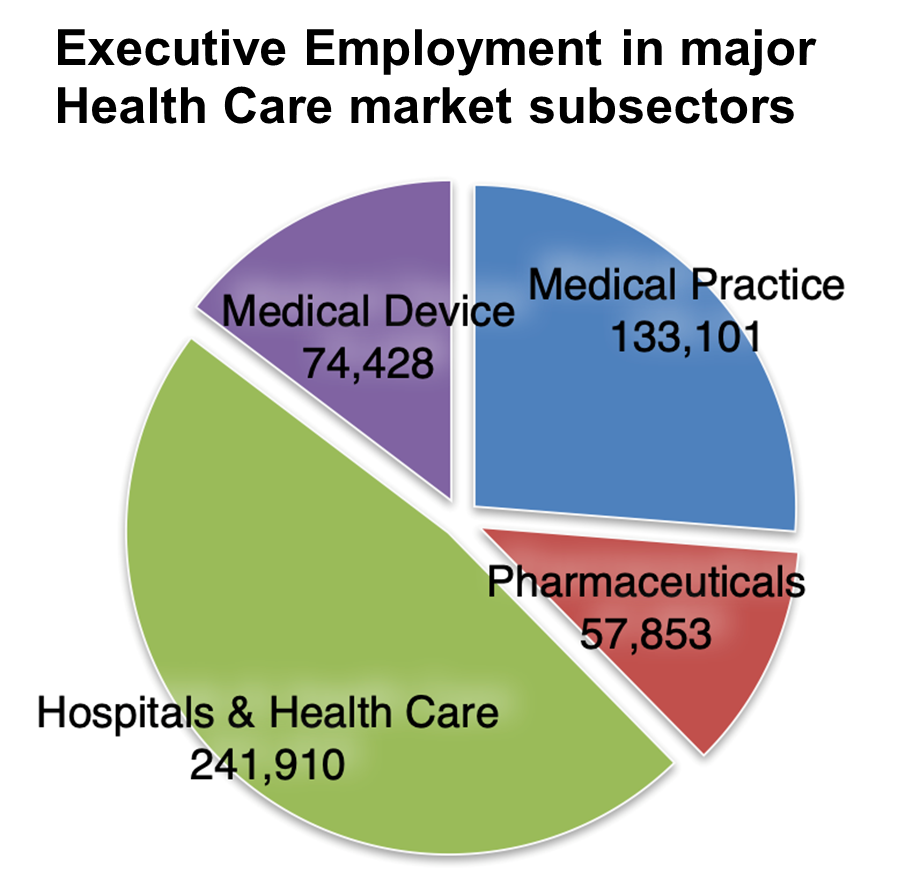
As we define executives (see Editor’s Note) within the bounds of the US, UK, EU, and Middle East geography, and four key fields, i.e.,
- Hospitals & Health Care,
- Medical Devices,
- Medical Practice, and
- Pharmaceuticals
we are talking about approximately 500,000 executives in this Update, a group that has grown little (0.5%) in the past year, but seen almost 4% change jobs—a relatively high “churn” compared to other industries. This churn was highest in the Hospitals & Health Care segment and lowest in the Medical Practice area.
As we have noted before, at 34% the female executive population share in this industry is decidedly higher than most, but also varies considerably by subsegment. See Chart 1.
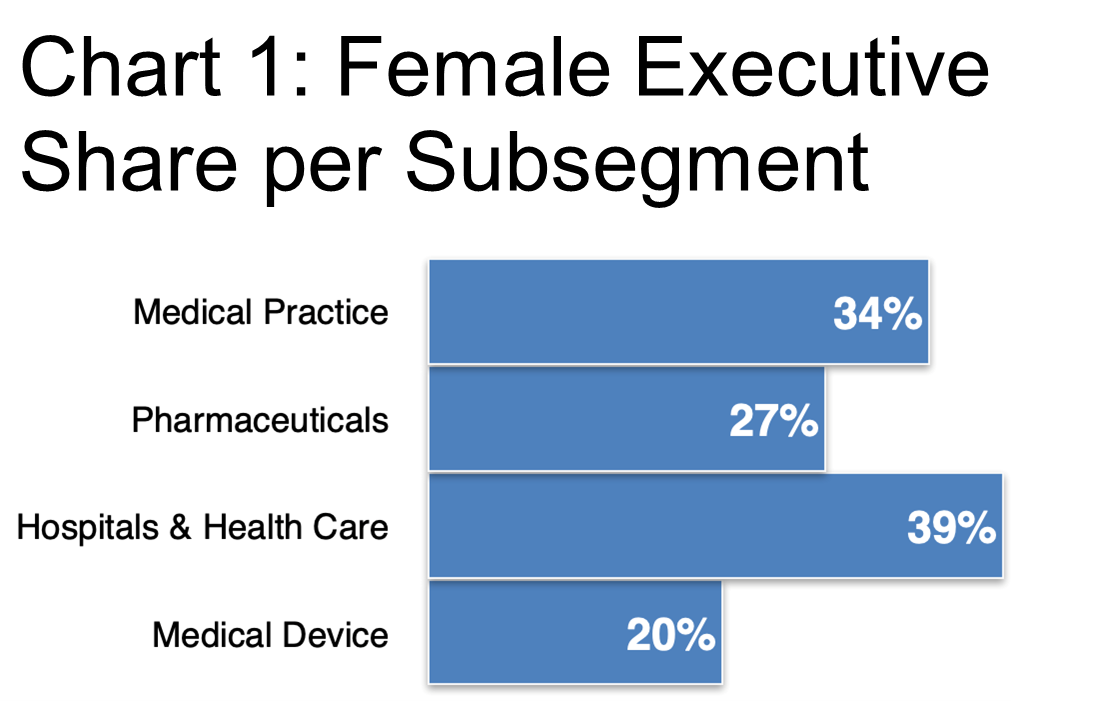
Of course this share varies further by location and specific role. We will explore this trend further in the subsequent charts.
In Chart 2 we provide an overview of executive employment per subsegment as well as the respective female executive shares.
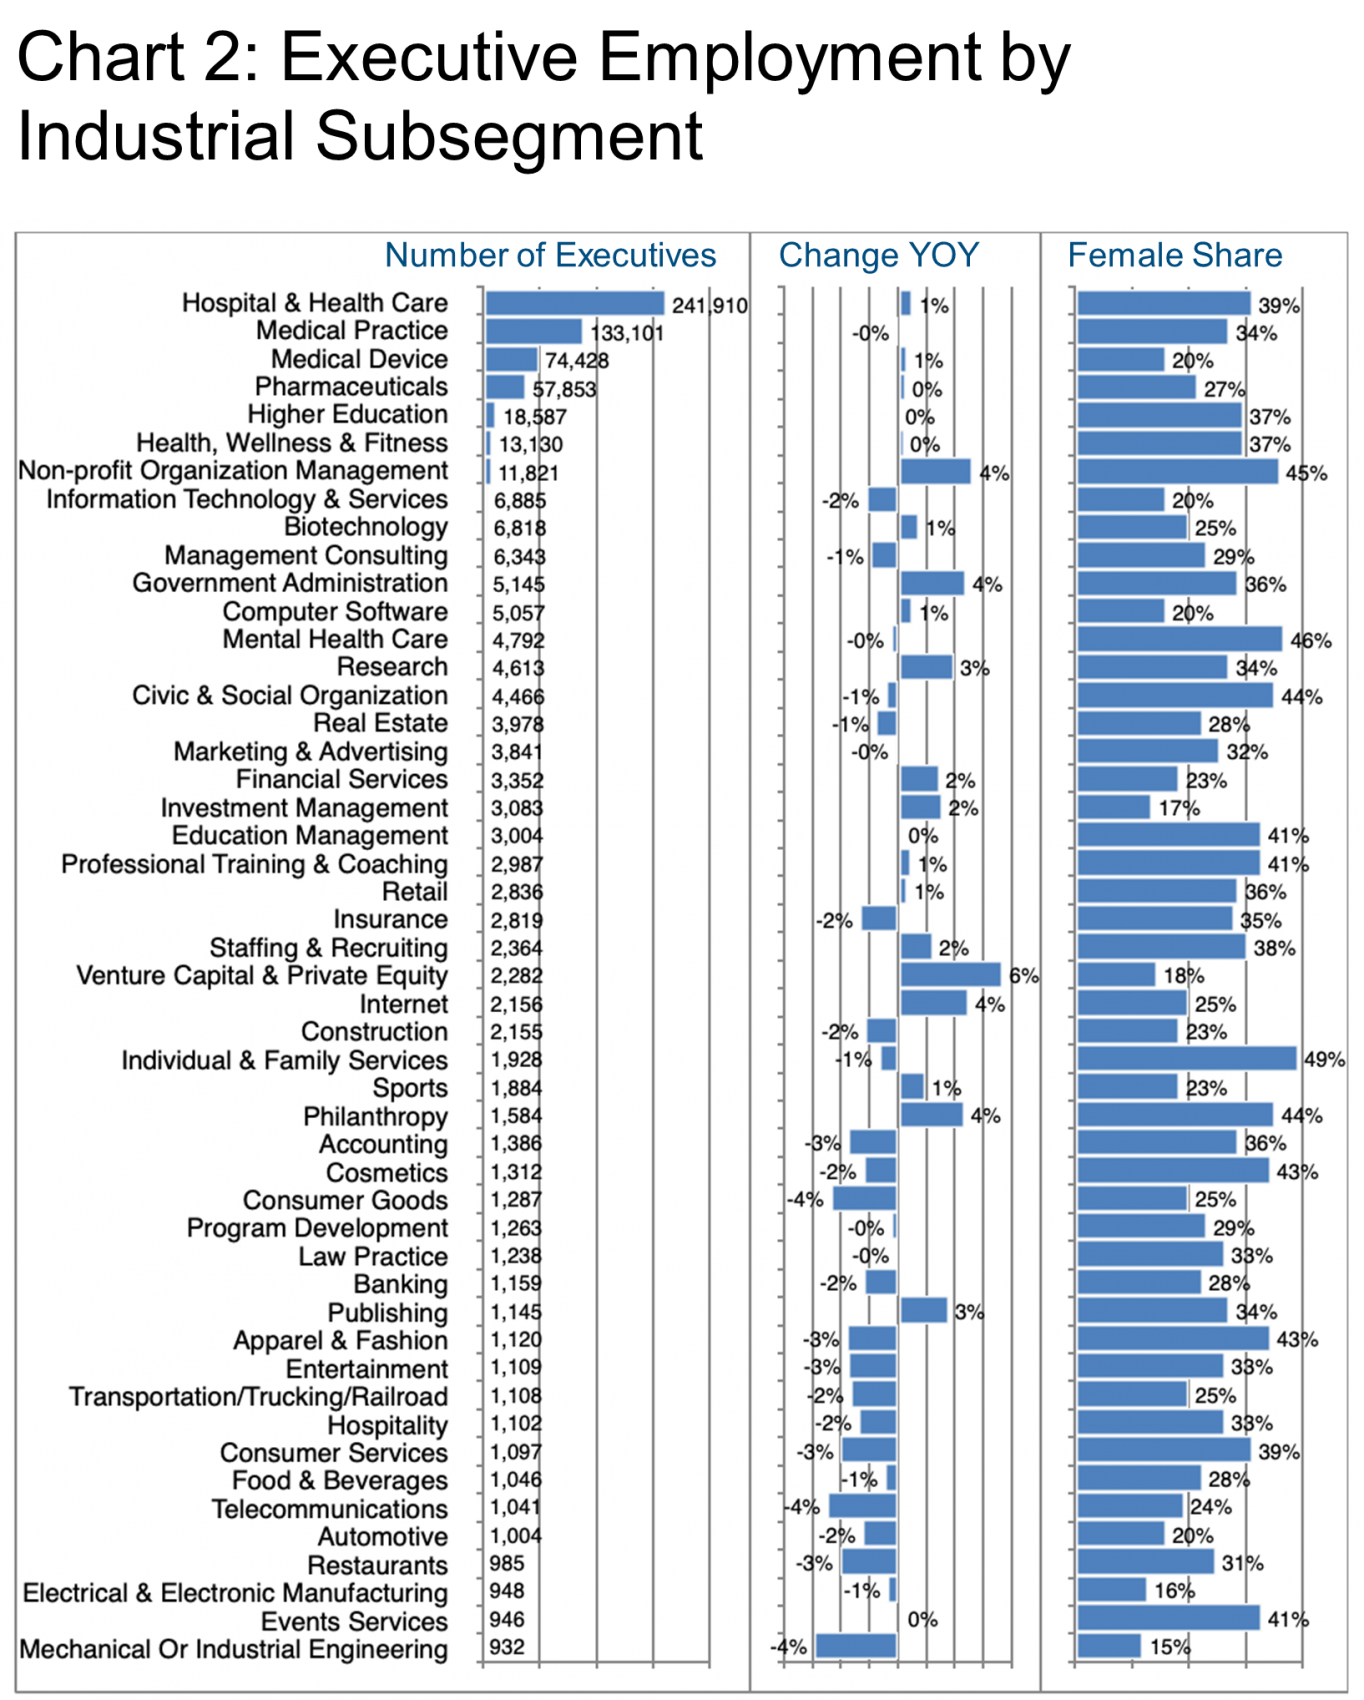 Per Chart 2, the entire industry exhibits low growth, but bright spots in terms of percentage growth appear in Private Equity & Venture Capital (PE & VC, +6%), Non-profit Organization Management (+4%), Government Administration (+4%), Internet (+4%), and Philanthropy (+4%)—generally areas with a high female executive share (except PE & VC).
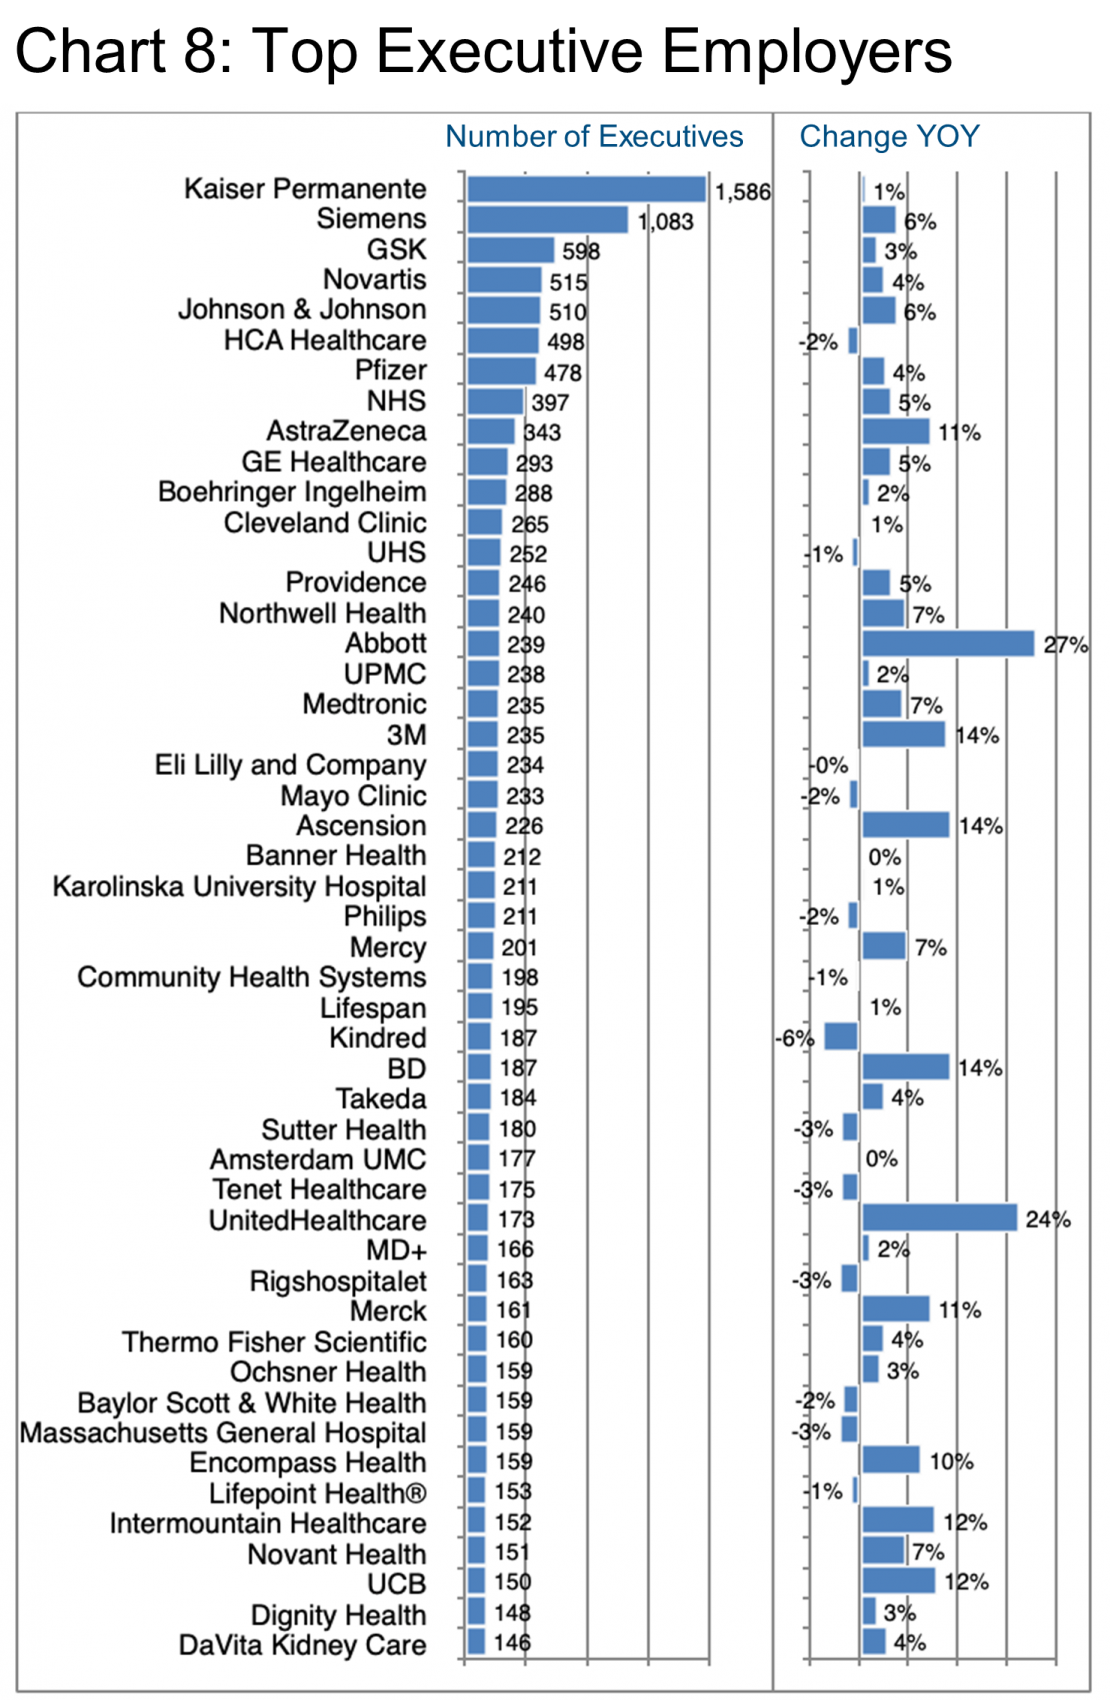
In terms of the largest volume of executive roles, these constitute the top players overall:
- Kaiser Permanente – 1,585, +1% YOY
- Siemens – 1,083, +6%
- GSK – 598, +3%
- Novartis – 517, +4%
- Johnson & Johnson – 510, +6%
In the top four subsegments, we find the following largest employers of executives:
- Hospitals & Health Care – HCA Healthcare, NHS, Ascension
- Medical Practice – Kaiser Permanente, Northwell Health, Mayo Clinic
- Medical Device – Siemens, GE Healthcare, Medtronic
- Pharmaceuticals – GSK, Novartis, Pfizer
As readers of these Updates know, executives on LinkedIn tend to highlight more than one specialization in their profiles, so the numbers in Chart 3 will likely exceed the total number of executives. Nevertheless, they provide a snapshot of what all of these senior managers actually do day to day.
Certainly, there are many specializations requiring a medical background in this list but there are also numerous roles that do not require a medical degree that may also be highly transferable into or out of this industry. As we noted in the introduction, the digitization of health care is well underway with all of the usual needs for big data analytics and infrastructure (e.g., Healthcare Information Technology, Electronic Medical Records, Analytical Skills, Electronic Health Records, etc.). Taken together, these represent more than 100,000 executives from Chart 3, certainly with some overlap, but a significant opportunity for non-medical executives with the right skills.
As far as the female executive share is concerned, it is perhaps not surprising that Nursing comes out high at 59%.
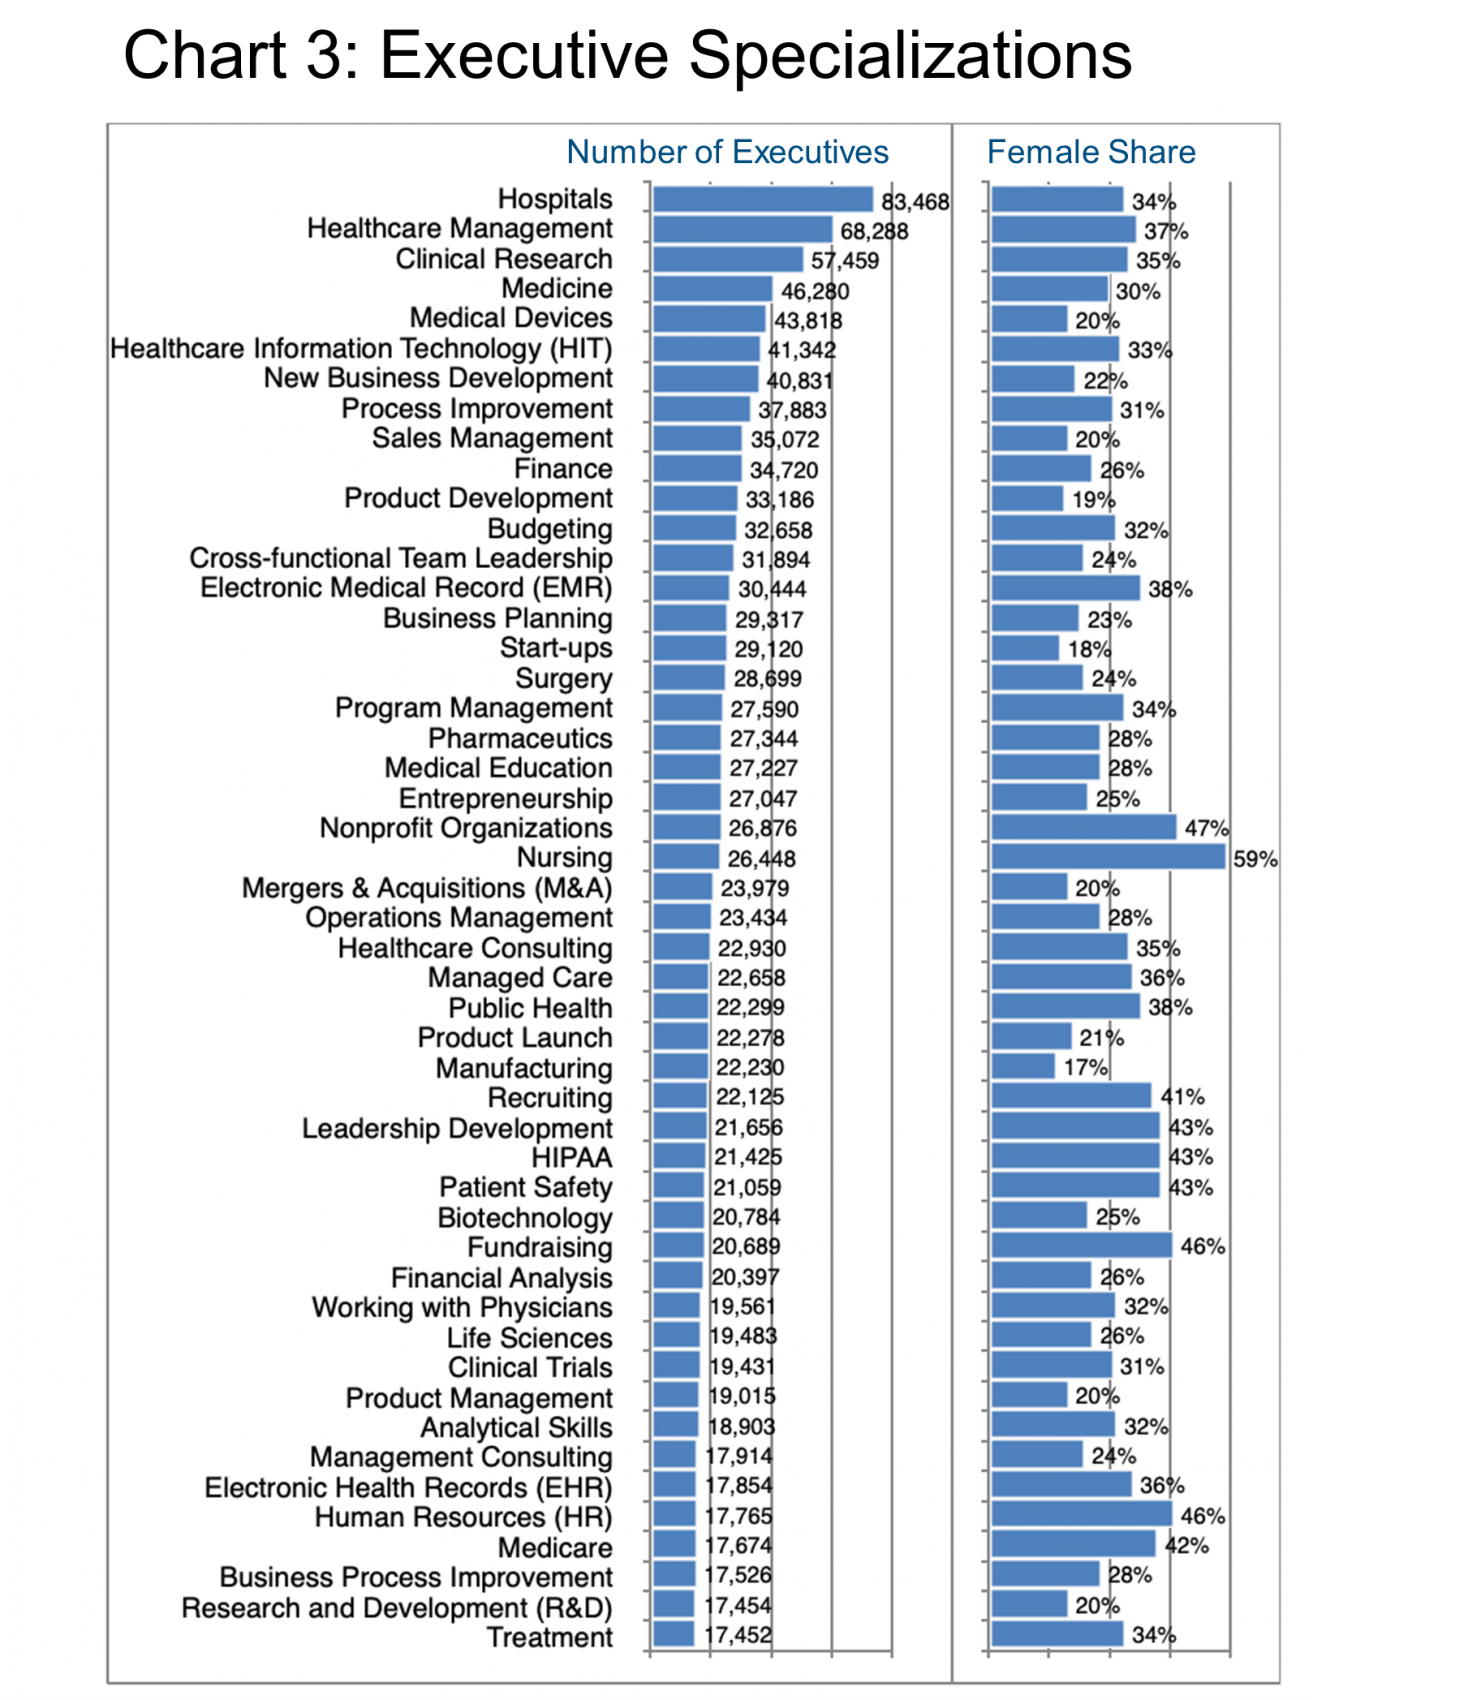
There are numerous other pockets of exceptionally high female executive participation in this overall industry per Chart 3, including Nonprofit Organizations (47% female), Fundraising (46%), and Human Resources (46%), not to mention related areas such as Recruitment and Leadership Development, or more industry specific specializations such as HIPAA and Patient Safety.
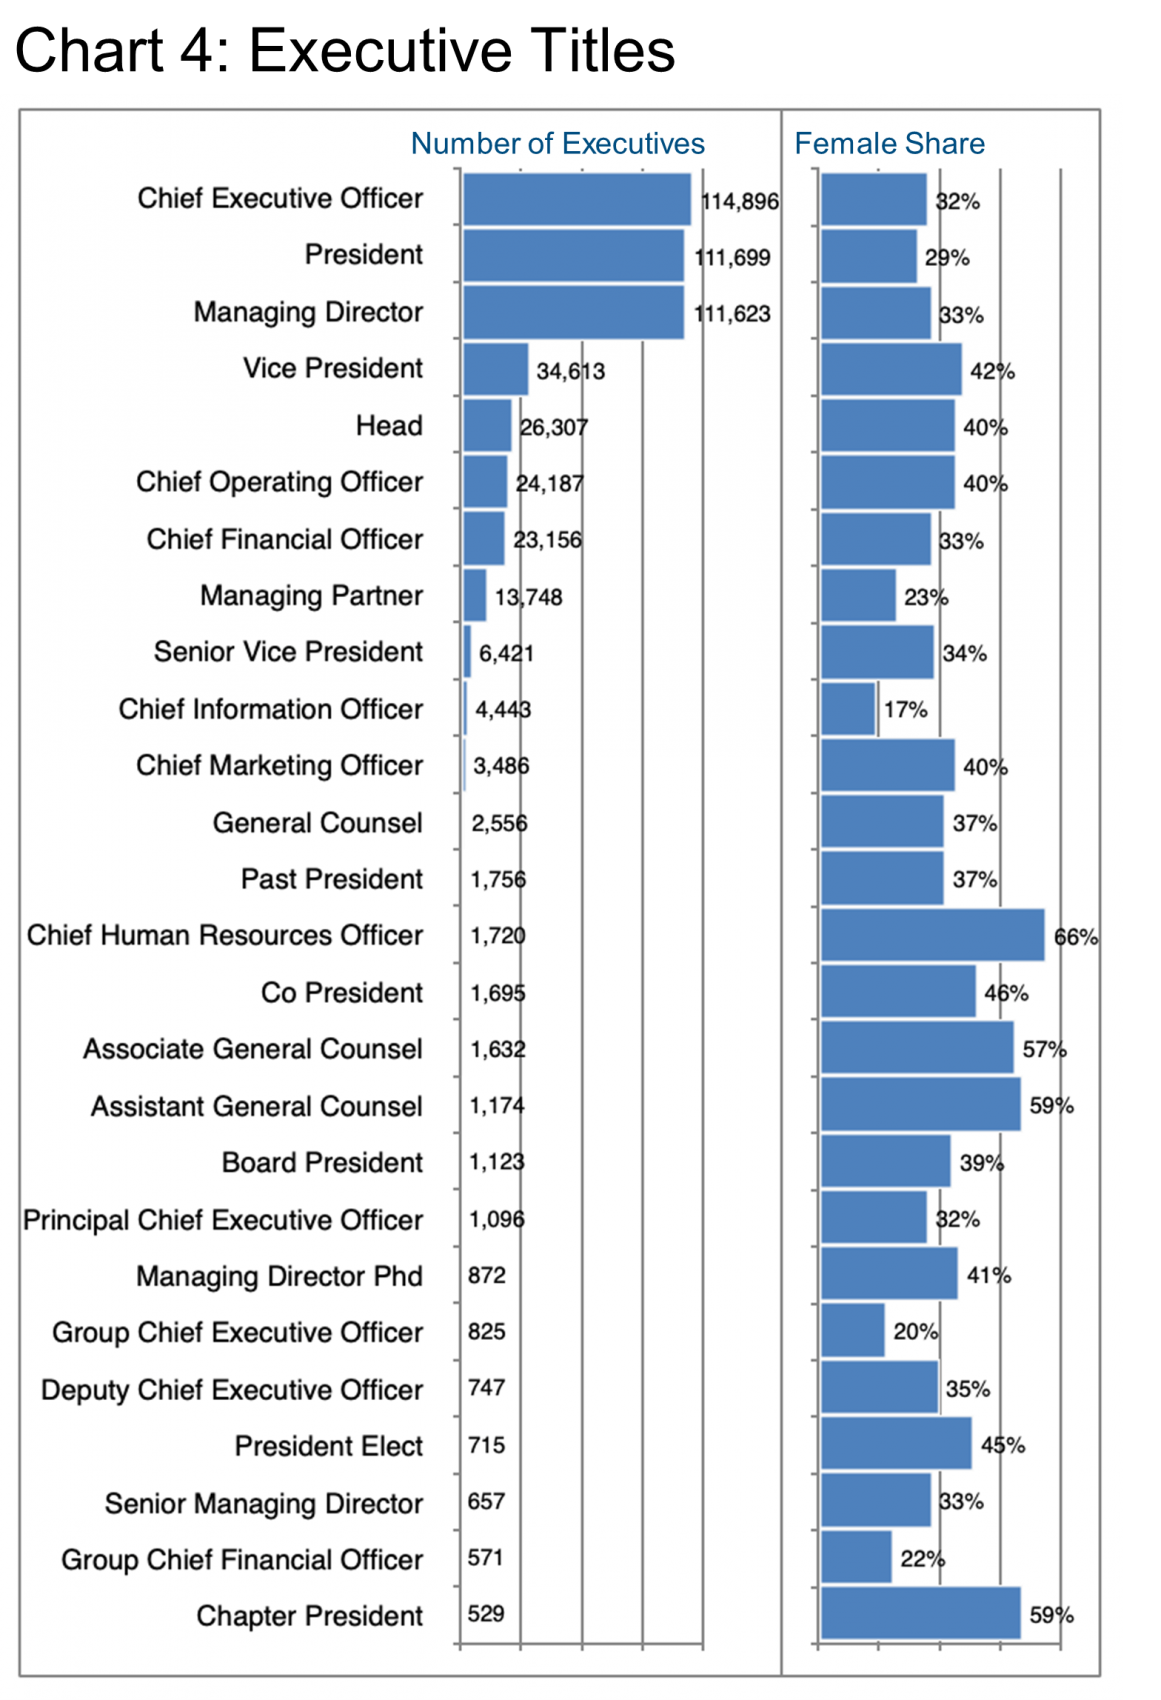
In Chart 4 we examine the title “geography” of this population. Structurally, the Vice President level is much more thinly populated in this industry than in many others while the CEO, President, and Managing Director titles predominate. The gender make-up also rates a mention, peaking in the CHRO role (66%), but also heavily present in the General Counsel area, albeit at the Associate (57%) and Assistant (59%) level, as well as Co-President, 46%; President Elect, 45%, and Chapter President, 59%.
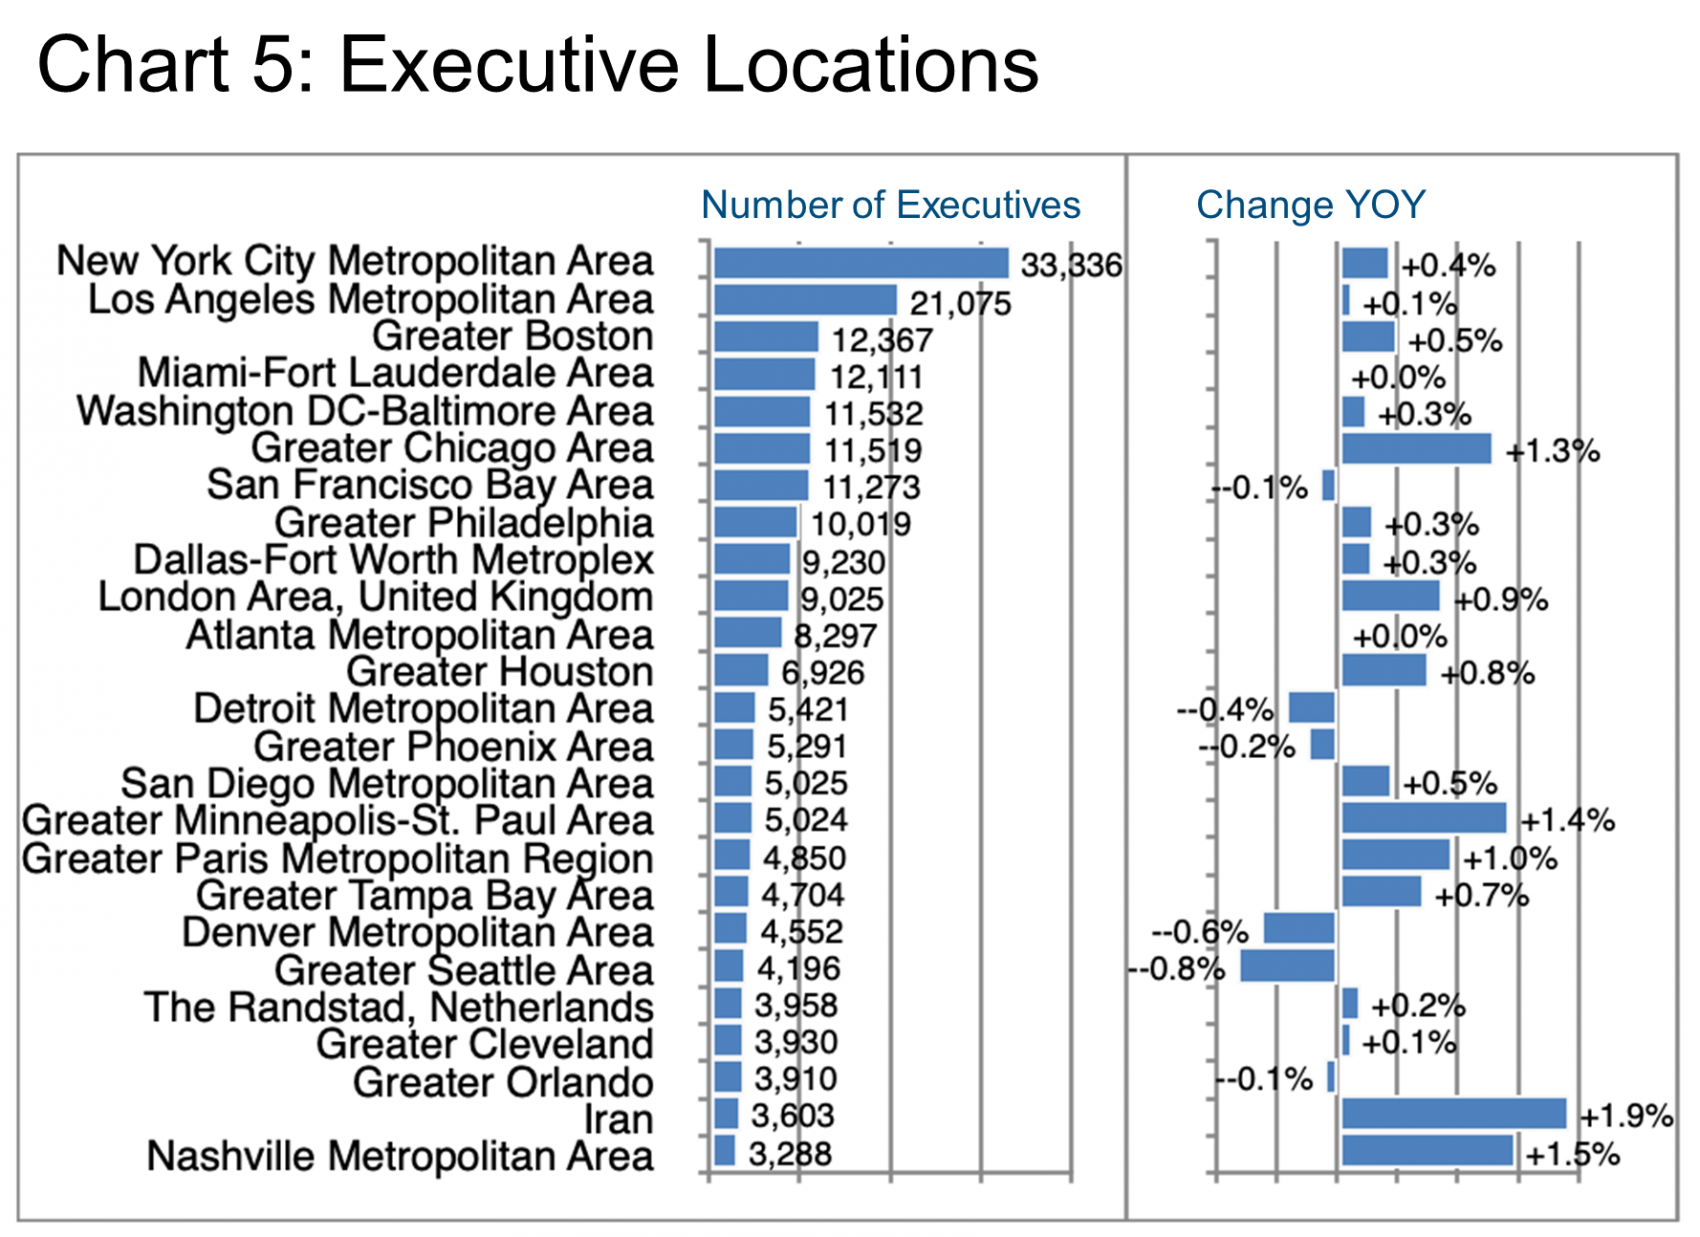
As far as working location is concerned (Chart 5), New York comes out way ahead, again, followed by a relatively familiar group of large US cities.
It is interesting to see some major cities shrinking for a change. Perhaps this is related to what some have described as a significant trend in professionals moving out of major cities and relocating to other, less expensive parts of the country. Nashville, Chicago, Minneapolis, Paris, London, Houston, and Tampa show the highest YOY growth rates (excluding Iran, of course, which is a very specific case).
Often, one major employer in a city can influence the executive population significantly, so here are the major industry players (largest employers of executives) in each of those fastest growing cities:
- Nashville – HCA Healthcare
- Chicago – Advocate Health Care
- Minneapolis – 3M
- Paris – Greater Paris University Hospitals
- London – GSK
- Houston – MD Anderson Cancer Center
- Tampa – BayCare Health System
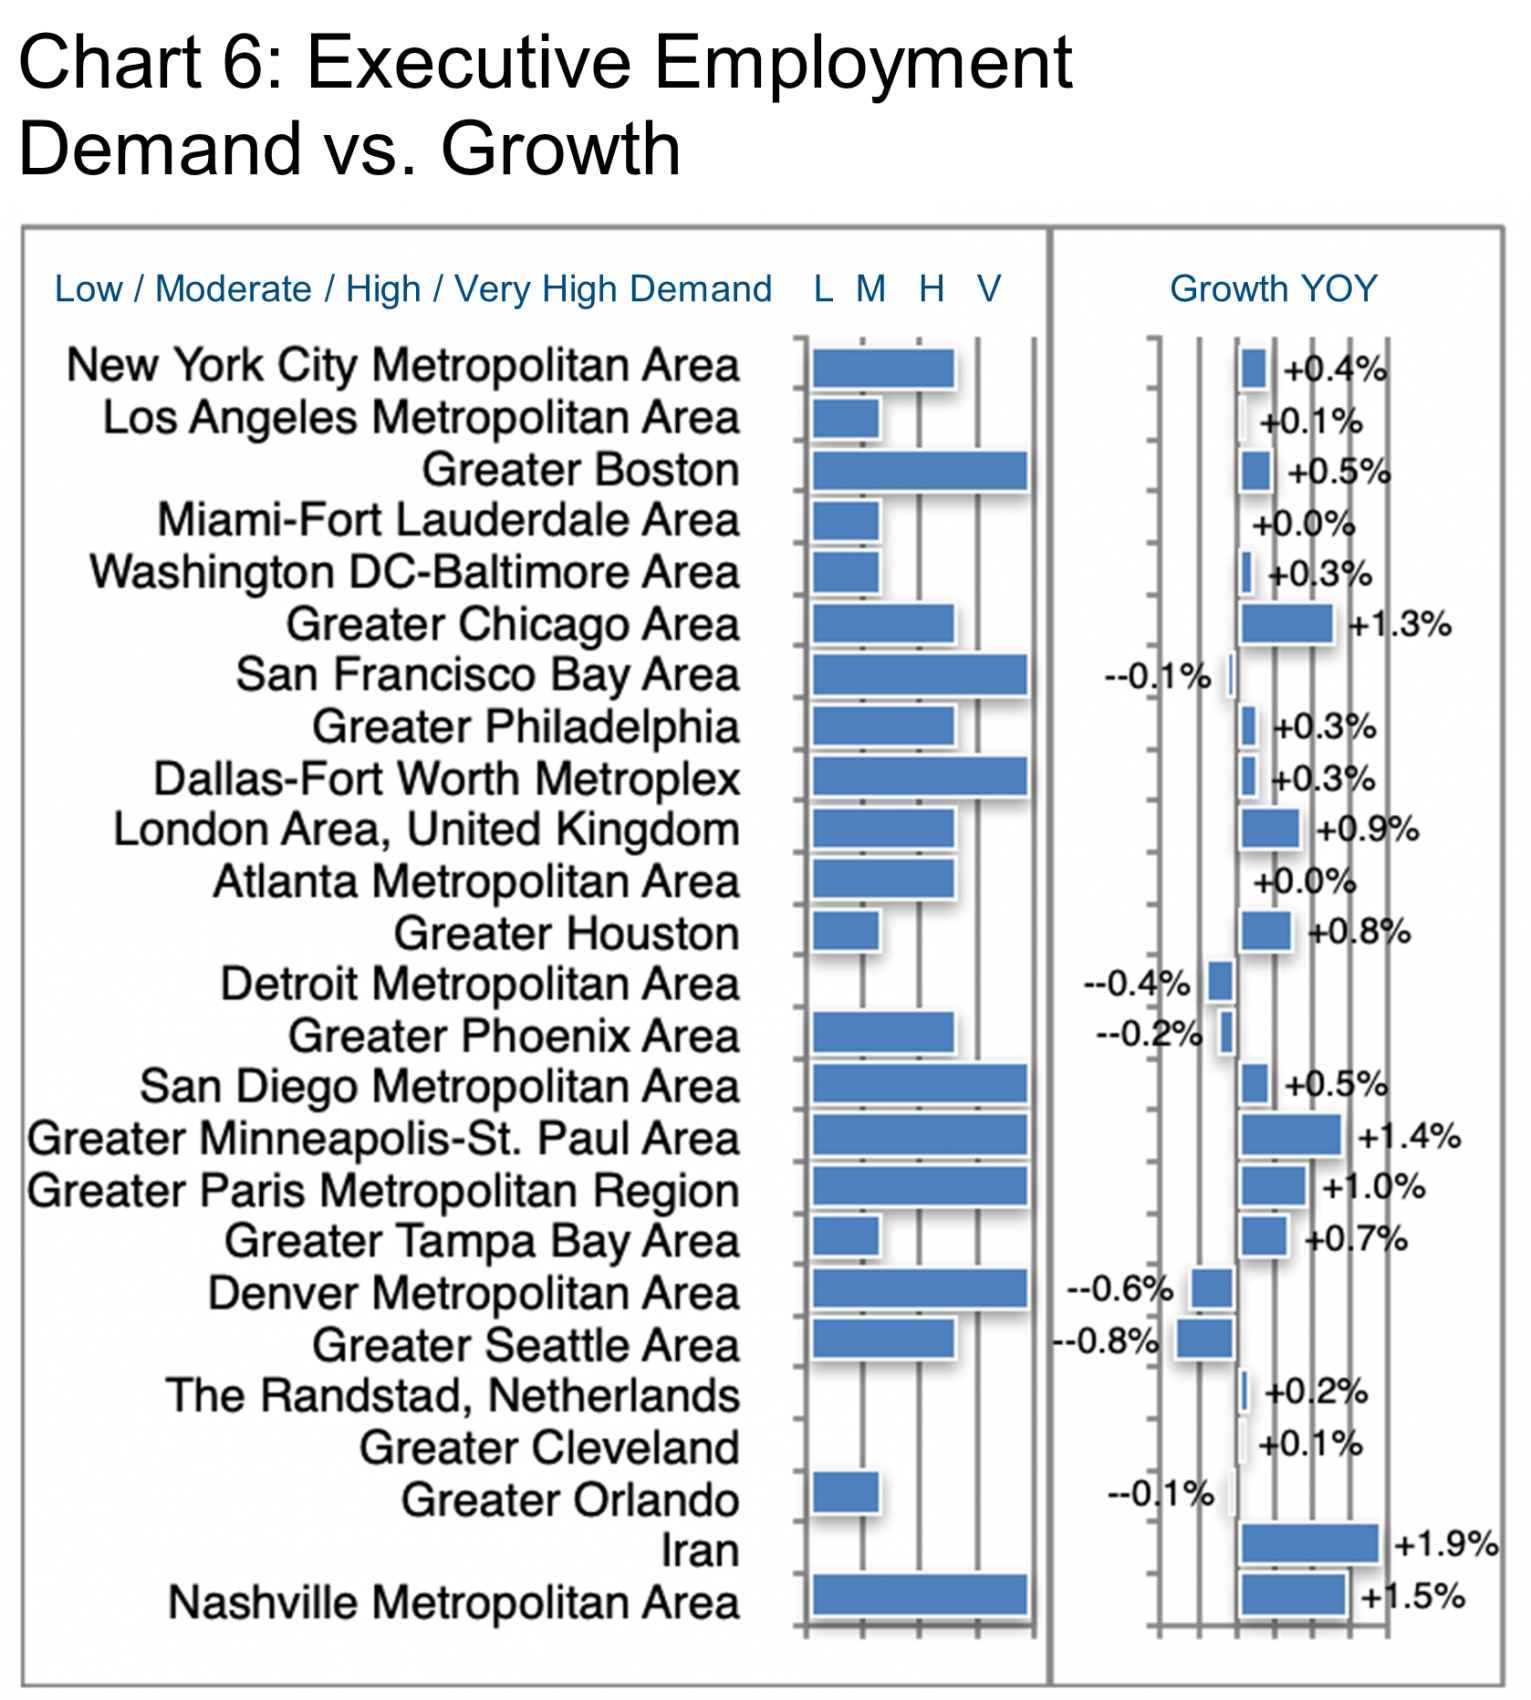
Interestingly, growth and demand do not move hand-in-hand in this industry (Chart 6) as we see from this comparison where the low growth in San Francisco, for example, nevertheless represents a “very high hiring demand” per LinkedIn.
We also hope to illuminate locations outside the US in this Update, so let us consider the growth and demand in other parts of the world (Chart 7) in more detail. Here we have compiled four dimensions into one comparative chart: Number of Executives, Growth YOY, Hiring Demand, and the Female Executive Share.
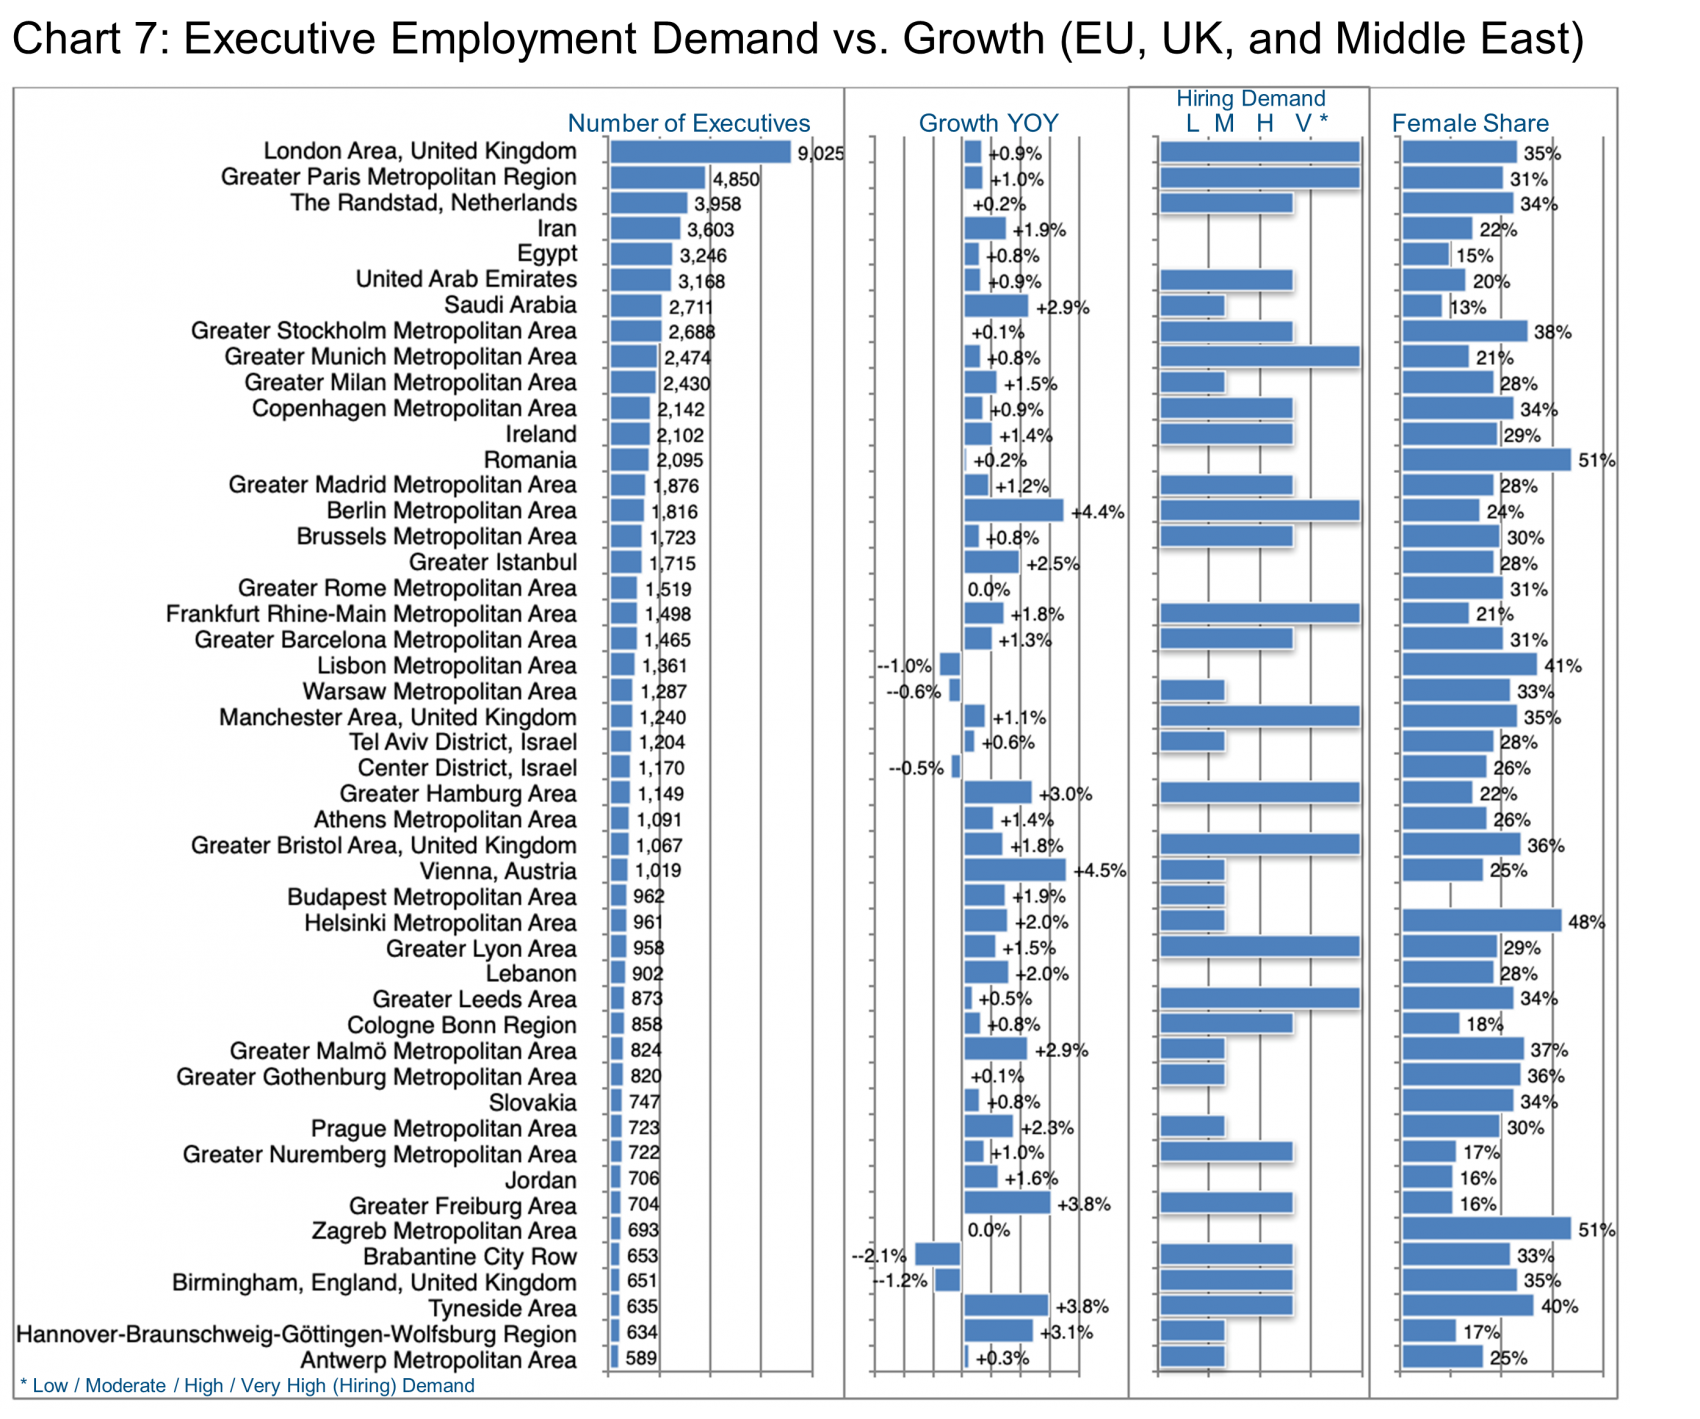
First, London is clearly the largest market in terms of sheer numbers of executives, and although its growth is moderate, the hiring demand remains very high. Paris is similar, though only about half as large.
Second, as far as growth and demand are concerned, while Berlin (+4.4%) and Vienna (+4.5%) both show relatively high growth, only Berlin shows “very high hiring demand” suggesting that perhaps there was a boom in demand in Vienna which has now been fulfilled.
While the UAE and Saudi Arabia demonstrate either good growth or strong hiring demand, given the large infrastructure projects recently announced in the Middle East, such as the new international airport Saudi Arabia intends to build, we wonder whether these historical data really reflect future demand in the region.
Third, the share of female executives is perennially high in the Nordic countries, but obviously also in Central and Eastern Europe.
Readers might wonder, who employs these nearly 500,000 healthcare industry executives. Chart 8 provides an overview of the top 50 as well as their relative growth rates over the last 12 months. Our research team can help candidates to explore specific companies, locations and even the professional histories of targeted executives where this becomes relevant in preparing for an interview.
However, in the context of this Update, let us examine briefly where the executives are coming from who have joined the enterprises in Chart 8. For example, as the largest employer of executives in this space, Kaiser Permanente has recruited talent from Sutter Health, Providence, Dignity Health, CVS Health, and the Cedars-Sinai, just to name the top “donors.”
As the fastest growing example, Abbott has hired from a very broad range of companies including many competitors, but also internet firms such as Carvana. Another fast grower is United Healthcare whose recruitment sources included Humana, Centene Corporation, Aetna, WellMed Medical Management, Blue Cross/Blue Shield, and CVS Health.
In the pharmaceutical area, AstraZeneca has become a household name through its Covid vaccines, so that it had to manage very rapid growth, which it did by hiring from Novartis, Sanofi, Pfizer, Roche, IQVA, Boehringer Ingelheim, and Bayer.
Medtronic from the Medical Device segment supported its above-average growth by hiring from Stryker, BD, Johnson & Johnson, Zimmer Biomet, and Intersect (the last via acquisition).
On the other hand, the large regional hospital operator Ascension stoked its growth through selective retention during the separation from Amita Health, and then acquired additional talent from Baylor Scott & White Health, Beaumont Health, St. David’s HealthCare, Henry Ford Health, and HCA Healthcare.
Our clients receive support from a six-member team including a research specialist who can provide broad-brush screening industry data from our data bases of more than 800 million companies and individuals as well as drilling down into highly granular company, location, and executive-specific information as may be required in preparing for a key interview. Read Research to the Rescue for more information.
Peter Irish, CEO, The Barrett Group
Click here for a printable version of Industry Update – Health Care 2022
Editor’s Note:
In this particular Update “executives” will generally refer to the Vice President, Senior Vice President, Chief Operating Officer, Chief Financial Officer, Managing Director, Chief Executive Officer, Chief Human Resources Officer, Chief Marketing Officer, Chief Information Officer, Managing Partner, General Counsel, Head, and President titles. Unless otherwise noted, the data in this Update will largely come from LinkedIn and represents a snapshot of the market as it was at the time of the research.
Is LinkedIn truly representative? Here’s a little data: LinkedIn has more than 800 million users. (See source) It is by far the largest and most robust business database in the world, now in its 19th year. LinkedIn defines the year-over-year change (YOY Change) as the change in the number of professionals divided by the count as of last year and “attrition” as the departures in the last 12 months divided by the average headcount over the last year.