INDUSTRY UPDATE: Financial Services
Introduction
Frankly, it may be impossible to separate several related industries fairly. This is why we bundle Financial Services, Banking, Insurance, Accounting, Wealth Management, Investment Banking and Capital Markets under the general umbrella of Financial Services.
As one source puts it: “Over the past two years, the financial services industry has demonstrated its ability to successfully navigate unprecedented levels of uncertainty. From real estate to insurance to investment management to banking and capital markets, financial services organizations across the globe faced the pandemic with remarkable resilience and adaptivity, helping people, organizations, and governments get back on their feet.” [See source.]
However, with inflation flaring, labor markets straining, war in the Ukraine, supply chain upheaval in part due to geopolitical tensions, markets in turmoil, the banking sector sporadically wobbling, some sectors downsizing, and consumers feeling insecure—the challenges are hardly behind us.
What should financial service companies do?
The same source continues. “While some organizations may choose the cost-cutting route, others will point toward smarter execution, finding ways technology can be deployed to add value and create superior customer experiences. While some firms may respond to ESG requirements defensively, focusing on doing only what’s required, others will step up and lead, finding opportunities to invest in people and the planet.” [See source.]
In fact, there are good reasons for optimism. As one source puts it: “Globally, the financial services industry saw a CAGR of 9.9% from 2020 to 2021 as it recovered from the COVID-19 pandemic, and that growth is expected to continue at a CAGR of 6% from 2020 to 2025. […] The industry was valued at $20.49 trillion in 2020, $22.52 trillion in 2021, and is expected to reach $28.53 trillion in value in 2025.” [See source.]
Let’s touch on banking first.
On the one hand, “The banking industry is in a much healthier place now than it was after the financial crisis of 2008. Total global assets climbed to $154,211 [Billion] in 2022, up 3.79 percent YoY from [$]148,583 [Billion] in 2021, according to The Banker’s Top 1000 World Banks Ranking for 2022.” [See source.] On the other hand, The Economist reports, “On May 11th the Federal Deposit Insurance Corporation, an American regulator, revealed that the country’s big banks face a bill of $16bn for losses associated with the failures of Silicon Valley Bank (svb) and Signature Bank. They will probably have to kick in even more to cover the fall of First Republic, another lender.” [See source.]
Credit Suisse has also been absorbed by UBS at government request to ward off systemic risks. [See source.] And, while it seems that the dust has settled, the outcome means government involvement in the banking sector continues to grow, whether by regulation, acting as the lender of last resort, or emergency matchmaker.
Is that good? It is certainly better than systemic and widespread default. But it bears its own risks if it goes too far in propping up lenders who have been too profligate or otherwise distorting market effects.
Still, in addition to the capital risks, the banking industry is also facing unprecedented change. This comes in the form of too many branches, the shrinking role of cash, surging digital processes, fintech competitors, and even digital currencies. You might think of BitCoin and point to the collapse of FTX or the SEC’s recent pursuit of Binance (a crypto-exchange). But in fact, it is again governments who may well be launching the next rounds of digital currencies. [See source.]
Europe is also experiencing all of these pressures. Europe is buoyed by higher margins due to higher interest rates. But also weighed down by higher costs due to inflation, and major risks due to market volatility, the end of cheap credit, the war in Ukraine, and the economic slowdown seen so far in 2023. Nevertheless, “We expect the majority of rated European banks’ NIMs [net interest margins] will continue to grow over 2023 and 2024, rising to a median of 1.55 percent by the end of 2024, up from 1.42 percent as of the end of 2022,” says the International Banker. [See source.]
Excluding health insurance for a moment, other insurance divides normally into Property/Casualty on the one hand and Life/Annuity on the other.
In the US the former category ended 2021 at about $714 billion in net premiums written. This is up 55% over the preceding decade. The latter is at $636 Billion rose only 2.1% in the same period. [See source.] In fact, the Property/Casualty market suffered enormous blows of fate. This is due to natural catastrophes and business interruptions surging in the past few years. “In 2022, around 45% of USD 275 billion in global economic losses from natural disasters were covered by insurance. We see a long-term growth trend of 5-7% in annual insured losses, mainly driven by rising loss severity of individual catastrophe events.” [See source.]
According to the same source, severe storms represented the largest risk in the most recent decade. This is particularly in North America. In a nutshell, people are migrating quickly (+620% since 1970) into the path of storms like Hurricane Ian. The results are unfortunately predictable as severe weather events continue to increase.
From an insurance point of view, fewer investors apparently wish to invest in funding insurance risks of this kind. “This has created a gap between supply and demand… Higher exposures and shrinking risk appetite typically result in rising prices, higher retention, and tighter terms and conditions.” [See source.]
Of course, severe weather is but one aspect of risk. For example, cybersecurity has become a broader business risk. And many of the risks are interconnected. A weather event can bring about supply chain or business interruptions. This is particularly for on-line businesses, or indeed affect employees’ housing or transportation options, etc. “Uncertainties spurred by global challenges, government regulations and economic forces make the risk landscape hard for insurers to navigate.” [See source.]
Then there is the health insurance market. “The U.S. individual health insurance market size was valued at USD 1.60 trillion in 2022. [This is] expected to expand at a compound annual growth rate (CAGR) of 6.08% from 2023 to 2030.” [See source.] McKinsey reports on rather healthy trends in the US market as consumer as well as insurer participation continued to grow while premiums rose only modestly. Overall, “Consumer choice of insurers and products has increased substantially over the past five years.” [See source.] Still, the volume of data to be collected, protected and sifted. The complexity of the service delivery, and the increasing tightness of the labor market all constitute significant challenges.
Forbes sees the answer in increasing nimbleness on the part of insurers. This data must reside in a secure cloud. It needs to be accessed to generate insights in milliseconds thanks to sophisticated IT architecture and eventually AI. This all requires new skills that may not have been available in the industry before. This is perhaps some of those tech engineers recently liberated by Meta, Google, Amazon, etc. could fill the gap. But insurance companies also need to upgrade the human side of the equation in their client-facing activities. Insurance companies need to make customers feel cared for, according to Forbes. [See source.]
We will not be able to profile all of the accounting, wealth management, and investment management trends in this brief overview. But we would like to take a moment to explore the Middle East. The World Economic Forum has recently predicted strong GDP growth in the region of 3.6% p.a., and fundraising for new investments remains correspondingly strong.
“Globally, the last year has seen Initial Public Offerings (IPOs) slump sharply due to economic woes, including falling stock prices and high inflation. The Middle East is bucking the trend with the region’s boom to continue throughout 2023. […] According to recent figures from Bloomberg, Gulf IPOs have attracted a total capital of over $18 billion this year, representing 47 percent of the wider Middle East’s $38.2 billion. Half the listing proceeds in Europe, the Middle East and Africa came from the GCC states, as the region benefits from high oil prices and increased investor demand.” [See source.]
The same source continues, “In the Middle East, family-owned businesses are a crucial part of the economy. [They contribute] an impressive 60 percent of the GDP. […They also employ] 80 percent of the workforce. Family businesses are uniquely complex and require different services and handling than other types of businesses.” [See source.] This all seems to suggest that there are significant opportunities for financial service companies in the region.
Against this complex background, let us now turn to the men and women who have navigated so many crises successfully so far. Now we explore the market for executives.
The Market for Executives
In total, 1.1 million executives as we define them work in this industry. This is a cohort that grew only marginally in the past year by about 1%. But also allowed some 4% to change jobs, implying more than 50,000 executive opportunities over the last twelve months. Only about 26% of these executives are female.
The US and Canada employ some 786,000 in this industry (27% female). Europe and the UK encompass some 270,000. The Middle East another 45,000. The latter group has grown by 2% YOY. Overall, LinkedIn states that these executives are in high or very high demand. We will see more specifics on this shortly.
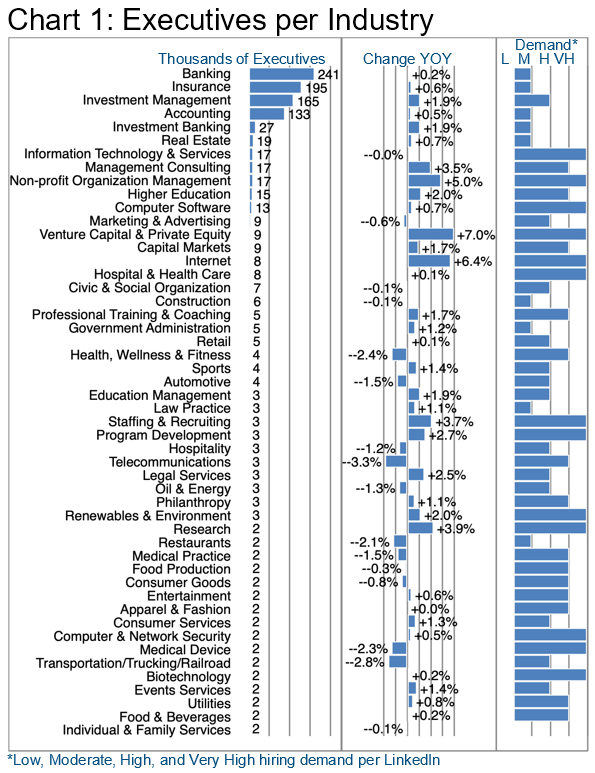
Chart 1 explores the industries on which these executives state that they are principally focused. The top six constitute no particular surprises. They show a relatively modest growth history and hiring demand. Demand picks up considerably in the next tier. This is where ranks seven through sixteen (Information Technology through Hospital & Health Care) all show high or very high demand. This is except for Marketing & Advertising, although their recent growth varies considerably.
Readers of these Updates will also recognize a few industries as perennially losing executives, such as Telecommunications.
The good news may be that the skills in this set of industries should be highly transferrable if one knows how to tell the story.
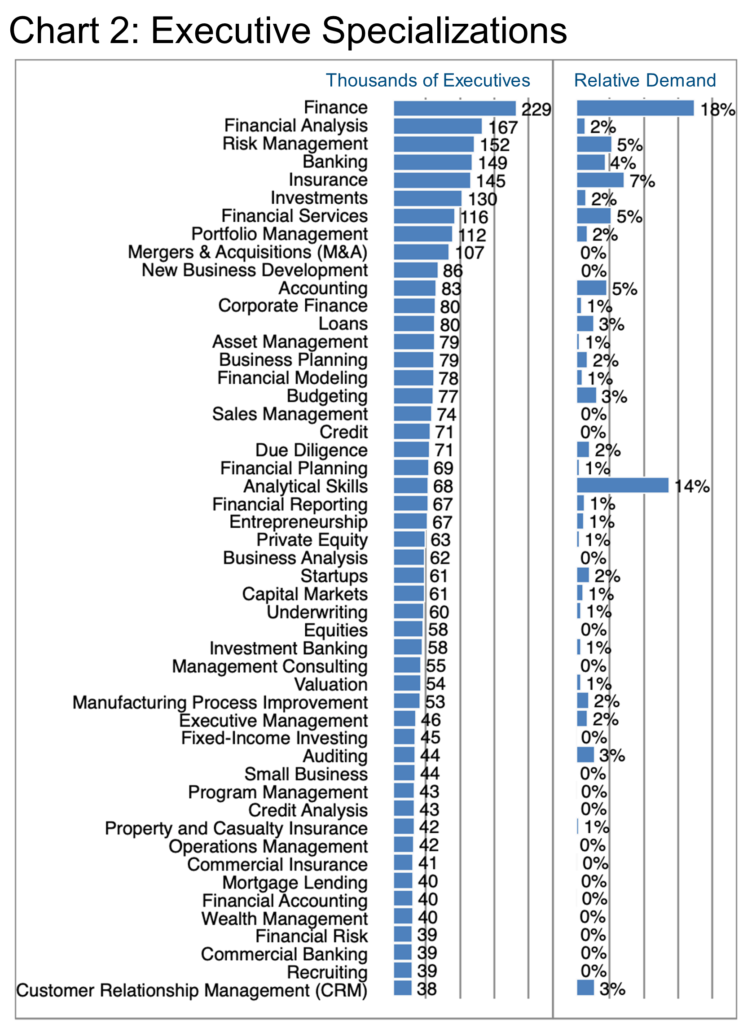
Chart 2 surveys the specializations that executives have flagged on their LinkedIn profiles. Bear in mind that most will have highlighted more than one such specialization. However, the highly numerate skills (Finance, Financial Analysis, etc.) at the top of the ranking should hardly surprise the reader. After all, counting money is the principle preoccupation in these related business segments.
Still, there is ample opportunity for creativity as well. And that is how we at the Barrett Group help clients to reimagine their professional futures. We assist our clients when trying on various outcomes as a sort of thought experiment before finalizing their personal strategic plans. After all, what you can do or have done is not necessarily what you want to do. We help clients rethink their professional trajectories. And then they re-sort and re-tell their histories to make significant industry, executive role, or even geographic changes possible. Each client is supported by a six-member team of professionals. The team includes a research specialist who can, for example, help focus millions of data points down to a specific hiring executive in preparation for an interview.
See our Success Studies for numerous examples.
The “Relative Demand” column on Chart 2 should be taken with a grain of salt as it only shows the share of all want ads published within the cohort of specializations. In other words, according to LinkedIn 14% of the want ads published in these top 50 specializations sought Analytical Skills. We suggest caution here because our experience confirms that most executive opportunities are in fact never published. Instead, they are filled before they can be formalized. We call this the “unpublished” market and fully 75% of our clients land by this means. [Read more.]
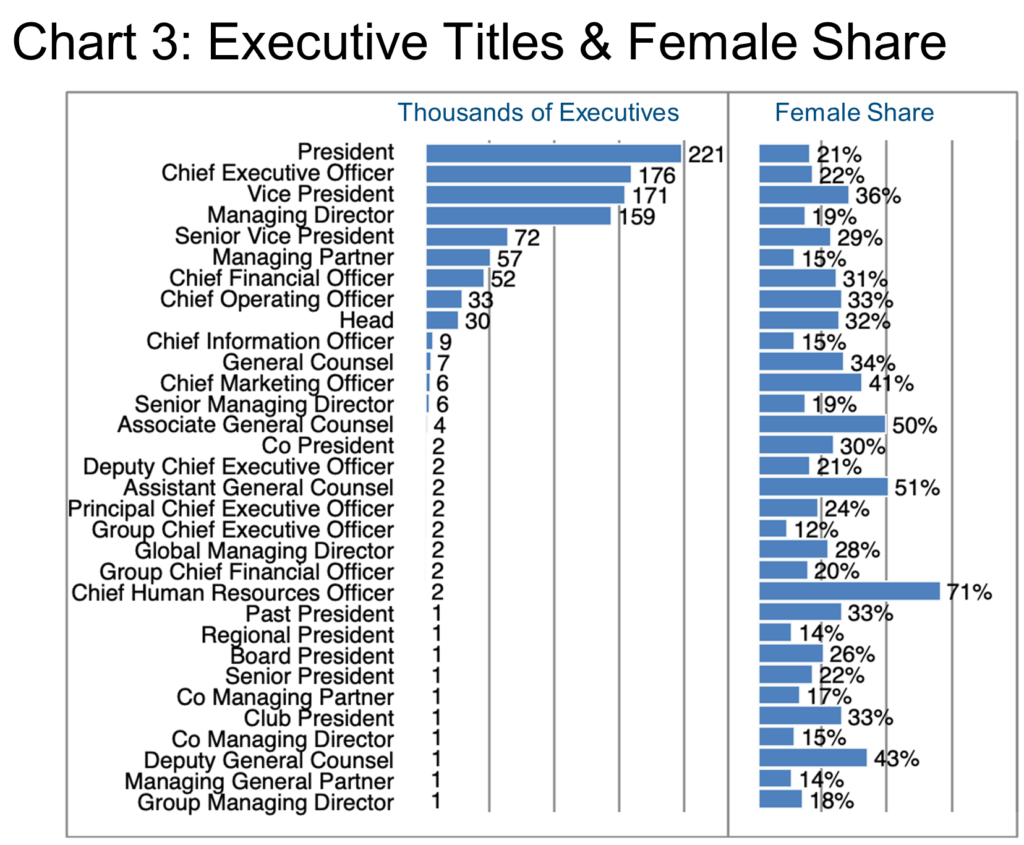
Chart 3 considers the titles of the executives in this study revealing that a strong preponderance inhabits the C-suite. This is only possible when the average size of the organization is relatively small. Still, as usual, the executive positions are largely held by males in this industry with peaks for female executives in some predictable areas of expertise such as the Chief Human Resources Officer (71% female), various General Counsel positions (43%-51%), and Chief Marketing Officer (41%). Frankly, it is a bit of a mystery why a critical function such as the Chief Financial Officer should be less frequent in this cohort than President, but again, this probably has to do with the relative size of the organizations. A smaller firm might manage with an Accounting Manager or Director instead of a CFO, but they will still have a CEO or President.
So let us examine the employers of these executives, Chart 4. Many of these companies are probably well known to us as retail or specialized banks with a smattering of large PE firms (Black Rock, Blackstone), Consultants (EY, KPMG, PwC), Wealth Advisors (Fidelity, Raymond James), and Insurers (Marsh, Guy Carpenter).
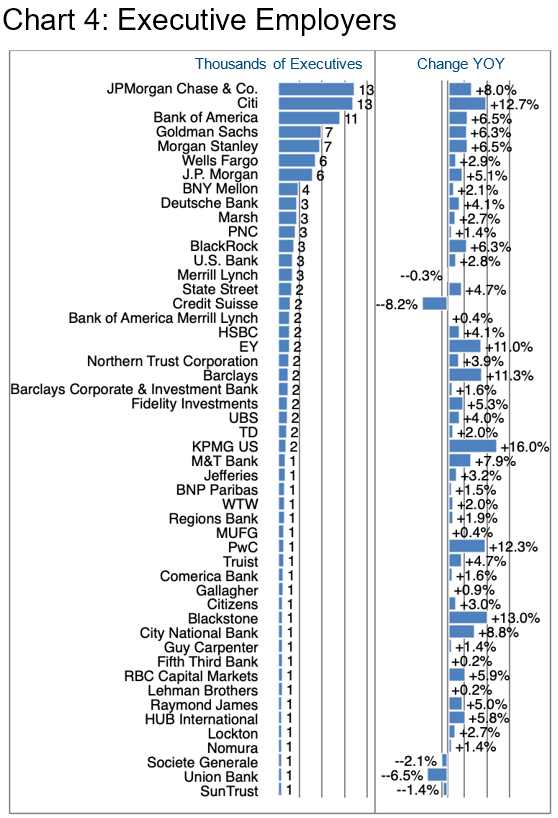
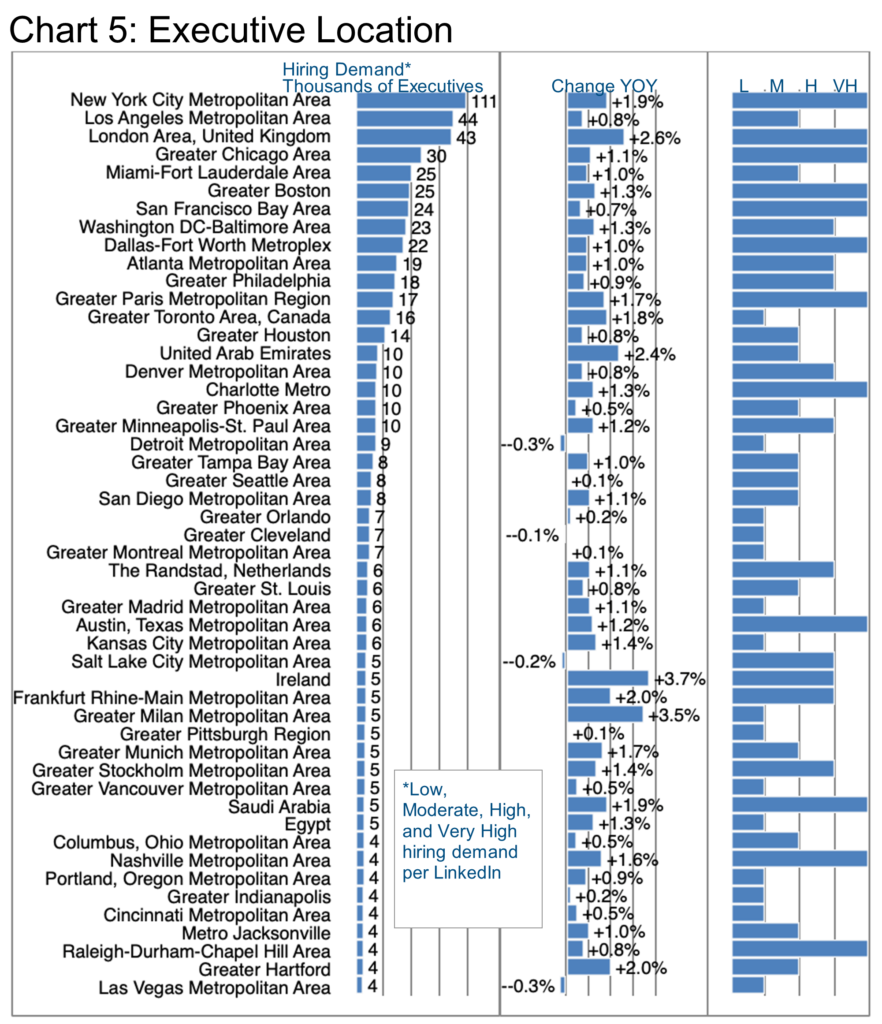
Among the industry giants, Citi grew by 12.7% in the latest year, adding more than 1,400 executives. In general, Citi recruited from direct competitors including Credit Suisse, but also from Tata Consultancy services. Citi’s US growth was centered on New York, Tampa, and Dallas while international expansion took place mainly in London, Ireland, Warsaw, and India. JP Morgan also grew by 8% including recruitment from the same two companies, as well as through its “fire sale” acquisition of Silicon Valley Bank. [See source.] JP Morgan’s growth in the US seems to be mainly in New York, Philadelphia, Columbus, Chicago, Dallas, and Los Angeles and outside the US in India, Manilla and London. (Chart 5 summarizes executive locations in this industry.)
Bank of America shared bombshell results with Wall Street recently and shows no single reason for their significant growth that seems to have been principally in Charlotte, Dallas, and Los Angeles in the US, and in a number of international locations according to LinkedIn, including hiring from Credit Suisse. The bank also launched an innovative entrepreneurs’ accelerator program in May that has attracted significant attention.
Among major consulting groups, KPMG grew their executive base organically by 16% in the US, partly from internal international sources, but also from a long list of competitors. PwC also grew by about 12% largely by hiring from competitors, their overall employment growth focused on Boston, Chicago, Atlanta, Tampa, Los Angeles, and San Francisco, and outside the US in India and London. EY grew by circa 32,000 employees in total, including 211 executives. Only 3% of this total headcount growth was in the US while the lion’s share was in India.
Blackstone also showed significant executive growth of 13%, mainly in New York and in the Capital Markets specialization, benefitting obviously from downsizing, for example, at Goldman Sachs.
Barclays added staff in New York, Glasgow, and India, adding 11% to its executive ranks in the process.
Peter Irish, CEO
The Barrett Group
Click here for a printable version of Industry Update – Financial Services 2023
Editor’s Note:
In this particular Update “executives” will generally refer to the Vice President, Senior Vice President, Chief Operating Officer, Chief Financial Officer, Managing Director, Chief Executive Officer, Chief Financial Services Officer, Chief Marketing Officer, Chief Information Officer, Managing Partner, General Counsel, Head, and President titles principally located in the US, Canada, Europe, the UK, and/or the Middle East. Unless otherwise noted, the data in this Update will largely come from LinkedIn and represents a snapshot of the market as it was at the time of the research.
Is LinkedIn truly representative? Here’s a little data: LinkedIn has more than 900 million users. (See source.) It is by far the largest and most robust business database in the world, now in its 20th year. LinkedIn Talent Insights data is derived by aggregating profile data voluntarily submitted by LinkedIn members. As such, LinkedIn cannot guarantee the accuracy of LinkedIn Talent Insights data.