
INDUSTRY UPDATE: e-Commerce – November 2021
INDUSTRY UPDATE: e-Commerce – November 2021
Introduction to e-Commerce
Do you actually remember a world without the internet? According to one source, e-commerce was invented about 40 years ago—even before the internet via dial-up modems. (See source.) Along the way, some important milestones include:
- 1969 Compuserve founded
- 1979 First electronic shopping
- 1982 Boston Computer Exchange launched
- 1992 Book Stacks Unlimited (first online book marketplace)
- 1995 Amazon launched
- 1998 PayPal launched
- 1999 Alibaba launched
- 2000 Google launches Adwords
- 2004 Shopify introduced
…and the list goes on. The same source underscores the impact Covid-19 has had saying, “By May of 2020, e-commerce transactions reached $82.5 billion — a 77% increase from 2019.”
The US Department of Commerce reports e-commerce growth of 43.8%, 36.1%, 32%, 39.3%. It reports a 9% quarter-on-quarter increase from Q2-2020 through Q2-2021. This brings e-commerce to an annualized run rate of $890 billion in sales, or about a 13% share of total US commerce per their definition. ( See source.)
Europe has seen similar growth due to the pandemic. Europe is now expected to reach €542 billion in 2021. That’s up €100 billion from 2020, and €690 billion by 2025, an increase of 27% over 2021. (See source.) Brexit seems to have confused comparative figures. But an exhaustive report on Europe suggests that e-commerce contributes about 4.6% of GDP in 2021, up from 3.11% in 2017 (See source.)
There is certainly more to e-commerce than e-tailers. However, the relative market share of e-tailers is a bit easier to enumerate. Therefore, let us briefly review the current state of play in the US per Statista as of October 2021 (See source). Amazon continues to dominate the landscape and is followed distantly by Walmart, eBay and Apple. (Chart 1)
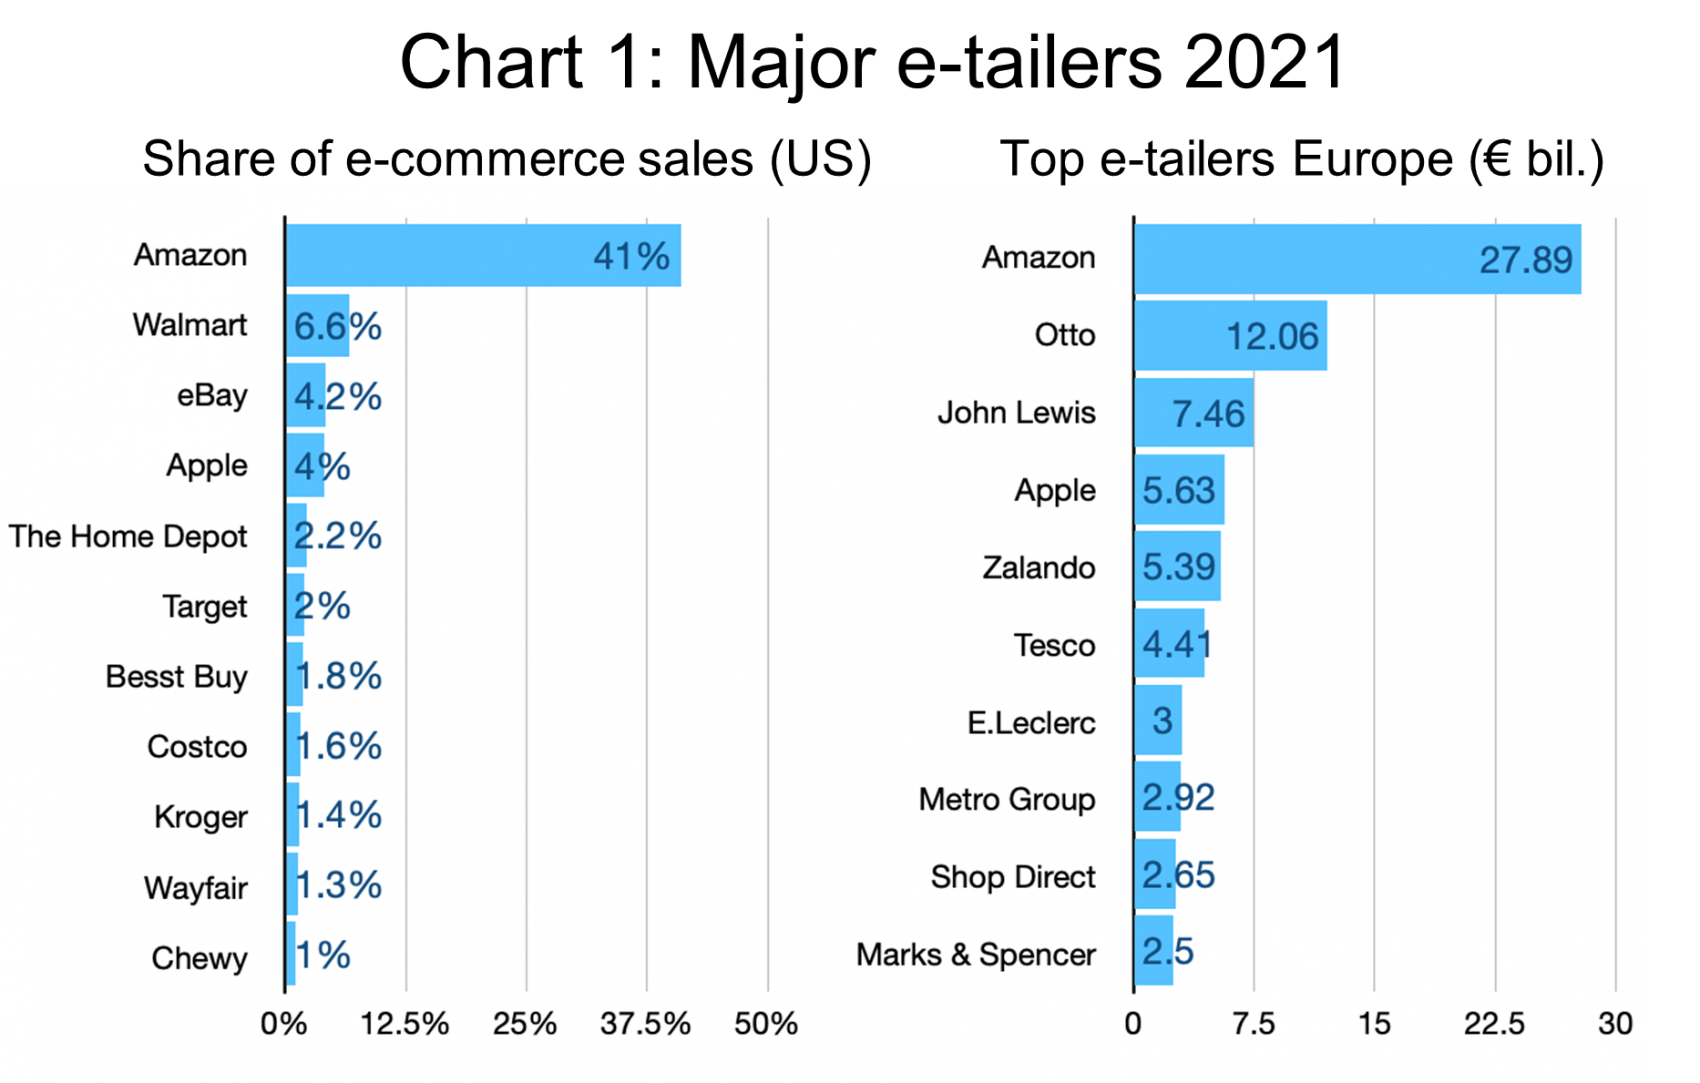
In Europe, the top e-tailers are also led by Amazon, but, except for Apple, the rest of the chart is dominated by local players (See source.).
The acceptance of shopping by the internet took a huge leap in 2020 due to the pandemic. But it still has a long way to go as far as sheer physical penetration is concerned, particularly in Europe. In the US, apparently, 77% of the relevant population has engaged in purchasing goods via the internet with a forecast to more than 85% by 2025 (See source).
In Europe, the UK has the highest overall penetration with about 9.9% of GDP per capita being purchased online. This is while France, Spain, and Poland lie in the 4-6% range and heavyweight Germany still lags at 3%. The penetration by category of goods is also decidedly uneven. Clothing is at about 63%. But deliveries from restaurants are at a mere 28% so far, and therefore show tremendous opportunity for further growth (See source).
Betting on e-Commerce: A Sure Thing
You may have heard the adage that there is nothing sure in life but death and taxes. Grim as that sounds, it also needs to be updated to cover the growth of e-commerce. Because, truly, that too is a sure thing. InsiderIntelligence.com projects e-commerce sales to grow from $3.354 billion in 2019 to $6.39 billion in 2024. That’s a 90% increase (See source). This will mean that e-commerce sales reach almost 22% of total retail sales worldwide. Certainly, the pandemic helped drive this trend. But so has the continuing per capita GDP growth of China and other countries. In fact, Chinese companies apparently hold four of the top five spots worldwide for e-commerce sales (See source).
Of course, one can apply various criteria (consumer sales volume, market capitalization, visitor traffic, etc.) and come up with different rankings. However, at the Barrett Group (TBG), we are mainly interested in where the executive jobs are. (See the Editor’s Note below for a more specific definition of “executive jobs”.)
Based on our definition and focusing only on the US, EU, UK and Middle East (ME), we are reviewing a universe of about 25,800 executive positions. These positions have grown by a languid 2% annual rate YOY. And have experienced a relatively low churn rate of just 1,444 executives claiming to have changed jobs. This industry, too, unfortunately, is predominantly male in its composition (82%), though slightly less so in the US (79%) and slightly more so in the EU, UK, and ME cohort (85%).
Unusually, there appear to be more such positions in the EU/UK&ME territory (14,439) than in the US (11,348) though in most other ways, the skills and key specializations are pretty similar in both geographic areas.
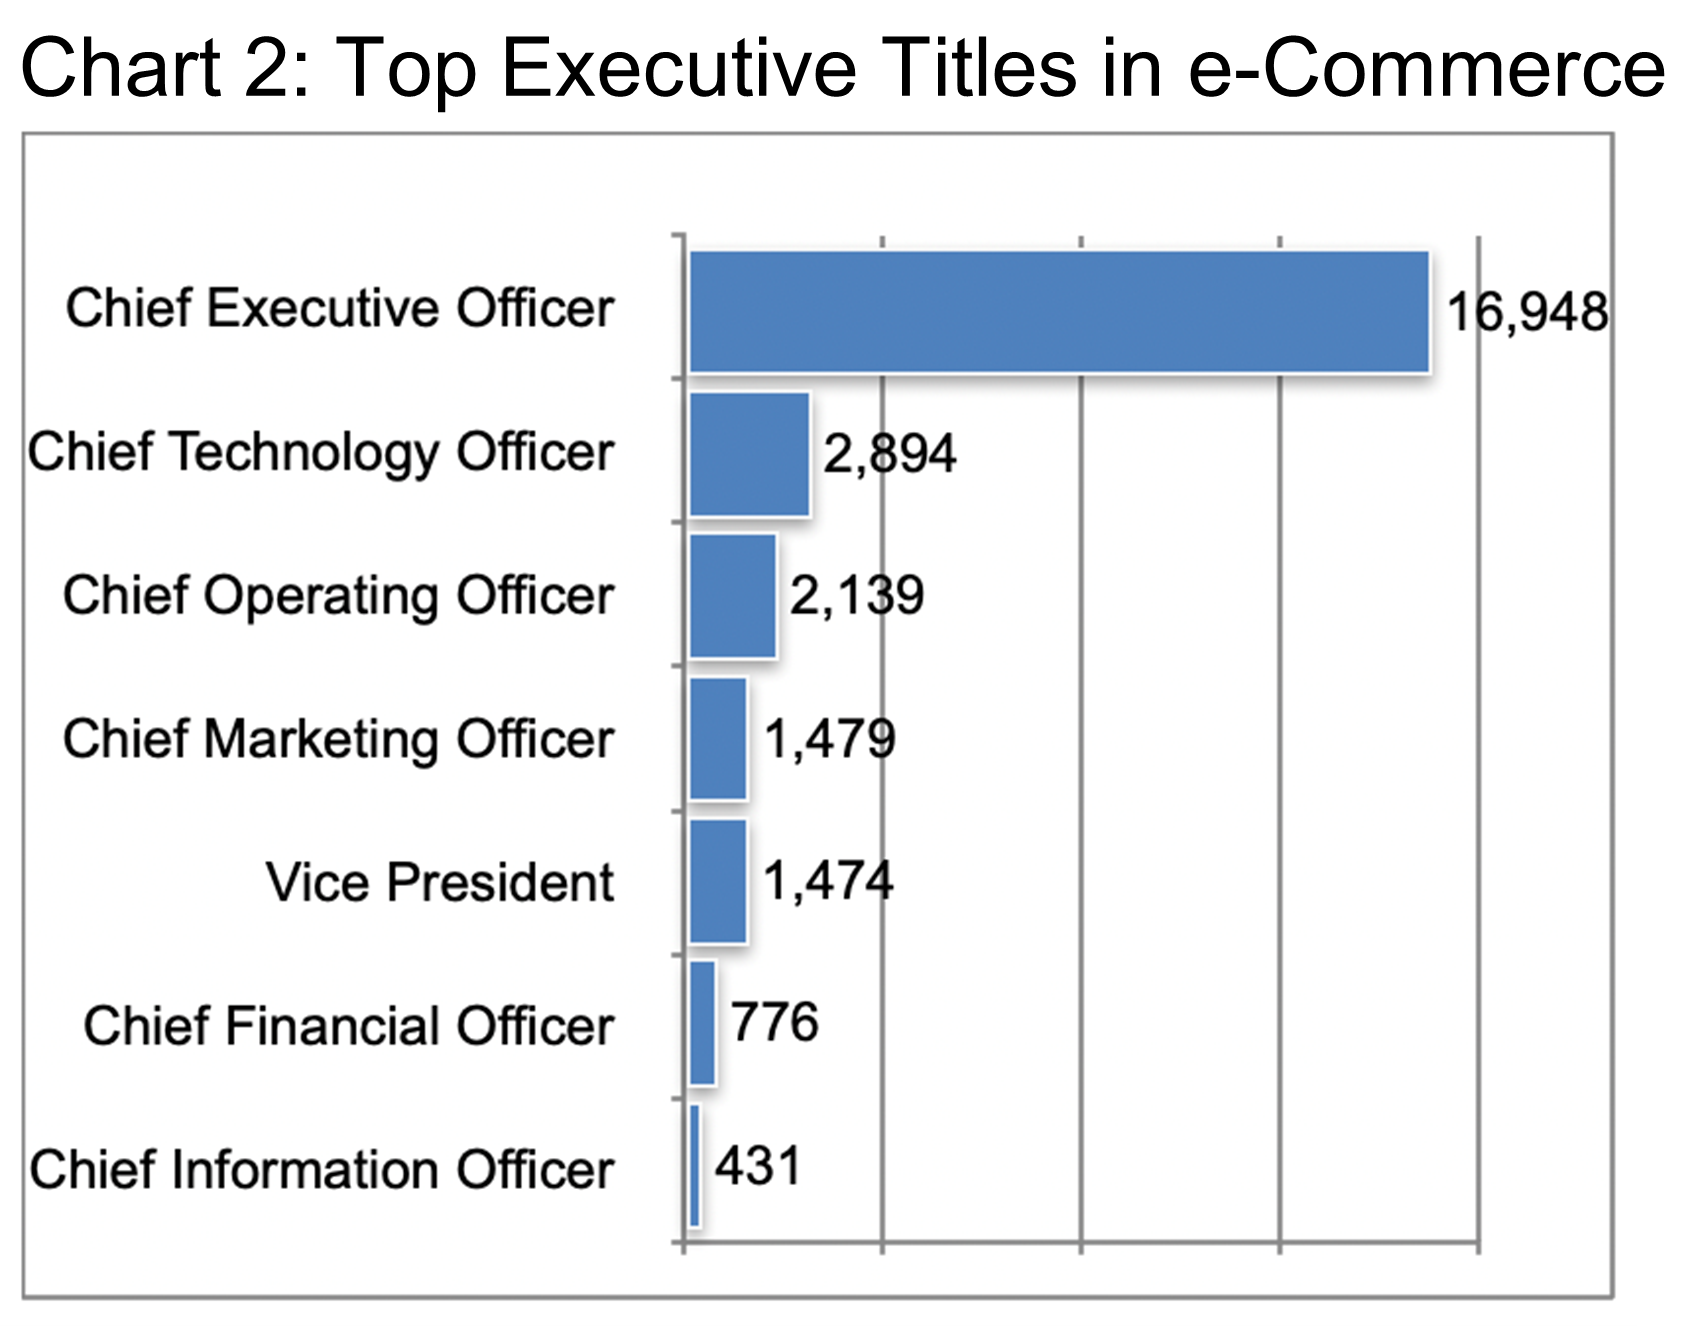
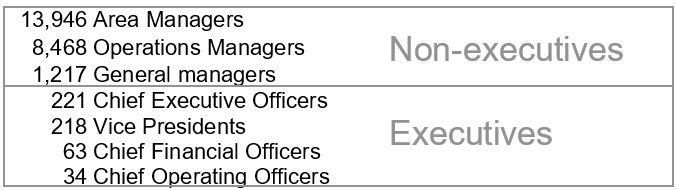
Similar to other industries we have looked at, this segment is also rather top-heavy with a marked preponderance of CEOs. (See Chart 2.) To clarify this overhang of senior executives, consider staffing at Amazon; here is an excerpt of their management composition:
Reviewing this and other data, we believe that it is again the smaller players who inflate the number of CEOs in this industry.
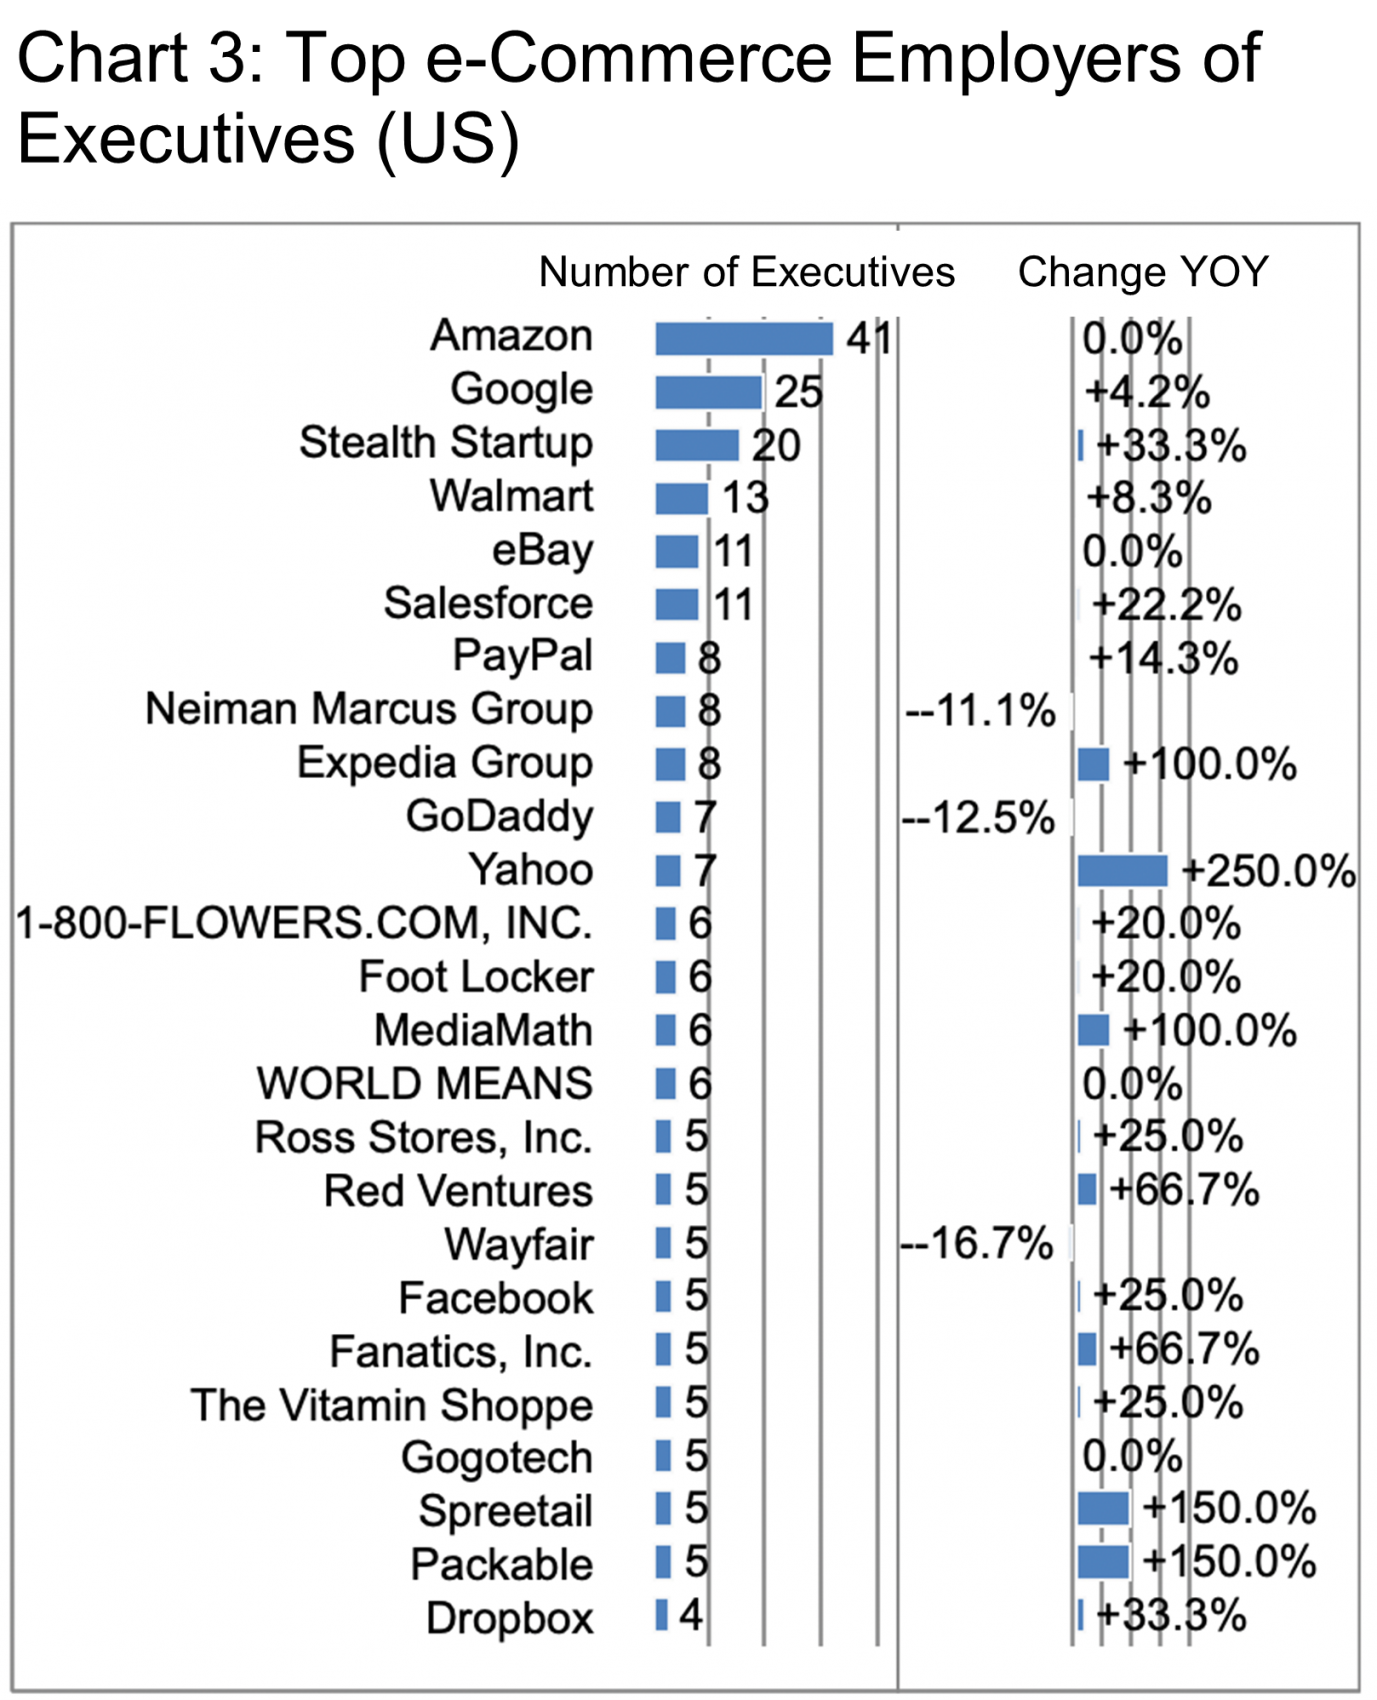
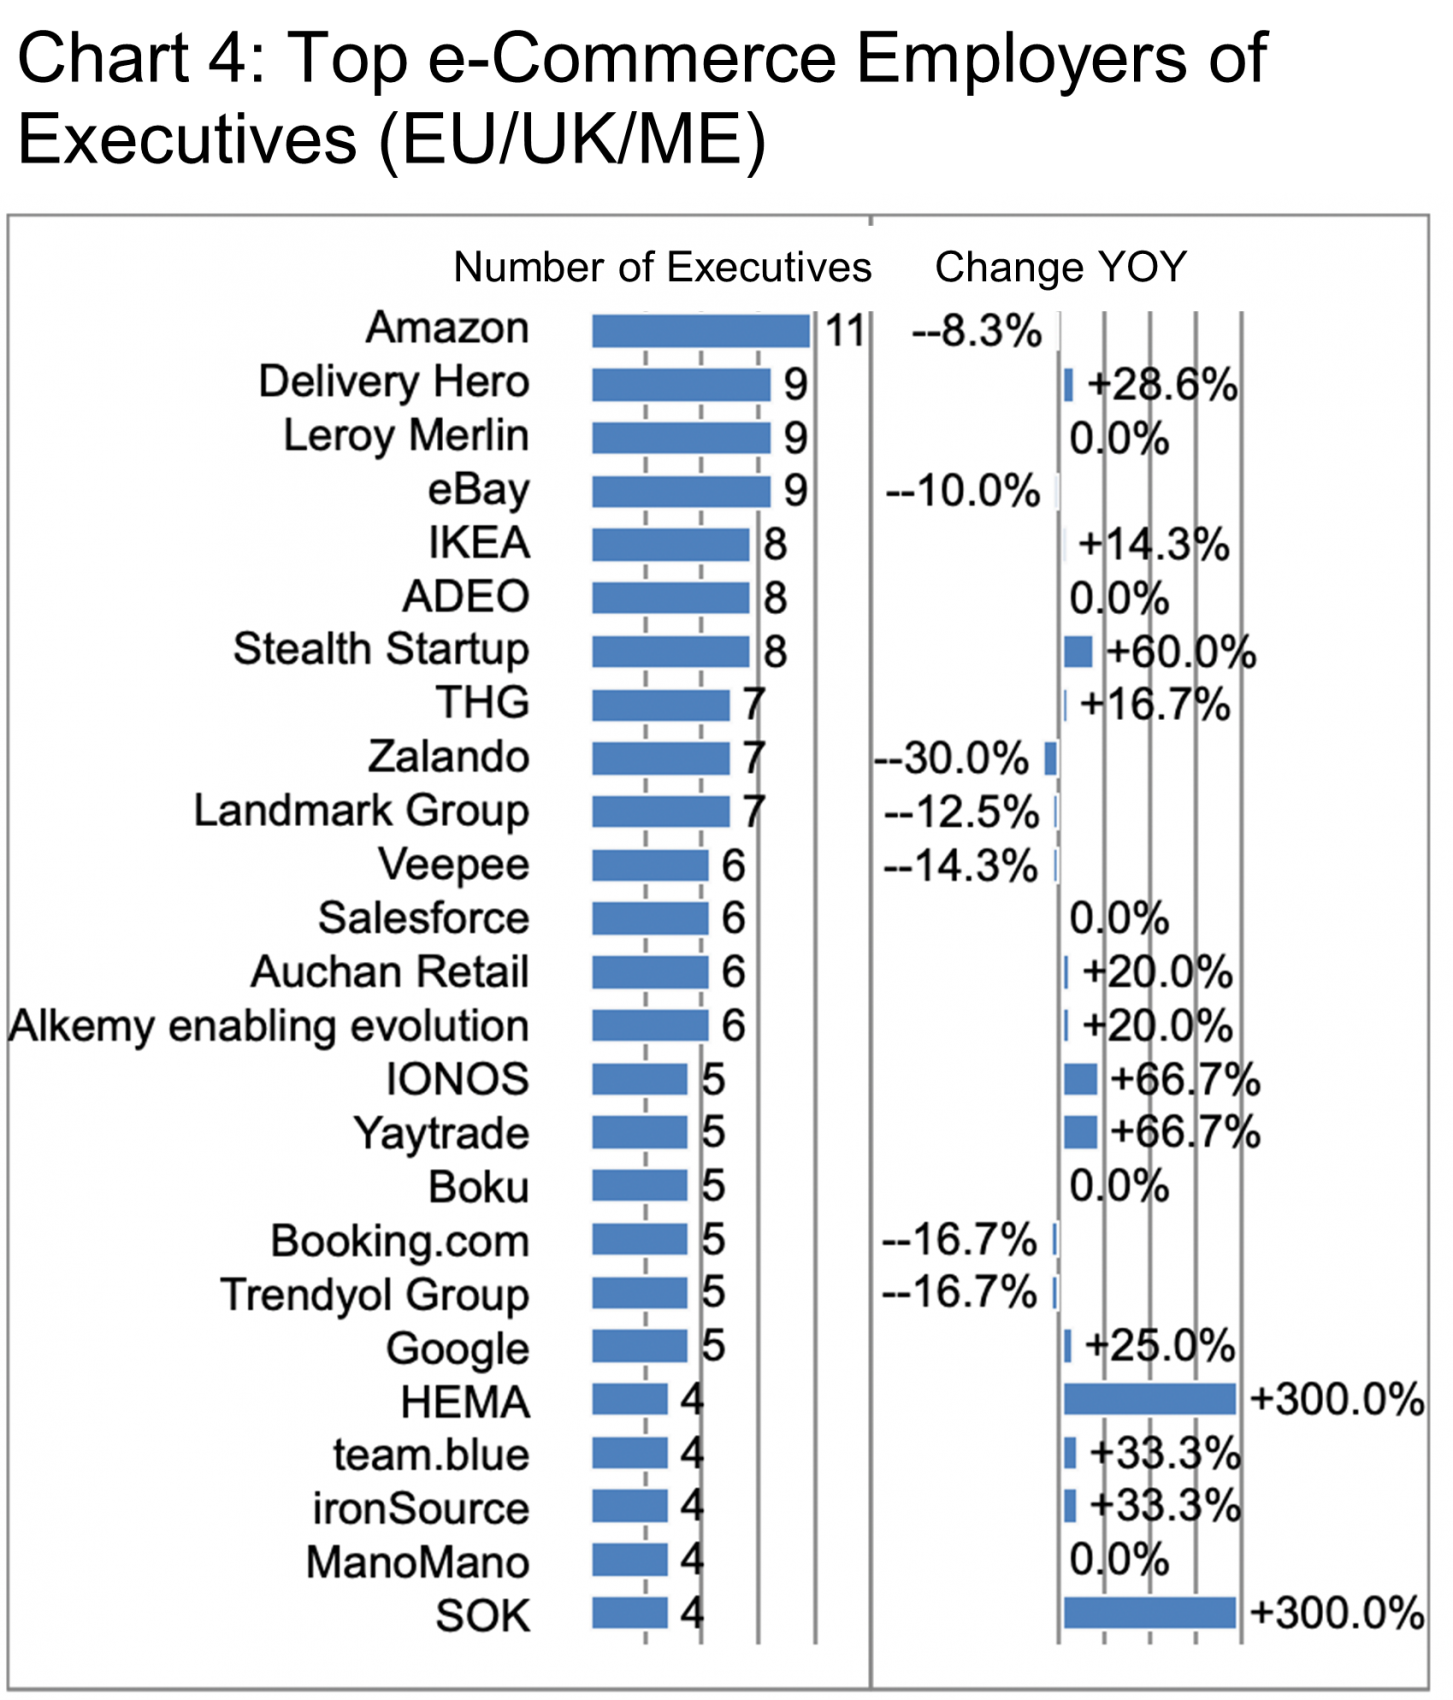
Charts 3 and 4 show the leading firms in the respective geographies as well as their YOY growth rates in terms of net executives hired.
In the context of this Industry Update, it is difficult to do justice to the dynamism of this sector. So let us take a quick look at a few of the more familiar players to get some sense of recent executive movements.
For example, in all US operations for Amazon, they hired a net 62 executives in the past 12 months. Amazon had 74 hires and 12 departures. The net growth took place across the year and not in any specific season. Matching their broad cross-category engagement, Amazon’s hires were well distributed across a range of companies. These included: Flex, Riot Games, Google, OfferUp, Houston Physicians Hospital, Nestle, PWC, etc. The Amazon departures were to StitchFix, Schmidt Futures, TowerView Ventures, GameStop, Capital One, and Zoom to name just some of the more familiar companies.
However, only 2 of Amazon’s hires and only 2 of their departures appear to have been related specifically to e-commerce per LinkedIn. So the net change at Amazon in the US was 0.
In the EU/UK/ME cohort, Delivery Hero gained 2 executives from Zalando and Dunzo. Stealth Start-up also hired 2 executives, in this case from Deloitte and Jobandtalent.
TBG clients, of course, have significantly more access to the details of executive movements at targeted companies. But perhaps the examples above will give the general reader a flavor of what is happening in this segment.
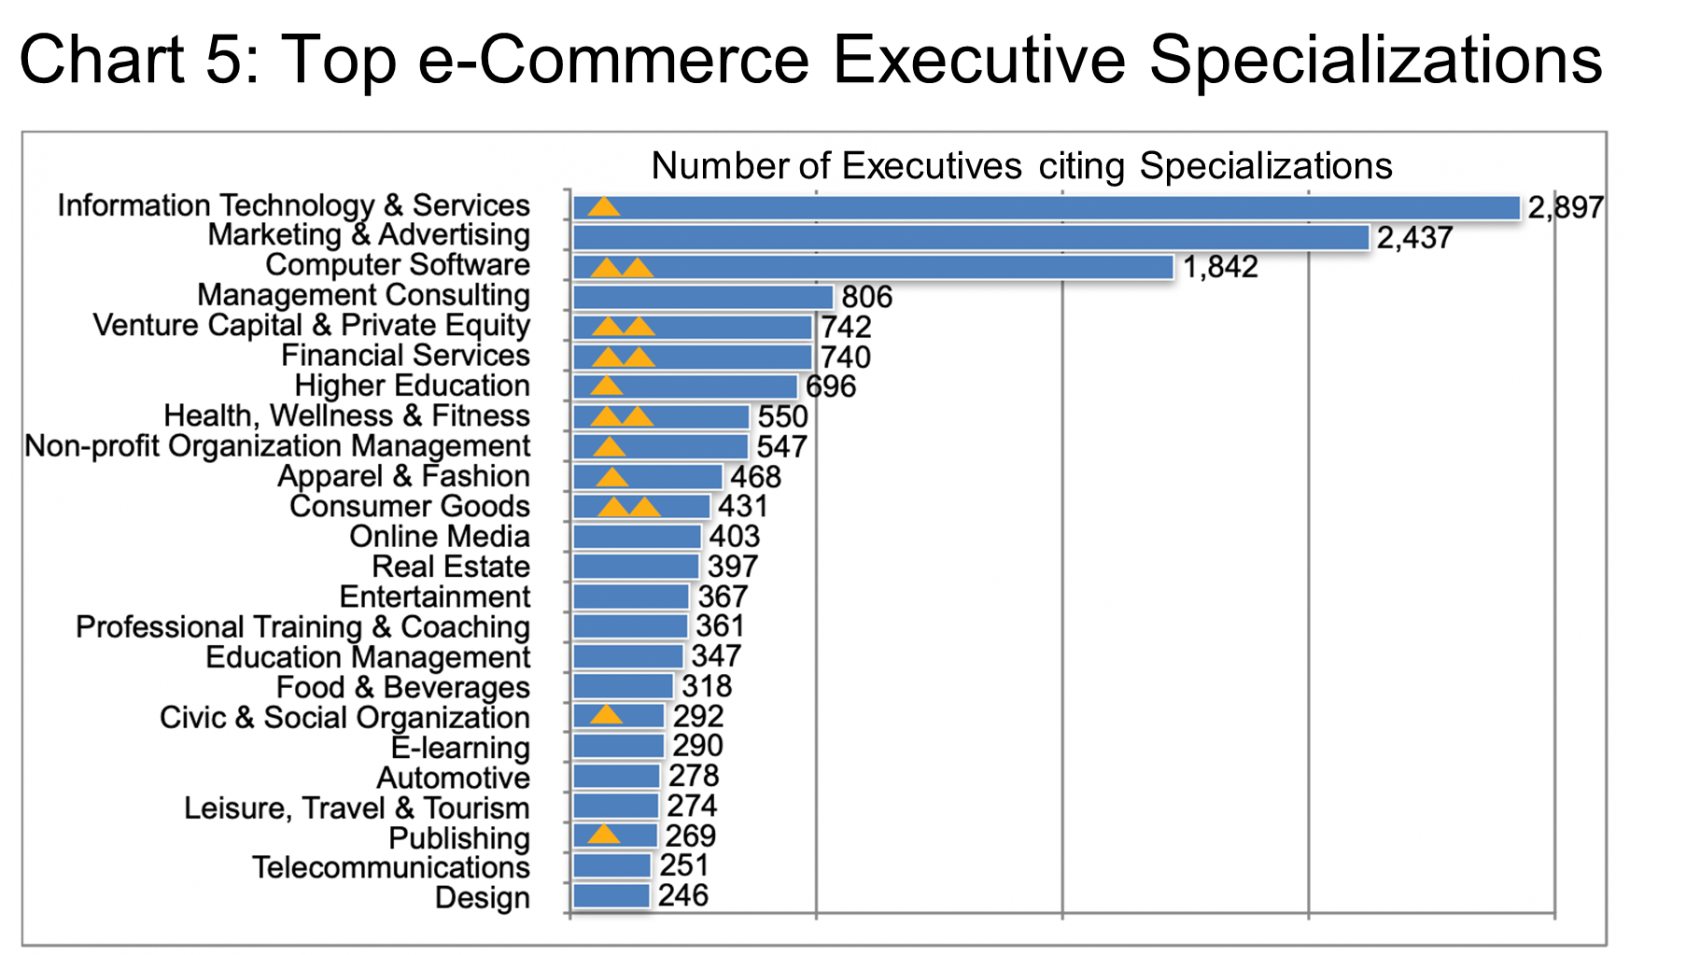
Aside from the generic “retail” and “internet” areas of focus, the executives we summarize in this update cite numerous other specializations (see Chart 5). Many of these specialties are highlighted by LinkedIn as being highly or very highly in demand.
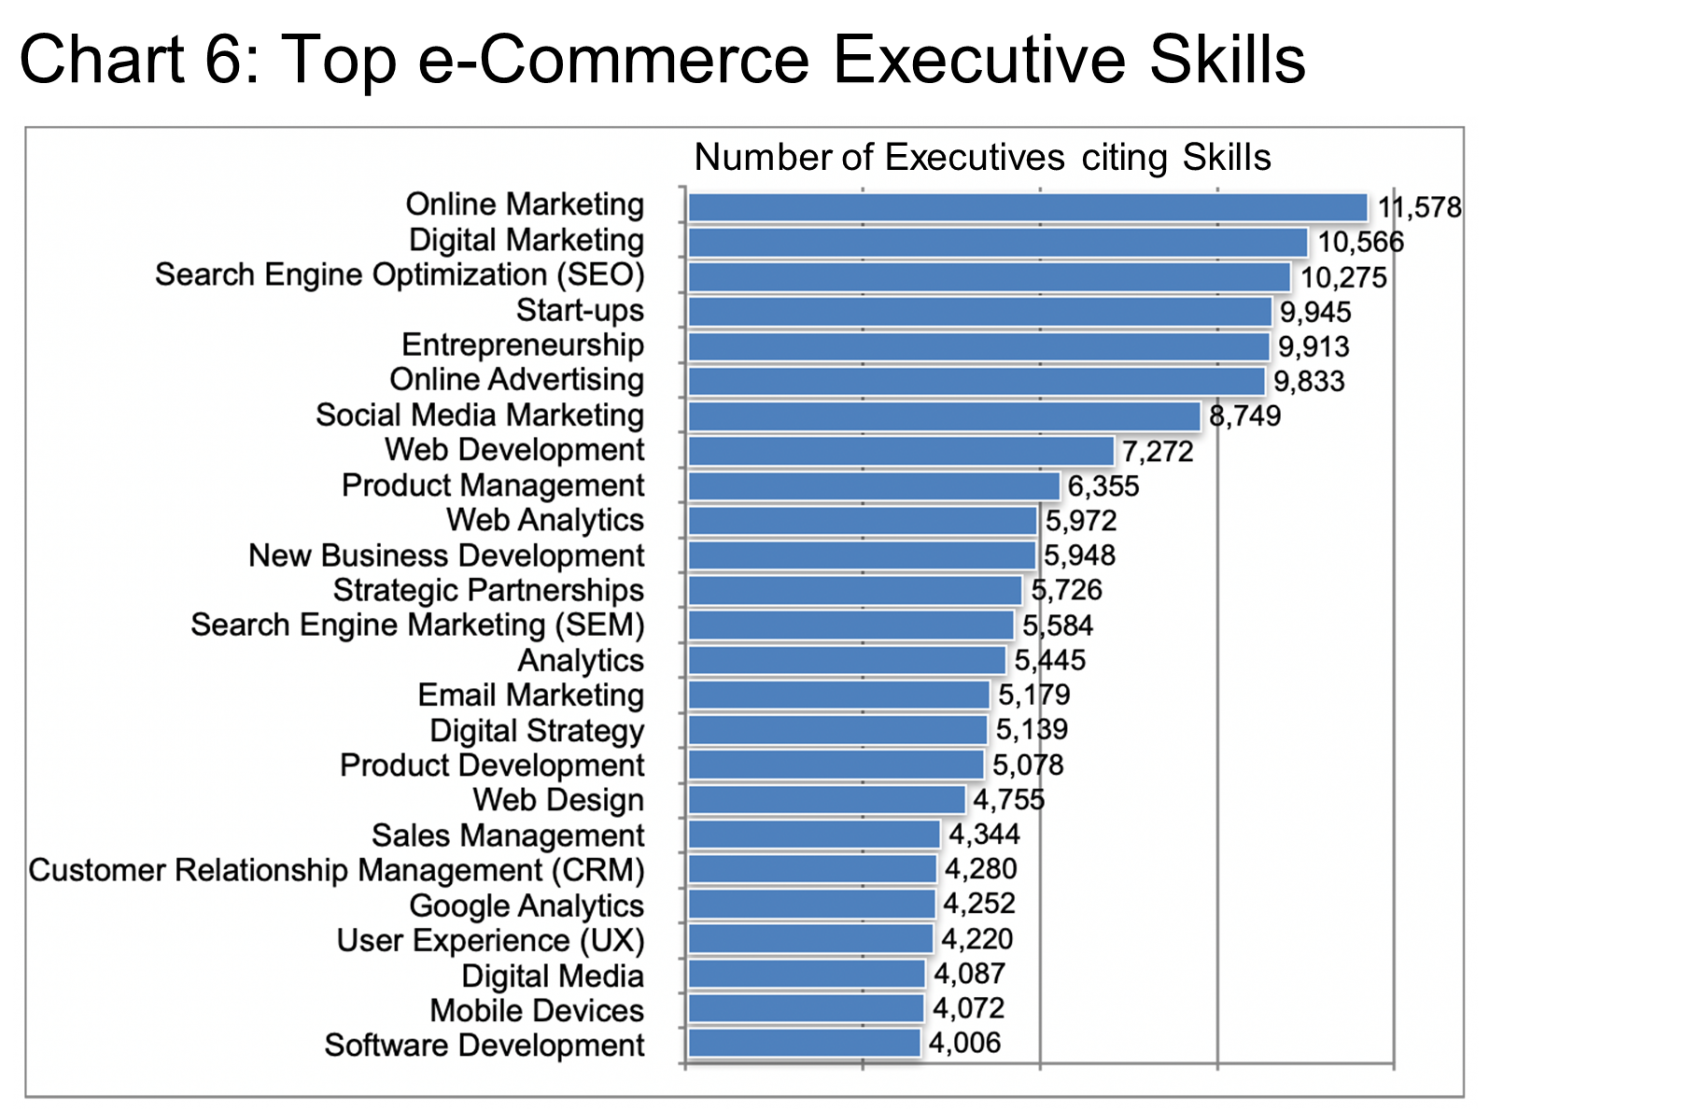
It is also highly interesting to see the skills (Chart 6) reported by e-commerce executives, in particular, the relatively generic nature of the top items such as online marketing, digital marketing, start-ups, entrepreneurship, product management, and new business development. Many of these are skills that are highly transferrable from one industry or role to another while others are very specific to the province of e-commerce specialists such as search engine optimization, online advertising, and social media advertising.
As many readers will already know, blockchain technology represents the probable next wave in securing e-commerce and other digital processes, however, executives citing this specific skill represent only about 10% of this update’s total universe, albeit with a growth rate three times the industry average (+6%).
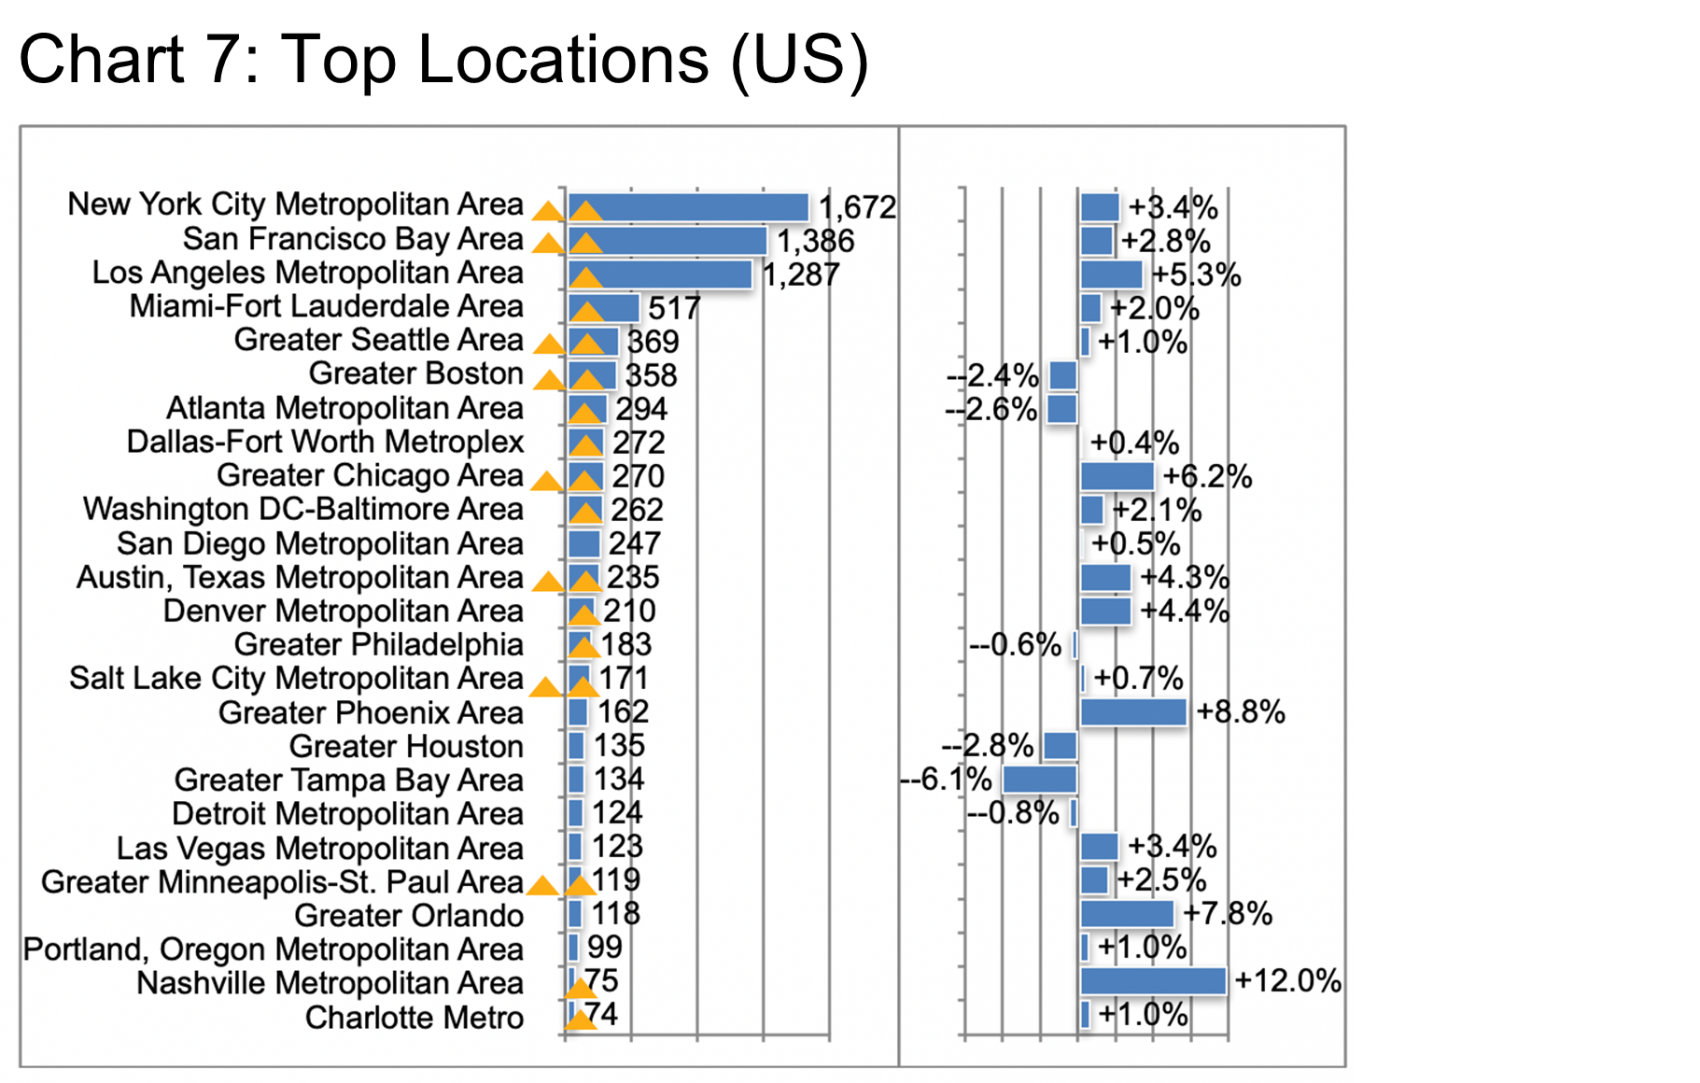
Geographically in the US (Chart 7), New York, San Francisco, Los Angeles, Miami, Seattle, and Boston represent the top six locations for e-commerce executives. But many other locations indicate high hiring demand (at least per LinkedIn), including all those with the golden triangle(s) at left.
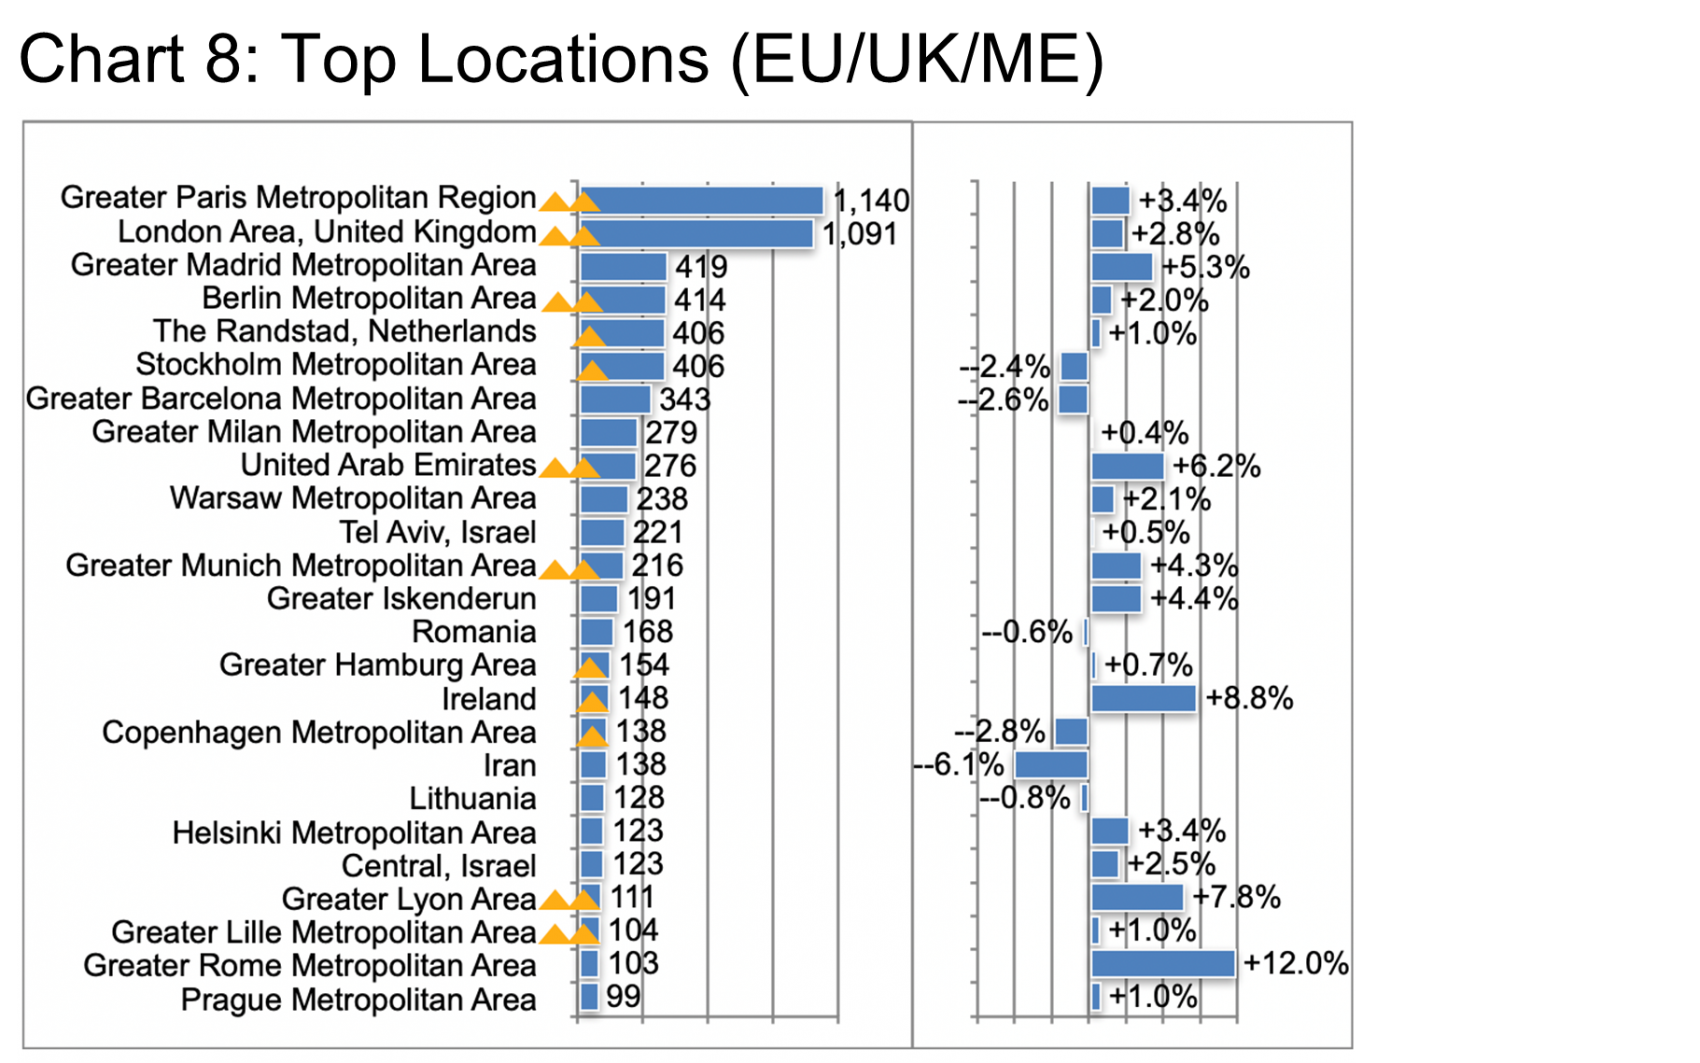
In the EU/UK/ME cohort (Chart 8), Paris actually eclipses London for a change, followed by Madrid, Berlin, the Randstad, and Stockholm rounding out the top six locations. Again, LinkedIn highlights a number of locations as exhibiting high or very high hiring demand.
One thing you can be sure of is that this whole industry segment is changing fast and will continue to grow faster than most other segments.
Take Walmart and Target in the US, for example, that started the pandemic trailing Amazon in terms of their share of e-commerce retailing. Walmart’s third-quarter update shed light on 6% YOY growth in their online business that leads analysts to expect $75 billion in online sales for the full year. Also, Target is now expected to deliver $18.6 billion in online sales, up 175% YOY (See source.). Overall, the industry is likely to add about $2 billion in sales over the next two years. That’s a lot of growing room for executive jobs!
Peter Irish, CEO The Barrett Group
Click here to download a printable version: Industry Update – Energy
Editor Note:
In this Industry Update “executives” will generally refer to the CEO, CFO, COO, CTO, CIO, CMO, and Vice President titles only. Unless otherwise noted, the data in this Update will largely come from LinkedIn and represents a snapshot of the market as it was at the time of the research. Is LinkedIn truly representative? Here’s a little data: LinkedIn has approximately 722 million users, 174 million in the US, and 163 million in Europe. (See Source) It is by far the largest and most robust business database in the world, now in its 18th year. LinkedIn defines the year-over-year change (YOY Change) as the change in the number of professionals divided by the count as of last year. “Attrition” is defined as the departures in the last 12 months divided by the average headcount over the last year.