INDUSTRY UPDATE: Big Tech
Big Tech Introduction
When minus 26.8% is the best performance in a peer group, clearly the group’s performance was dismal. And yet, that is how 2022 shook out for big tech stocks.
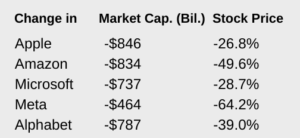 |
They were not alone, of course, with other tech darlings such as Salesforce or Tesla also performing poorly. In fact, the entire tech-heavy NASDAQ ended up -33% versus the more balanced S&P 500 at “just” -20%. (See source1 and see source2). |
Rising inflation, crypto’s trauma, general market anxiety, increasing interest rates, and outright mistakes such as Meta’s big bet on the Metaverse all played a role in these negative consequences. But the underlying health of these companies is not in question, especially as most of them reacted by slashing employment in late 2022 or early 2023.
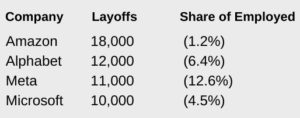 |
The same source goes on to quote the respective CEOs along the lines, “We hired too many as the pandemic subsided and now we have to rightsize the company for the business we expect.” (See source.) |
We are of course sympathetic to all who were affected by these layoffs, but … “Sacked techies should not struggle to get work. Lots of old-economy firms need their skills. Walmart, despite its lay-offs, keeps snatching up data scientists and other hypernumerate types. Already 59% of tech professionals work outside the tech sector […]” (Economist: December 4, 2022, Is a white-collar recession looming?)
Let us also consider that there exist only moderately relevant parameters to compare between these companies who by and large are not in direct competition with each other except in discrete parts of their businesses.
Famously, Amazon sells products (branded and own-label) and provides web server capacity and services. To attract eyeballs it also gives away content (or makes it available cheaply) via its Prime Video unit, content that a Disney or Netflix relies on to sell as part of their core businesses. Apple also makes products but only its own while it attempts to creep into the content business. Alphabet (Google) provides search services and sells advertising—so effectively that it has attracted competition authorities in both the US and Europe and may be required to sell off or open up in coming years. Microsoft mainly sells or licenses software. Meta provides a number of social media platforms and sells advertising.
So, what do they have in common? Skilled executives, for one.
This describes the general situation for why the executive market has developed as it has: “Managerial and professional occupations now make up 44% of total employment, up from 34% in 2000, according to the [US Bureau of Labor Statistics…].” “Automation and offshoring have meant fewer technicians and cashiers, but lots more business analysts and systems architects.” [The Economist, Is a white-collar recession looming? December 4, 2022.]
However, the way that these five tech companies utilize talent is demonstrably different, presumably due to their different strategies. We will cover more details later, however, here is a snapshot of one professional focus (software engineers) and a direct comparison of the number employed and the share of the overall workforce (per LinkedIn and generally before the most recent restructuring.)

Simply put, Apple and Amazon do not need such a large share of software engineers because their business is more about physical products than software.
Now let us review these firms’ prospects briefly.
Stock analysts’ consensus points to strong performance from Apple in 2023 due to Apple’s leadership in the smartphone market and continued robust demand for the latest iPhone models. The company’s services segment is also expected to improve (e.g., Apple TV). (See source.)
Amazon has encountered significant headwinds in 2022 that will not necessarily abate in 2023, specifically a slowing of consumer spending as well as a slower growth in demand for its AWS services. However, for the longer term, the company is very well placed with improving advertising revenues, growing share of e-commerce in overall retail, and the market for cloud services still significantly underdeveloped. (See source.)
Alphabet has also suffered due to stalled advertising revenue growth in 2022, and may see more pain before things get better, but the outlook for on-line advertising continues to be rosy in the long run, and that bodes well for the company’s main business, Google. It is difficult to assess the probability of regulatory action at the moment as the US Justice Department has only recently filed its action. However, two other important positives for the company include You-Tube which generates “ad revenue that’s in the same ballpark as streaming giant Netflix’s total revenue” (see source) and the Google Cloud business that is well positioned to take share as companies continue to migrate toward cloud-based solutions.
While it is the largest software company by sales in the world, that legacy also weighs on Microsoft as PC sales continue to soften.
Continued working from home may reverse or slow this decline. Companies’ on-going process digitization and migration to the cloud will lift Microsoft as well. Whether AI-driven ChatGPT will be a game changer is still an open question. (See source.) The integration of LinkedIn into Microsoft seems to be proceeding rather slowly so far (see source) possibly so as to avoid mistakes the company has made on acquisitions in the past. Then there are Microsoft’s gaming ambitions, even if their most recent Activision purchase is in limbo (see source), in the console market, Microsoft’s Xbox holds roughly a 20% revenue share that is expected to grow. (See source.)
Meta (Facebook) has an even more complicated story.
“Meta has seemingly gone the route of Amazon.com’s […] strategy of reinventing itself at the literal expense of short-term earnings. If the company’s pivot to the metaverse is successful, it may stand as one of the most impressive pivots investors have seen from a tech company over the next couple of decades.” (See source.) Meta faces the challenge of cutting operating costs while investing in the infrastructure required to realize its virtual reality vision even as competition in the on-line ads market heats up. “The bottom line is that Meta’s US digital advertising market share is set to contract significantly this year, from 23.6% to 18.4%, according to eMarketer.” (See source.)
Comparisons then between these companies are of limited value because many of these firms’ competitors are actually in other industries (entertainment, retail, electronics, and gaming). Straddling multiple verticals can be an advantage, of course, but also a distraction or an outright drain on resources.
One factor that unites them is that they all require top-notch executive talent to navigate these stormy seas.
Obviously the recently announced restructuring programs are not yet reflected in these figures. We plan to provide an update after the results have settled somewhat.
The Executive Market-Big Tech
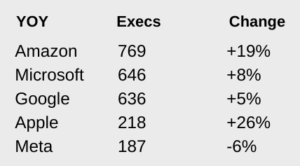
These five companies employ approximately 2,500 executives as we define them (see Editor’s Note), a population that grew by 11% in the past year with another 13% having changed jobs in the same period. All in all, that is a very high “churn” in comparison to other industries.
|
At the same time, LinkedIn reports that the median tenure for these positions is a rather long 6.3 years. Almost 1,600 of these roles are in the US while the balance are in the EU, UK, and Middle East. According to LinkedIn, these are their respective Executive headcounts. |
 |
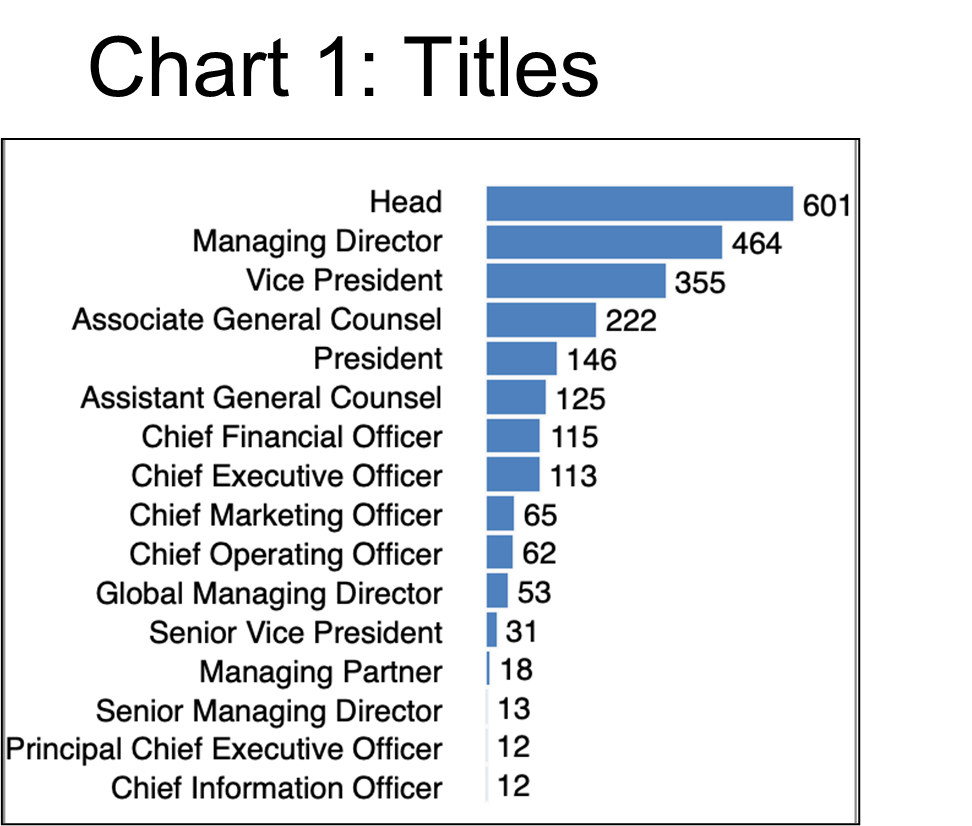 |
Chart 1 provides an overview of the titles in this group of firms which indicates the extremely concentrated structure of the top leadership (very few C-level in comparison to all other senior manager positions). “Head” seems to be the most popular title followed by MD and Vice President. |
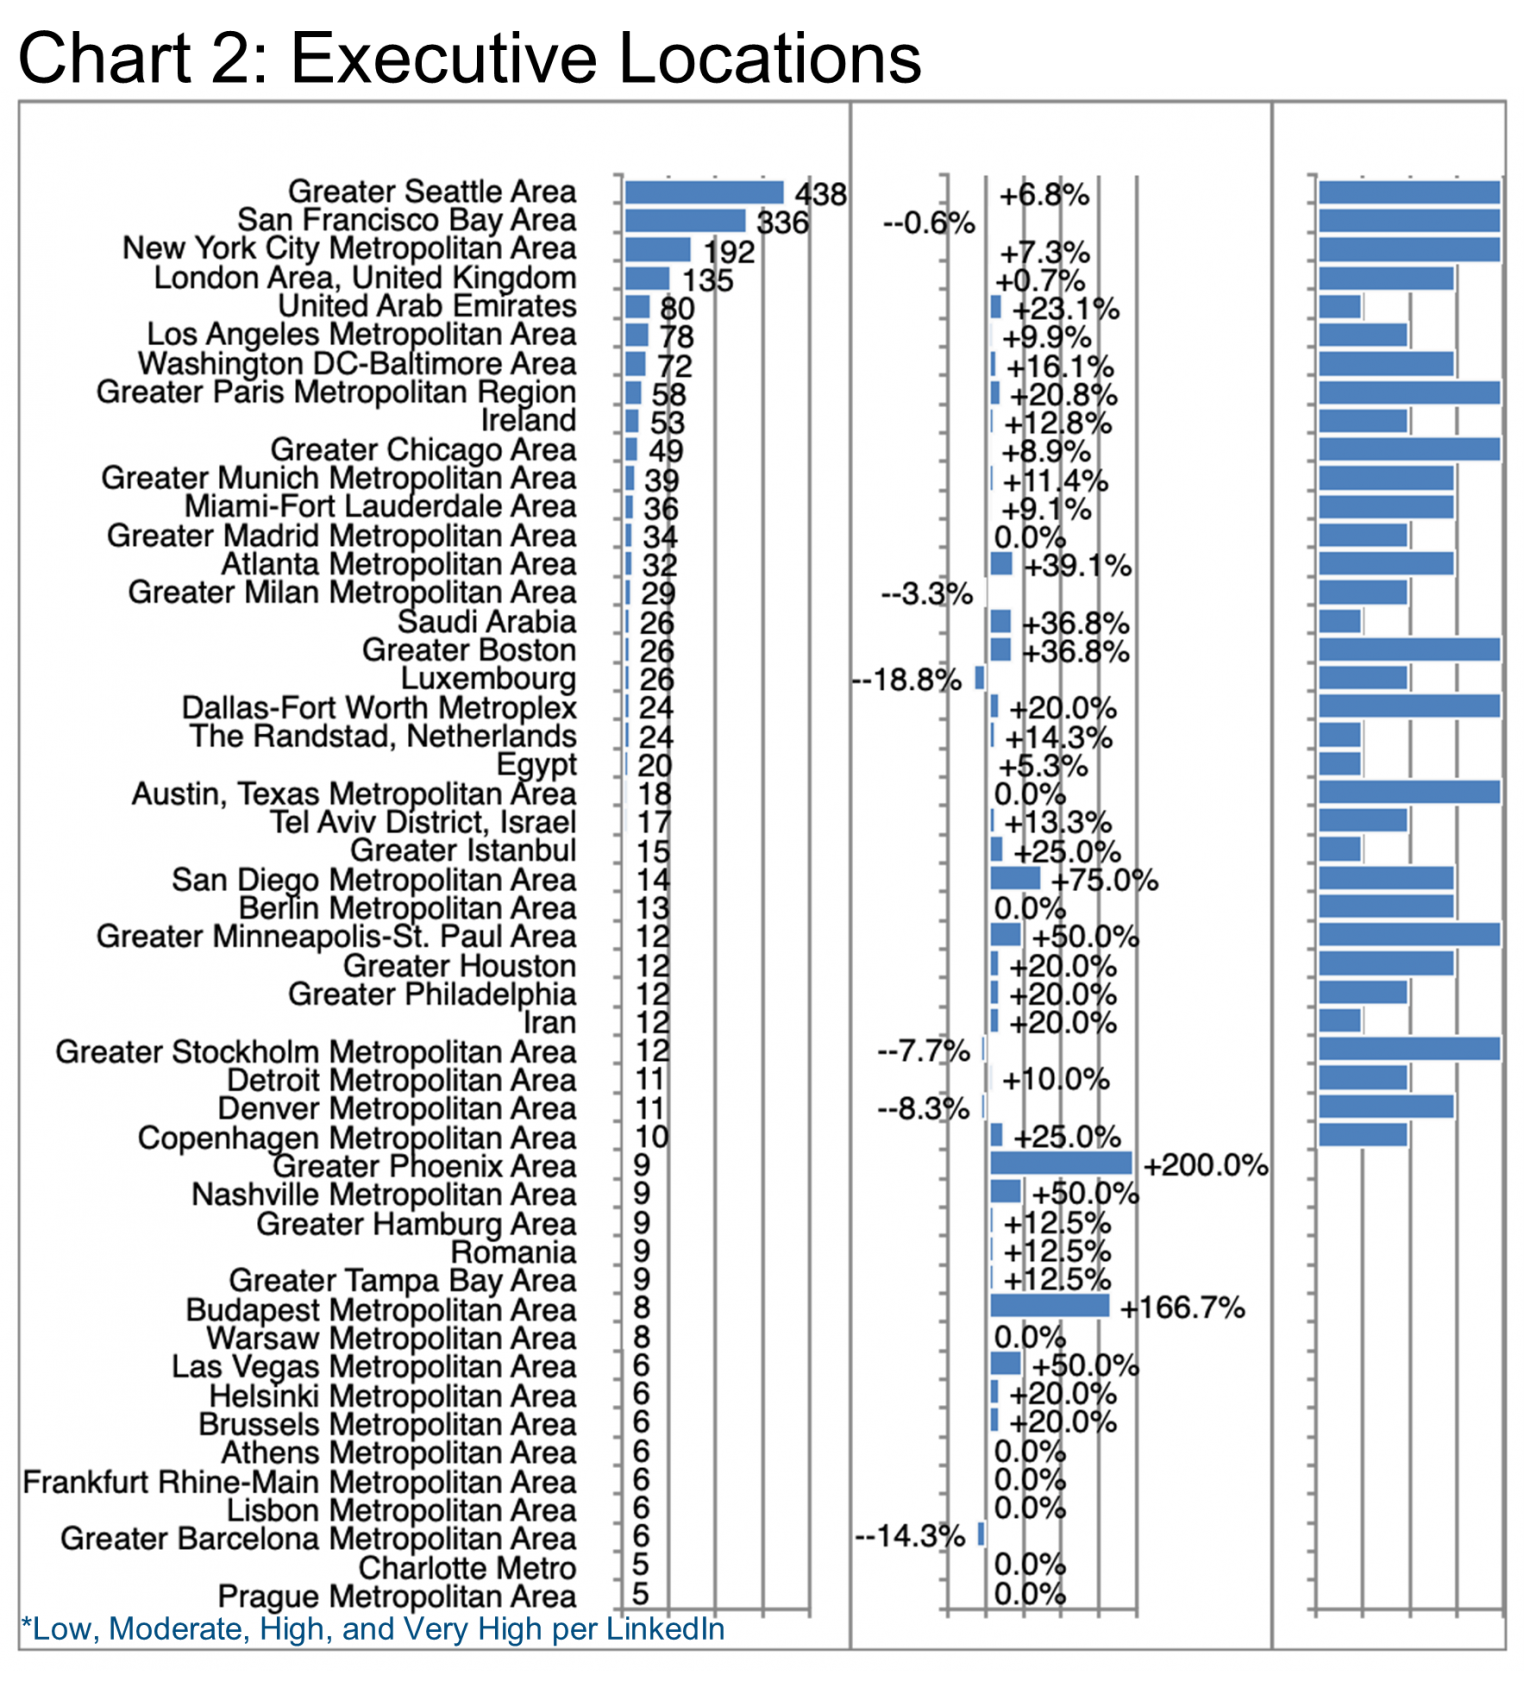
Big Tech has its own geography, too.
We see from Chart 2 where the preponderance of positions still lies on the West Coast followed by New York, London, and the UAE. Microsoft and Amazon predominate in Seattle with some 106,000 total staff between them while Apple, Google, and Meta employ 110,000 in the San Francisco Bay area. Google and Amazon employ about 34,000 in New York while the other three station a further 3,000-5,000 each in that city. Amazon has 11,000 or so in London while the others staff smaller contingents of 3,000-5,000 there. Executive populations reflect these employee concentration, of course. (See the Appendix for more details.)
Bearing in mind that most executives will have more than one string to their bows, so to speak, Chart 3 profiles the specializations of this executive population as they have recorded them in their LinkedIn profiles.
As a means for evaluating what is particularly important to these companies versus the mass of executive employers, let us compare specialization rankings. Taking the entire 8.5 million executive population that the Barrett Group refers to as “executives” in the US, EU, UK and Middle East (see Editor’s Note for further definition) as a baseline cohort, Cloud Computing does not even show up in the top fifty specializations. Strategic Partnerships does, however, though at a rather distant #45 in the ranking versus #2 for Big Tech, so clearly this is more important for the Big Tech cohort.
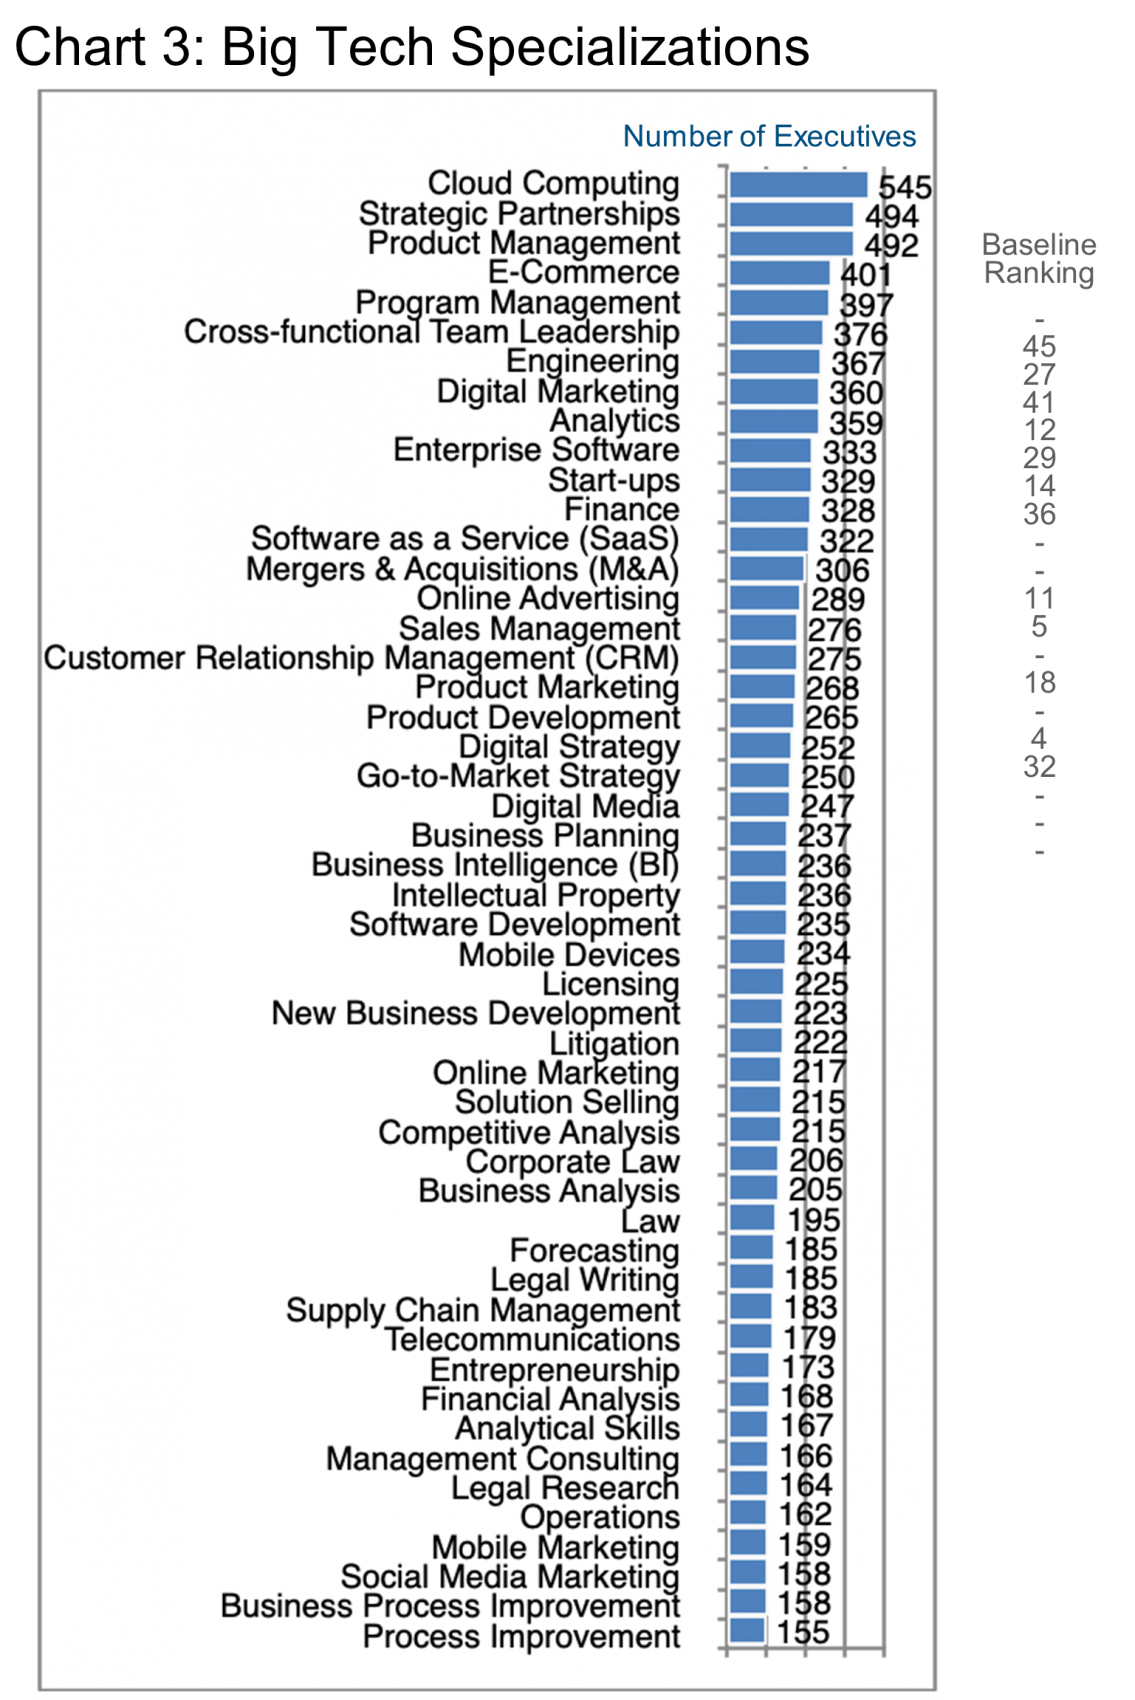
To simplify this comparison, we have added the Baseline Ranking for the first twenty Big Tech specializations in Chart 3 in the “Baseline Ranking” column. As a refresher, in Chart 4 we display also the top twenty specializations in the baseline cohort.
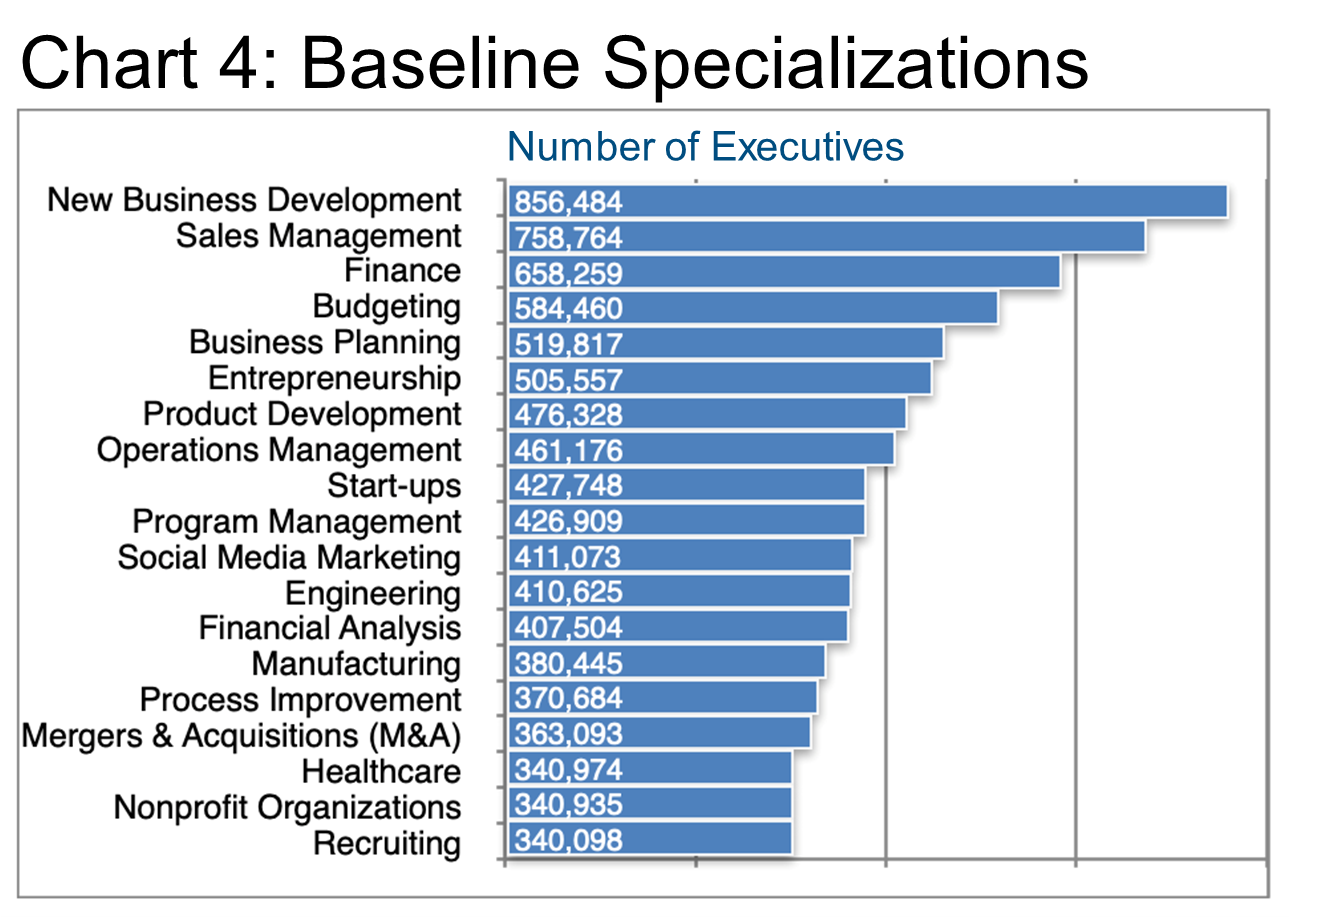
Even though the Big Tech firms are not highly comparable, they are all large in scale so that the degree of specialization is very different than in the baseline cohort.
Since most of their sales occur online they have a very different relationship to the sales function, for example, and do not require as many sales executives relative to their sales. The same is true with the New Business Development function probably for the same reason.
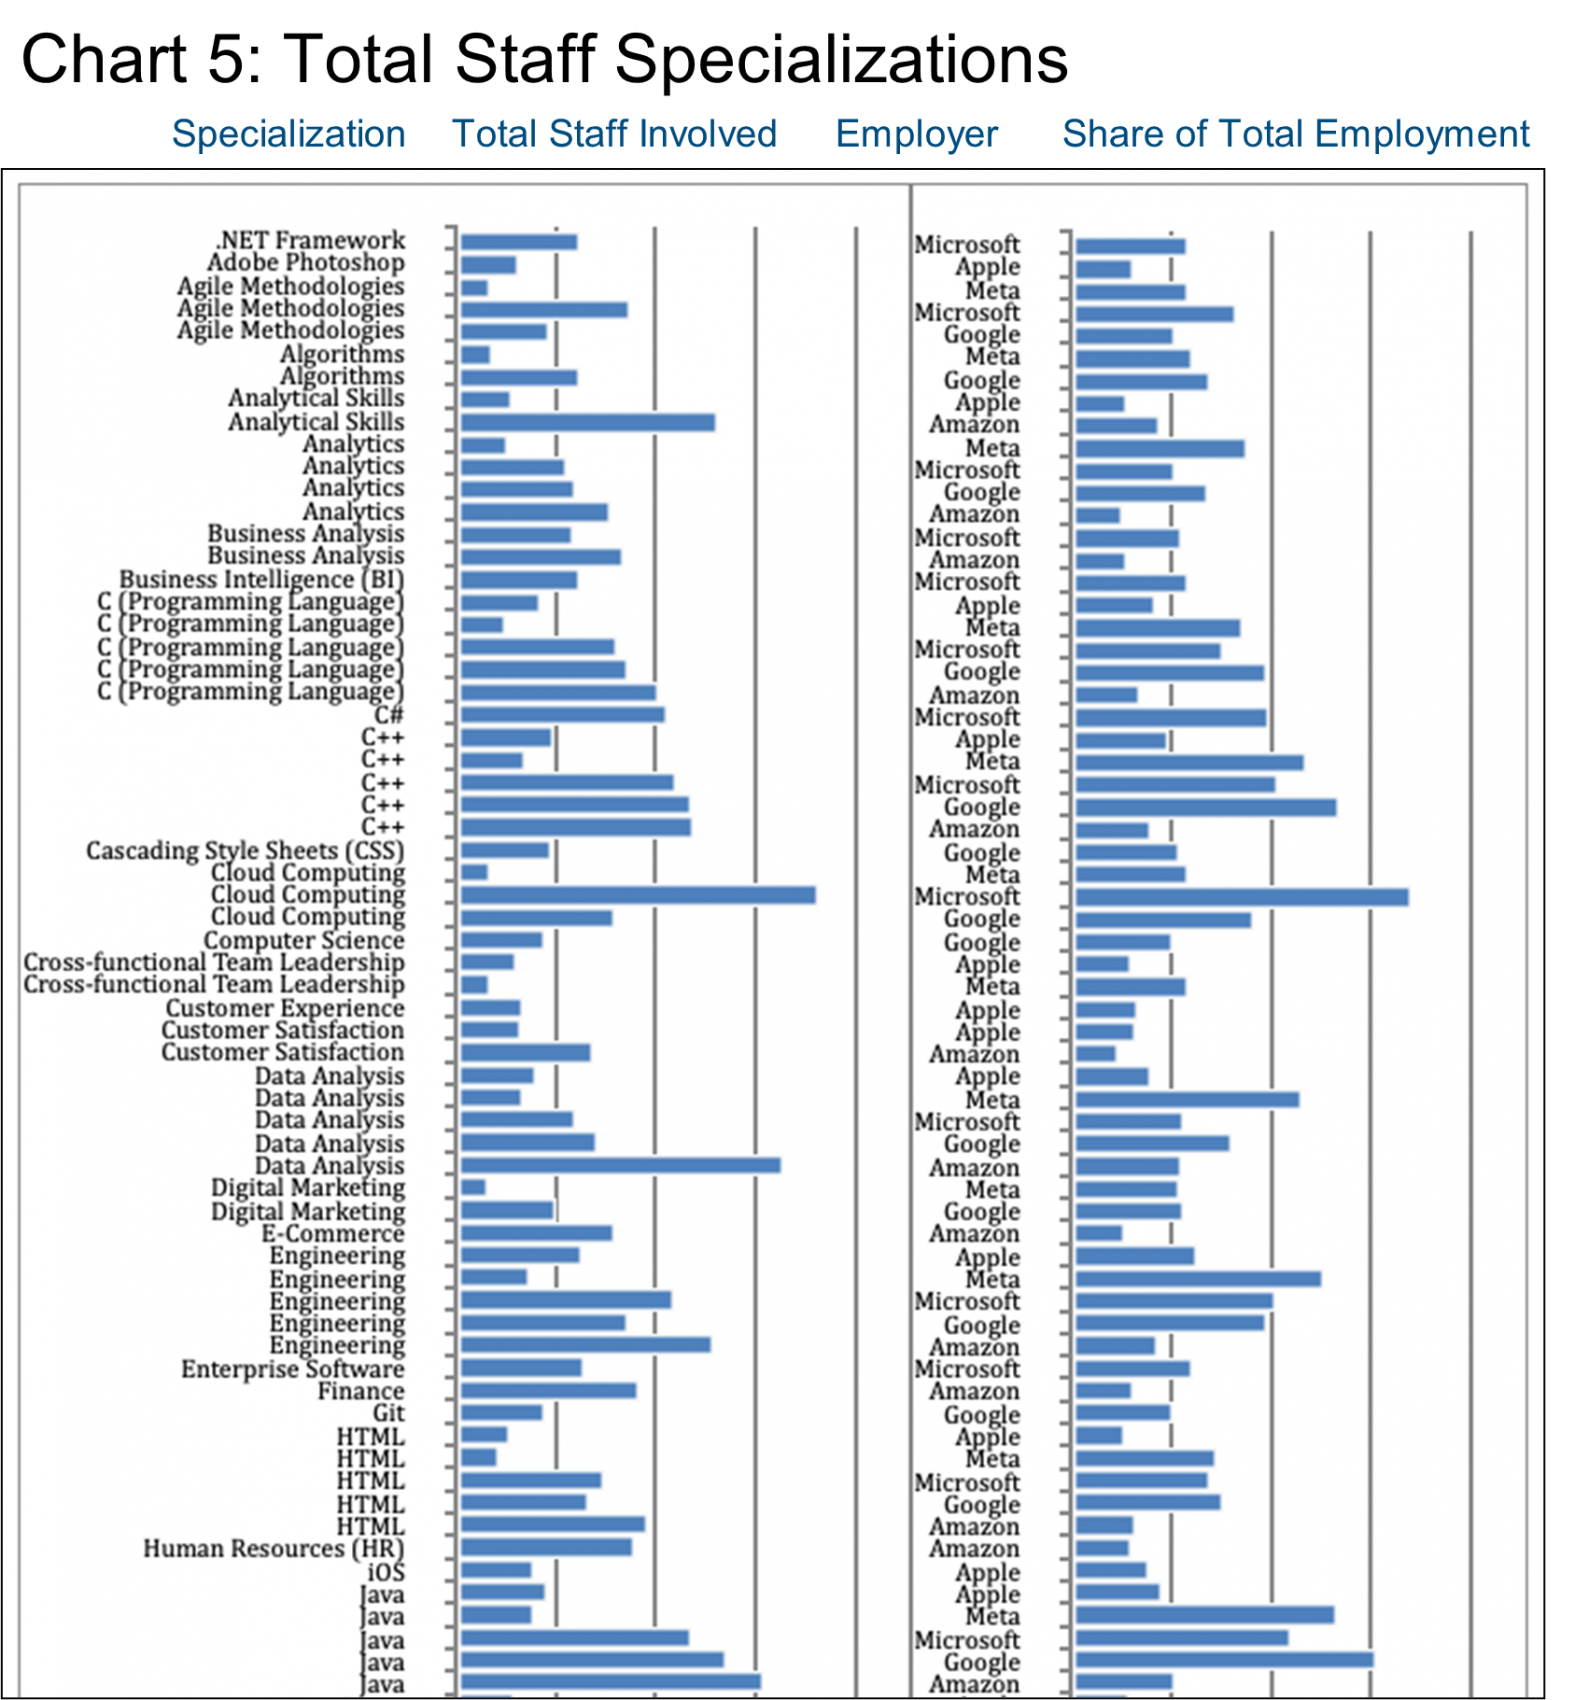
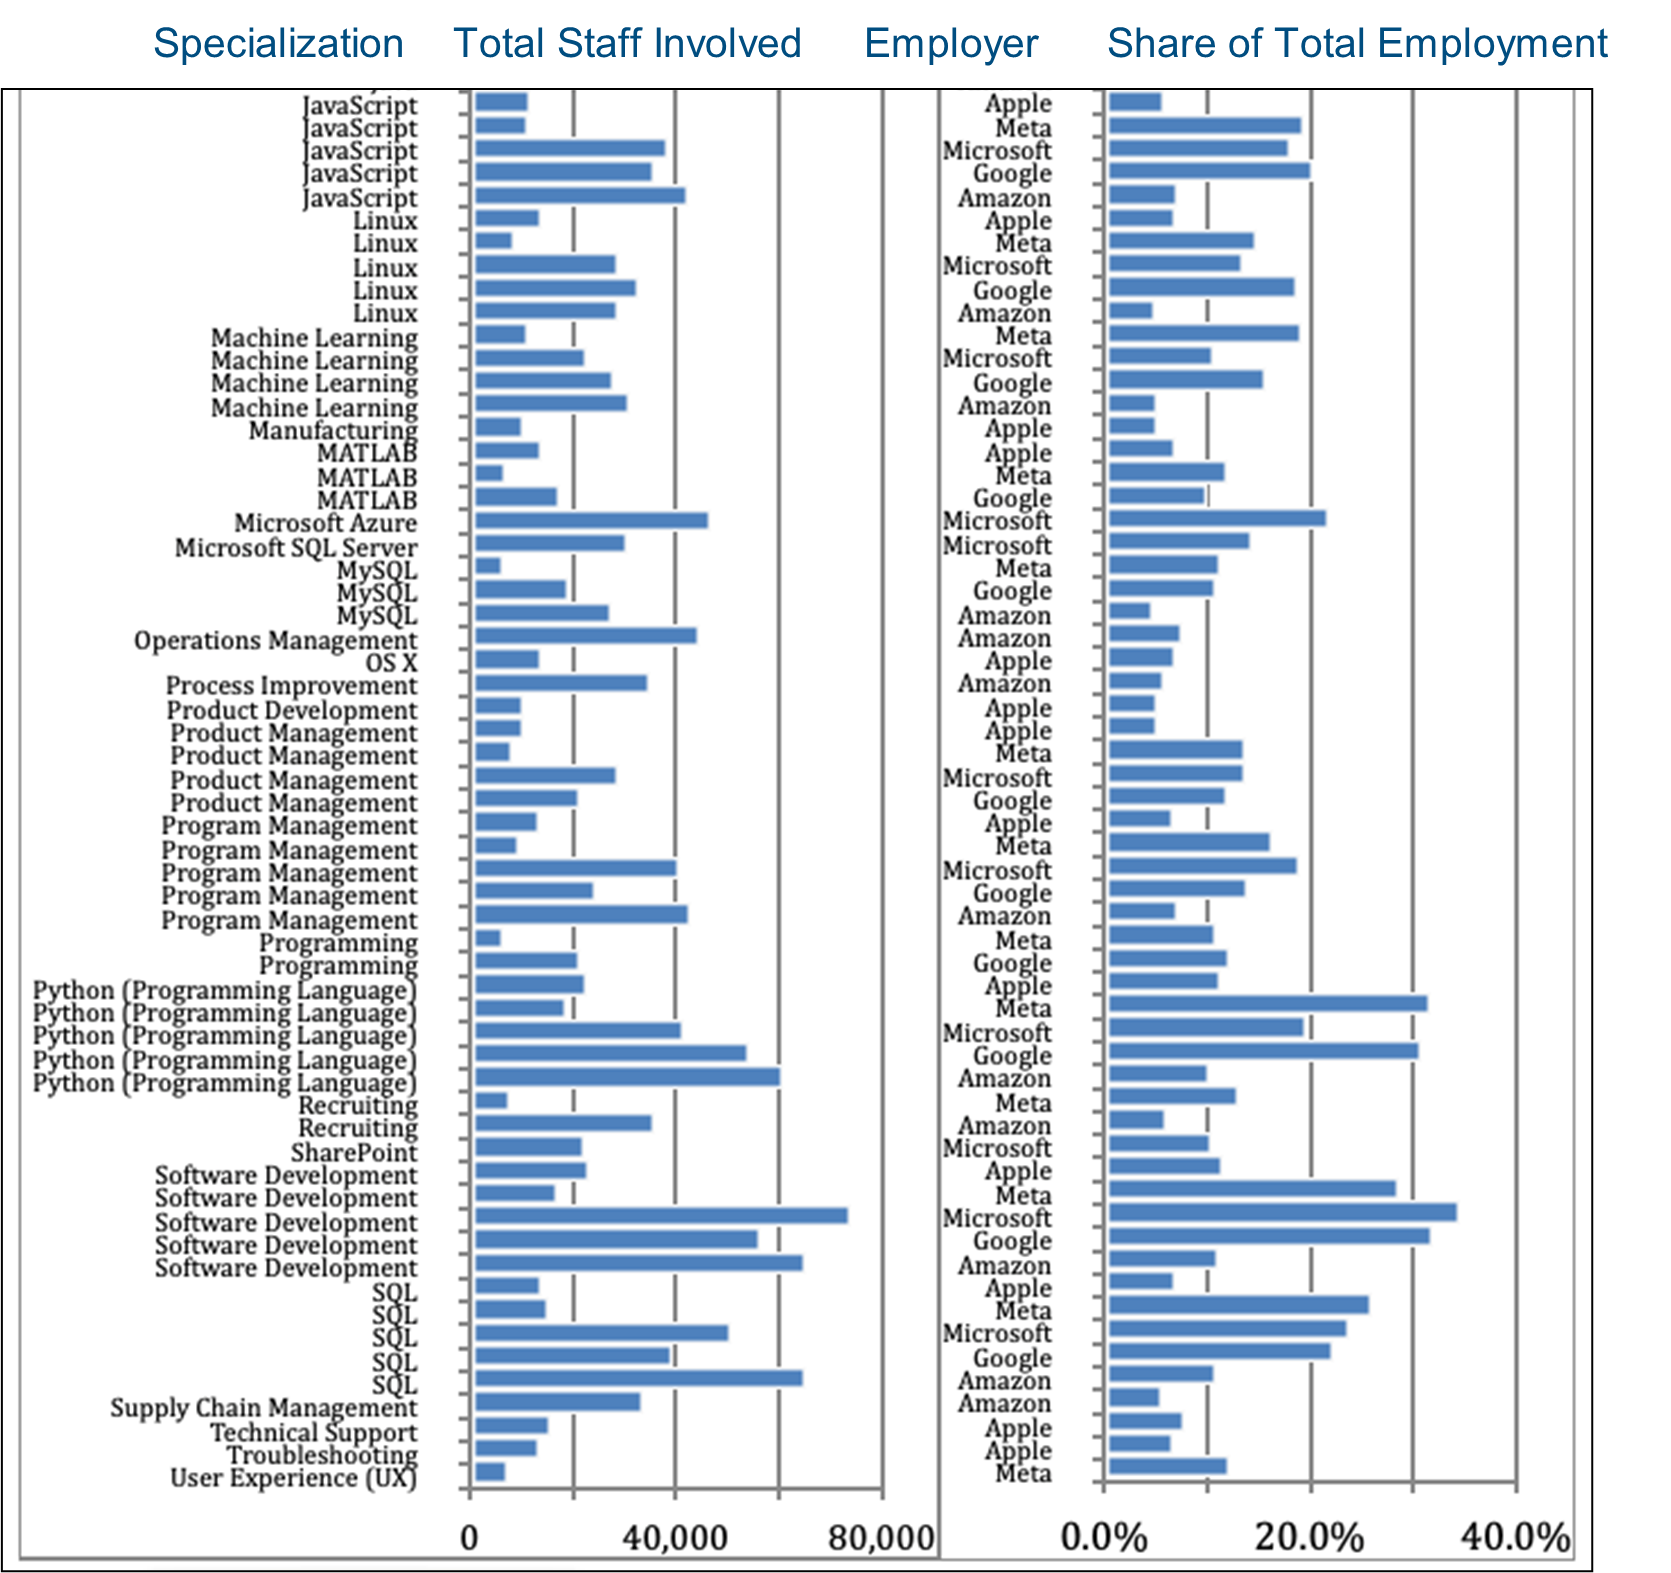
Barrett Group clients have access to considerably more granular data, of course, critical for choosing target employers or preparing for interviews. Here we can only offer general overviews that may prove helpful in the first stages of a career change initiative. Considering the vast resources that Big Tech puts into programming, it may be a little surprising not to see more executives involved in managing that function. As a sampling, please see Chart 5 that summarizes the programming employment (not only execs) within Big Tech. .Net Framework, C, C+, HTML, iOS, Java, Linux, Python, SQL… the list of software languages and the numbers involved are both fairly staggering. This may also explain some of the layoffs in 2022 and 2023: hiring greatly exceeded current requirements.
Contemplating Chart 5 there are also interesting dissimilarities such as Amazon’s focus on Supply Chain Management and Human Resources (given its enormous workforce), or the fact that only Apple and Amazon show significant resource under Customer Experience and/or Satisfaction. Perhaps other firms use other names for these skills.
Customarily in each Industry Update we like to examine the movement of staff to and from players experiencing large changes. This may not be a good time to make this assessment, however, because of the restructuring that has been announced by all but Apple among the Big Tech cohort.
Here is how one source put it: “Apple never hired at the pace of these other tech giants, […] You’ll see cost-cutting around the edges, but Cupertino — I mean, they’re tacticians…I think it just shows why Cook is a Hall of Fame CEO. And I think he’s able to navigate another situation here in terms of not needing to do the layoffs that other tech firms have done.” (See source.)
In fact, Apple seems to be on a talent acquisition spree at the moment based on the very short-term movements visible through LinkedIn, major talent donors include Amazon, Microsoft, Qualcomm, and Intel. Indeed industrially speaking, some 800 staff (not only executives) in the Semiconductor industry joined Apple in the past year, 500 from Higher Education, 400 from Apparel & Fashion, 400 from Retail, and another 270 from Telecommunications.
Alphabet (Google) shows a net 1,400 departures (all staff, not just executives) already in January 2023 per LinkedIn, but, looking back at the year past, there have also been significant staff additions from the Computer Software (+4,000), Internet (+2,600), IT & Services (+1,800), Higher Education (1,100), and Marketing & Advertising (+800) industries. Major donors included Amazon and AWS, Microsoft, Mandiant (now part of Google Cloud), Salesforce, Meta, Oracle, and even Apple.
Amazon despite prior and coming layoffs shows a gain in employment in January 2023 per LinkedIn. Over the past year, net talent acquisition (of all staff, not just executives) stems from the IT & Services area (+2,600), Higher Education (+2,400), Retail (+800), Banking (+900), and Management Consulting (+800). Major net talent donors included Accenture, Tata Consultancy Services, and Deloitte.
Microsoft shows a fairly stable total employment still in January per LinkedIn. Over the past year, industries of focus in terms of all staff have included Computer Software (+1,500), IT & Services (+3,000), Internet (+700), Higher Education (+900), Telecommunications (+900), Management Consulting (+700), Computer & Network Security (+400), Banking (+400), and Semiconductors (+400). Major sources for these employees comprised Amazon and AWS, Oracle, IBM, Accenture and Xandr.
Meta shows a spike in departures during January 2023, in line with its public pronouncements. Over the past year, the company has recruited staff (not just executives) significantly in the Computer Software (+1,800), Internet (+1,700), IT & Services (+700), Higher Education (+900), Banking (+400), Management Consulting (+240), Semiconductors (+240), Financial Services (+170), and Capital Markets (+160) industries. The major talent contributors included Amazon, Microsoft, Apple, Kustomer, and Capital One.
Chart 6 provides a window of comparison to e-commerce executives, albeit an imperfect one because e-commerce firms also differ widely in terms of their commercial objectives and service or product offerings, however, they do provide a useful comparison to Big Tech. Many of the industries we have just reported as being in focus for Big Tech also rank at the top of the list for e-Commerce, in particular IT & Services, Computer Software, Internet, Management Consulting, and Retail. As noted above, the number of Marketing & Advertising execs in Big Tech is relatively smaller most likely due to their sheer scale.
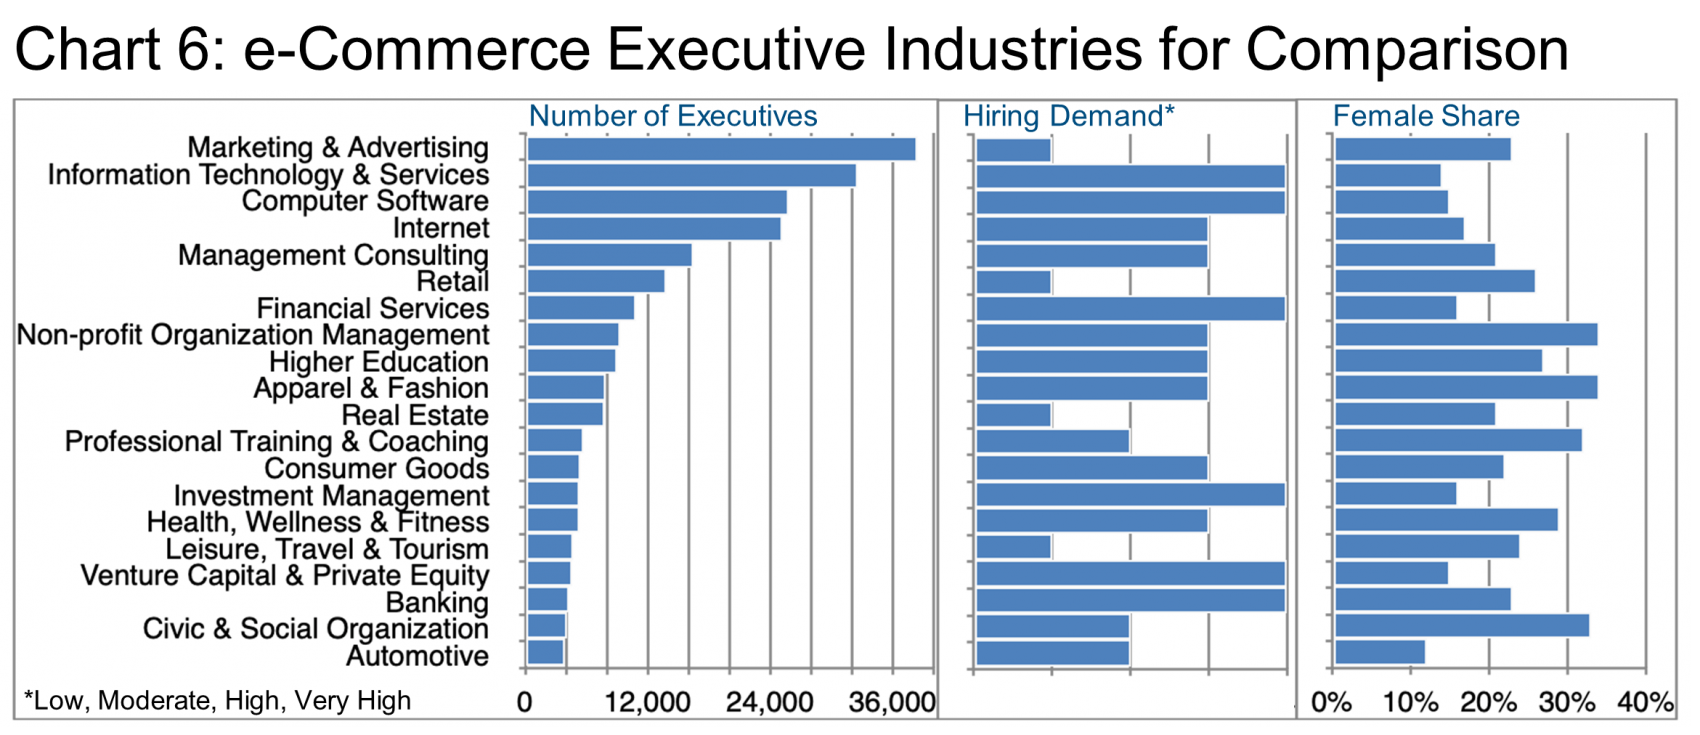
Note too that these industry executives (Chart 6) are not all equally in demand.
LinkedIn provides not only the growth data year over year per industry but also the relative strength of hiring demand. Higher Education, for example, shows up frequently in Big Tech’s hiring activity and is also in high demand per the e-Commerce cohort. On the other hand, Retail seems overall to experience lower demand though it did play a larger role for Apple and Amazon.
We do not have specific data from LinkedIn on the gender composition per company and therefore cannot profile this in the Big Tech cohort, but we can see from the aggregate e-Commerce data (Chart 6) that the share of female executives in these industries is relatively low overall with a few spikes in Non-profit Organization Management, Apparel & Fashion Professional Training & Coaching, and Civic & Social Organization. Big Tech and e-Commerce firms are all likely to be incentivized to improve this diversity performance over time hopefully because it makes good business sense or at least due to pressure from ESG investors.
We encourage readers to look beyond the short-term pain in the Big Tech companies and see the bigger picture. While Alphabet may yet have to shed business units due to regulatory pressure, none of these firms is in danger of capsizing. Rather, they all will be around in the longer term, though their business models may well morph surprisingly.
As one recently downsized executive told the Barrett Group, “It’s never a bad thing to have Google on your resume.” The same can be said for any of these Big Tech firms.
Research to the Rescue
Typically executives who come to the Barrett Group for assistance in their career change initiatives are not afraid of hard work, but they would rather put their efforts into well-directed campaigns supported by strong research so as to have a high likelihood of achieving their professional objectives as quickly as possible.
By this time, readers may have gained an appreciation for the amount of information that the Barrett Group can and does provide to our clients. We also support each client with a six-member team including a research expert who can help sharpen the target(s) and shorten the road to success.
We make it our job to help you find yours! (Read more.)
Peter Irish, CEO
The Barrett Group
Click here to for a printable version of Industry Update – Big Tech 2023.
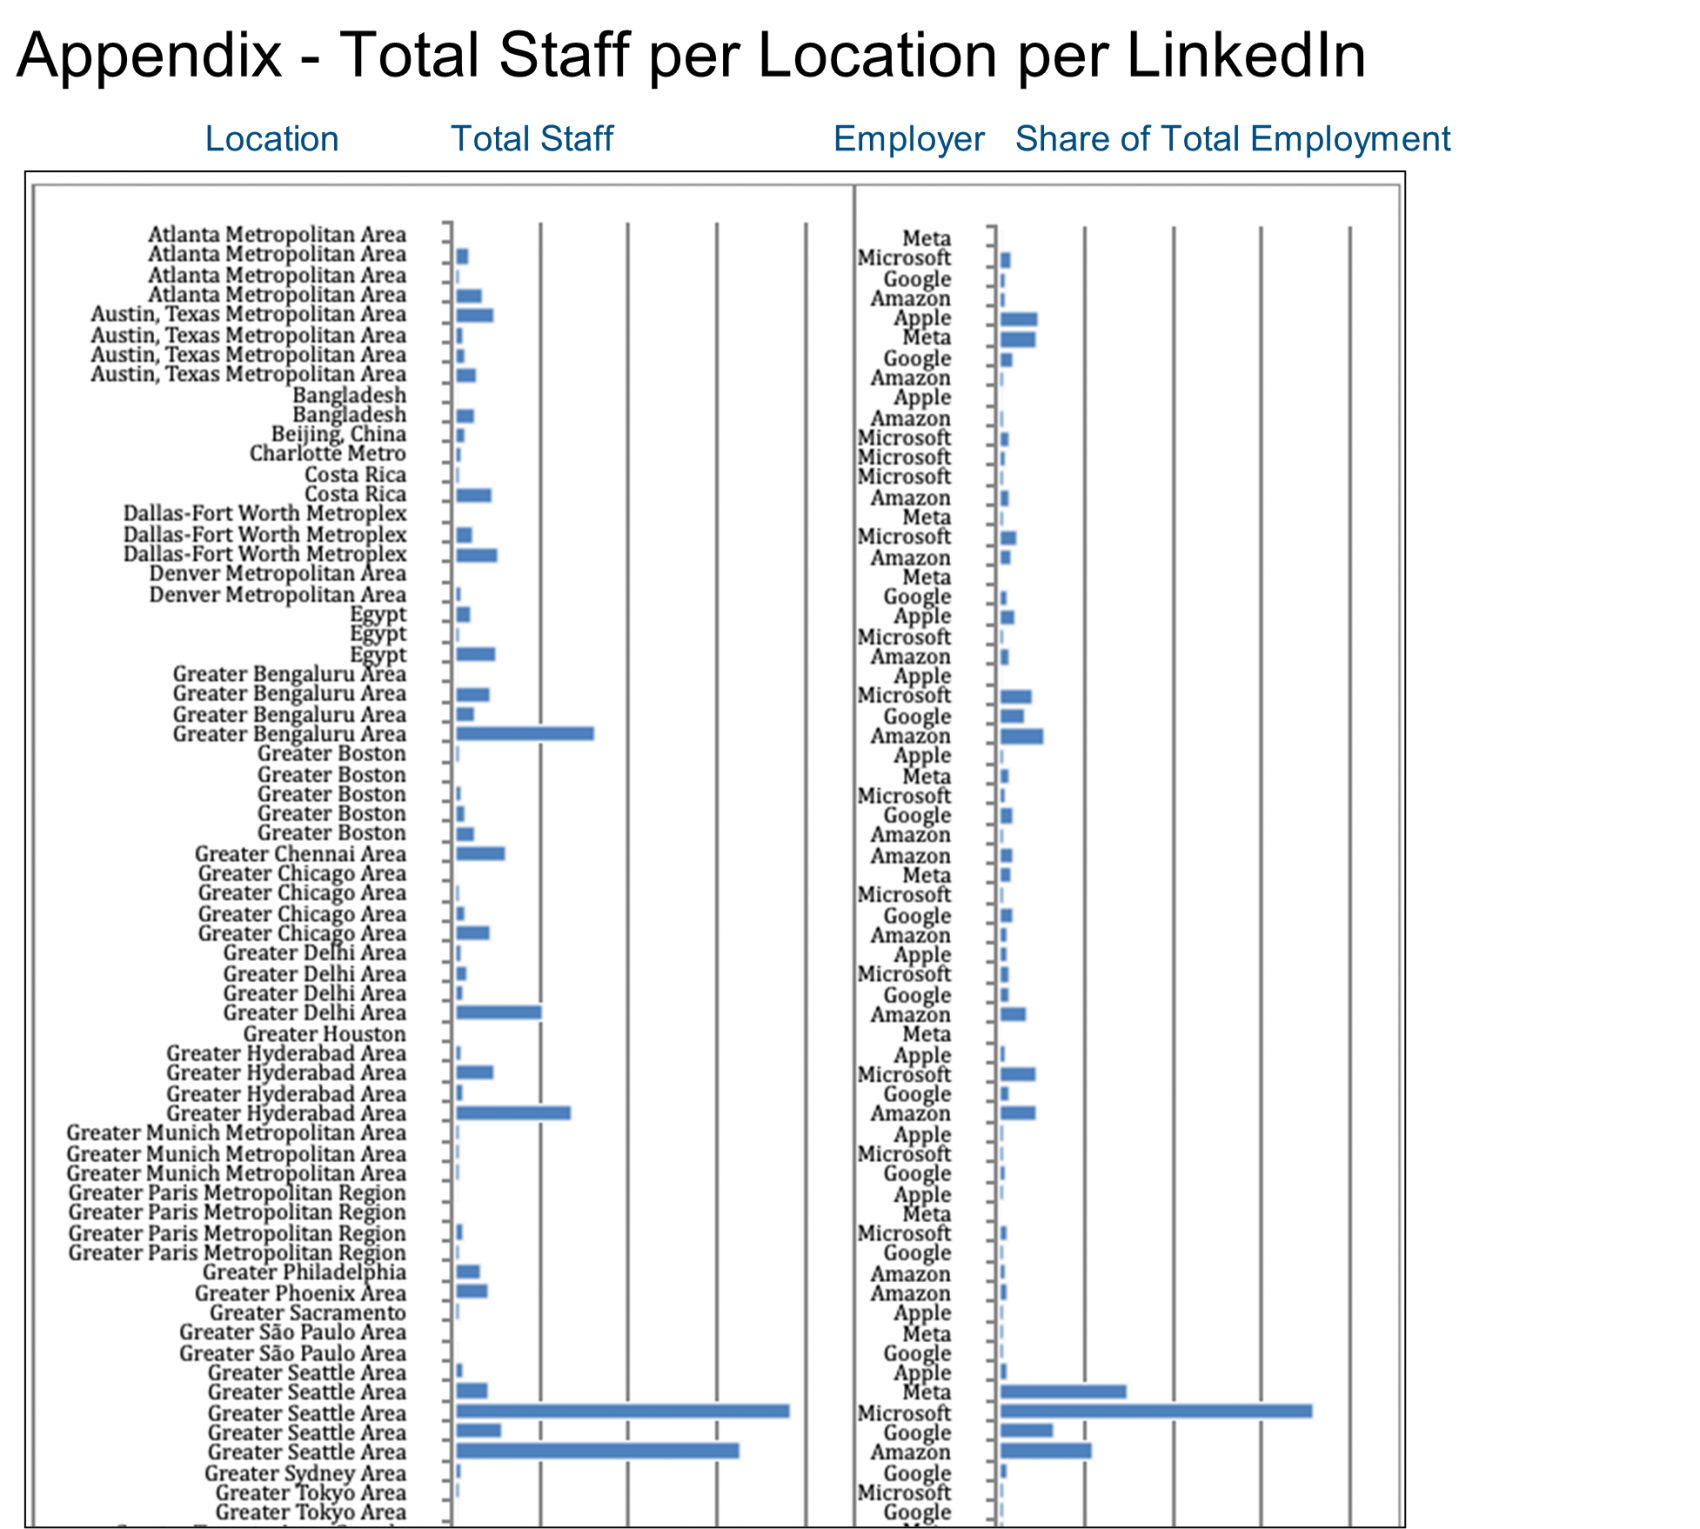
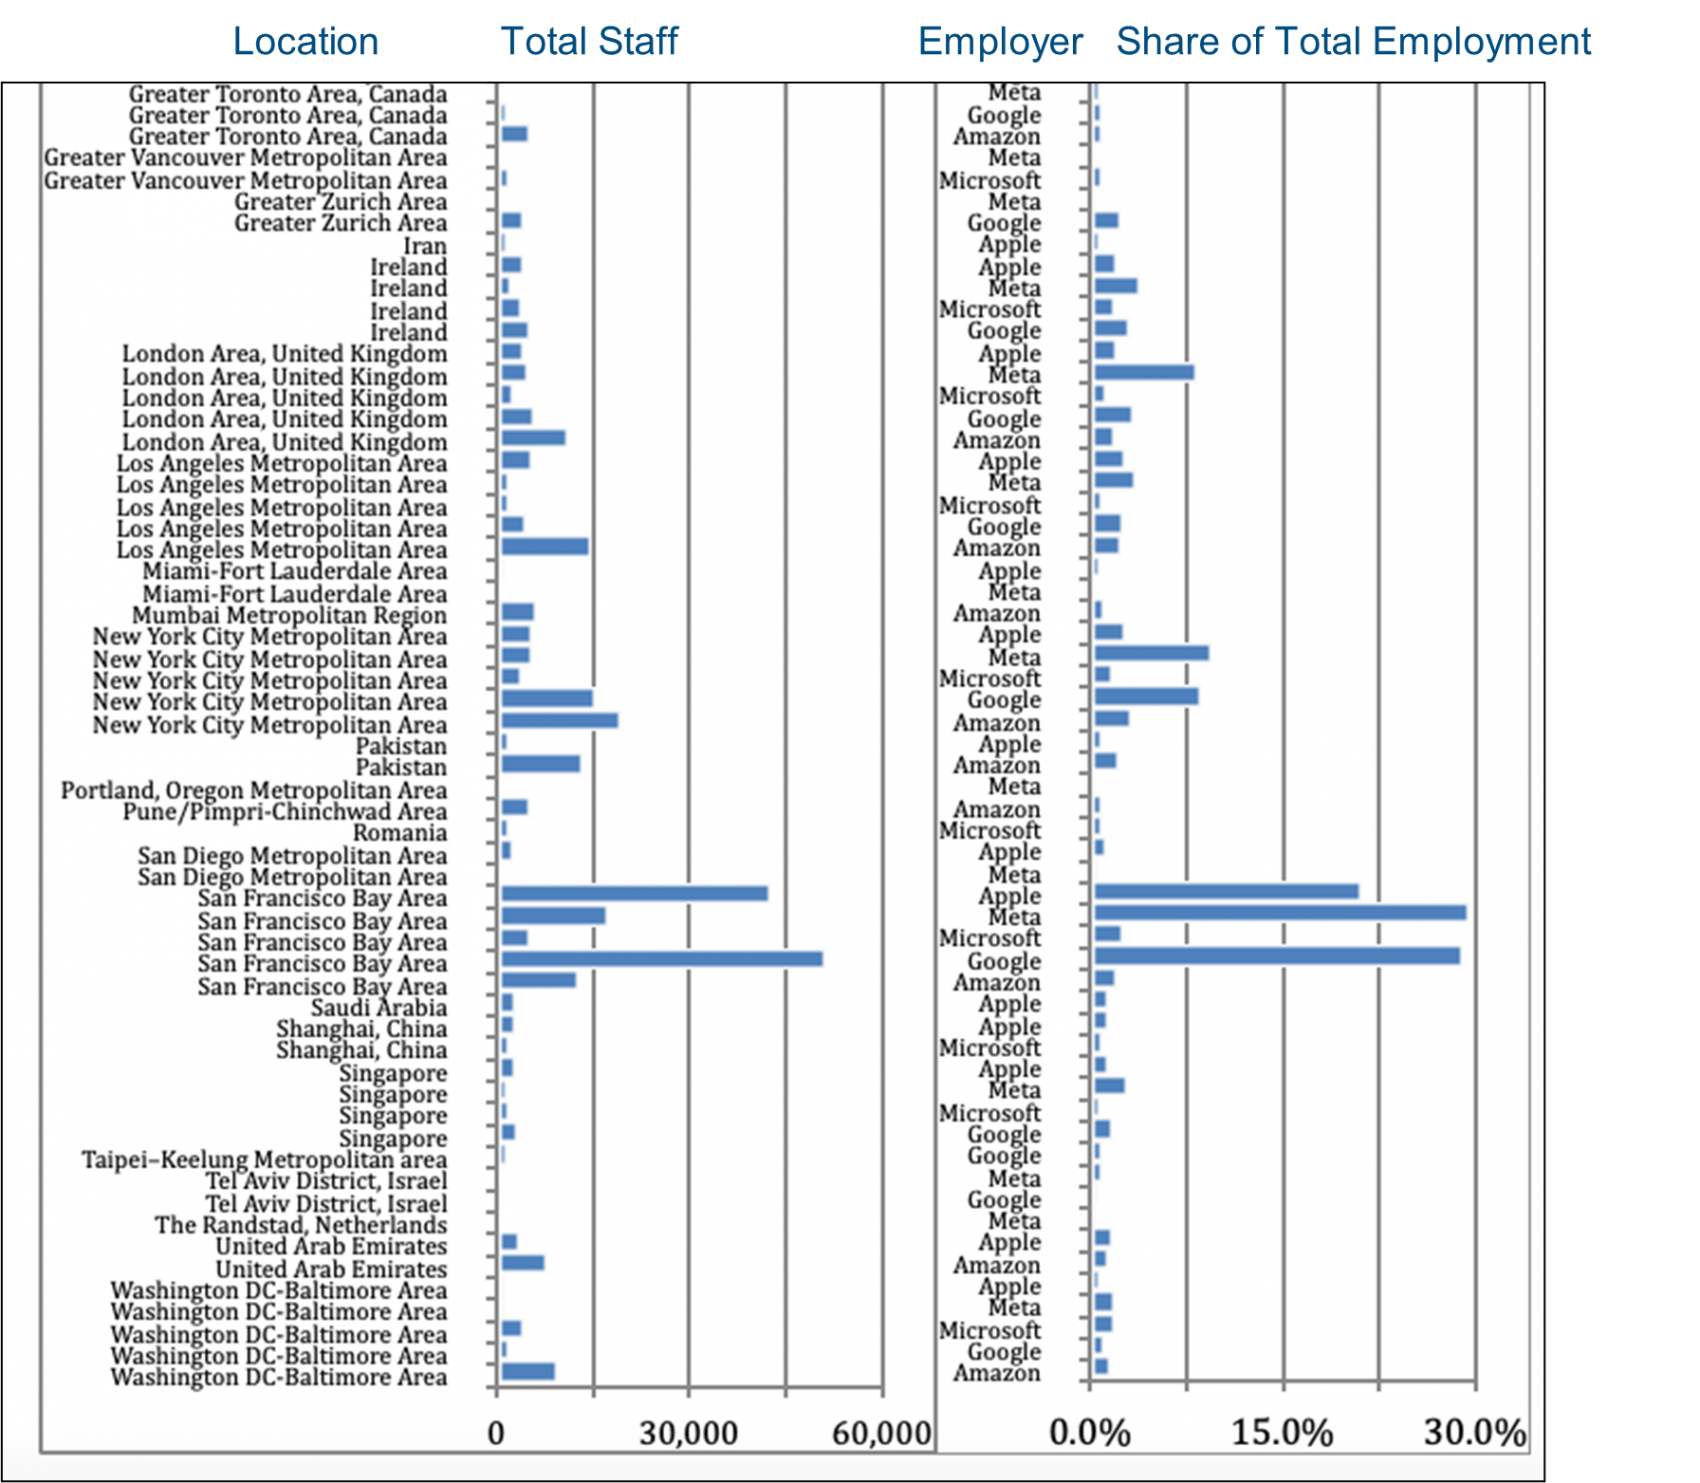
Appendix – Total Staff per Location per LinkedIn
This detailed location data may well exceed some readers’ level of interest. Still industry observers will find it interesting to note the geographic resonance or dissonance between these firms. We have already noted the importance of Seattle for Microsoft and Amazon versus the emphasis on San Francisco for Meta, Google, and Apple.
Other locations are perhaps even more interesting as they reveal different emphases: Meta in London, for example, or Bengaluru, Toronto, the UAE, and Washington DC for Amazon. What does Google do in Zurich? How does Ireland fit in for Apple, Meta, Microsoft and Google? What does this mean for executives who want to change countries and companies?
Fortunately, our research team can help curious clients answer these and many other questions.
Editor’s Note:
In this particular Update, “executives” will generally refer to the Vice President, Senior Vice President, Chief Operating Officer, Chief Financial Officer, Managing Director, Chief Executive Officer, Chief Human Resources Officer, Chief Marketing Officer, Chief Information Officer, Managing Partner, General Counsel, Head, and President titles. Unless otherwise noted, the data in this Update will largely come from LinkedIn and represents a snapshot of the market as it was at the time of the research.
Is LinkedIn truly representative?
Here’s a little data: LinkedIn has more than 800 million users. (See source.) It is by far the largest and most robust business database in the world, now in its 19th year. LinkedIn defines the year-over-year change (YOY Change) as the change in the number of professionals divided by the count as of last year. “Attrition” is defined as the departures in the last 12 months divided by the average headcount over the last year.