
INDUSTRY UPDATE: Marketing & Advertising – June 2022
Introduction
Perhaps no other industry has proven as adaptable to market conditions as the marketing and advertising industry. Marketing and Advertising was once confined to print, radio, TV, and outdoor, and highly dependent on the margin from media buys. Today, this industry has burgeoned into all manner of new and previously inconceivable channels. It is now encompassing the internet, social media, and innovative forms of influencing. Those such as Tik-Tok and its ilk, are changing the very revenue generation mechanics in the process. Where will this infinitely flexible industry be in a few years?
Forbes highlights the following key trends affecting the industry. Trends of which presage a need for agility and an increasing tendency to utilize information to more effectively market to individuals (See Source.):
- Pivoting with shifting tactic effectiveness.
- Evolving a brand to fit each channel.
- Emphasizing comfort and delight.
- Building first-party data strategies.
- Driving one-to-one marketing with AI.
From the financial perspective, Statista shares these overall spend projections from 2021 to 2025. These are for the US advertising market in billions. And they foretell the continued explosion of the Internet as a marketing medium and the decline of print media (See Source.):
- Internet – from $153.2 (2021) to $200.3 (2025).
- TV – from $72.3 to $81.2.
- Radio – from $17.7 to $18.8.
- Consumer magazine – from $12.7 to $11.6.
- Out-of-home – from $8.4 to $12.1.
- Newspaper – from $13.6 to $11.9.
Overall, spending on advertising is forecast to balloon:
“Advertising is a multi-billion-dollar industry that continues to expand in size and influence each year. In 2021, global ad revenue reached an estimated 763 billion U.S. dollars, marking a boost of more than 22 percent compared to the previous year while also outperforming pre-pandemic levels. A swift upswing in spending is also unfolding across Europe, one of the largest advertising markets worldwide. In 2021, European ad spend reached its highest figure to date at over 146 billion U.S. dollars.” (See Source.)
A booming market suggests that there will also be a lot of demand for executives. Ones that are needed to make smart decisions about how best to capitalize on the underlying industry growth dynamic.
So let us look more closely at the executives who make this happen today.
Marketing and Advertising Executives
LinkedIn suggests there are approximately 292,000 executives in this industry as we define them (See Editor’s Note for definition). Specifically in this Update, we are excluding those executives we can identify as self-employed (approximately 1% of the total population). This is because such executives are simply less likely to hire additional executives and those contribute to growth in demand.
This market produced a relatively high 2.7% “churn” of executives changing jobs in the past year. There are another roughly 3,000 new positions. This is for a total new or vacant position opportunity of 11,000 slots. Average tenure stands at about 3.3 years. At the macro-level, LinkedIn suggests these executives are in “high” demand. But LinkedIn also suggests that this population is lamentably lopsided with respect to gender at only about 28% female.
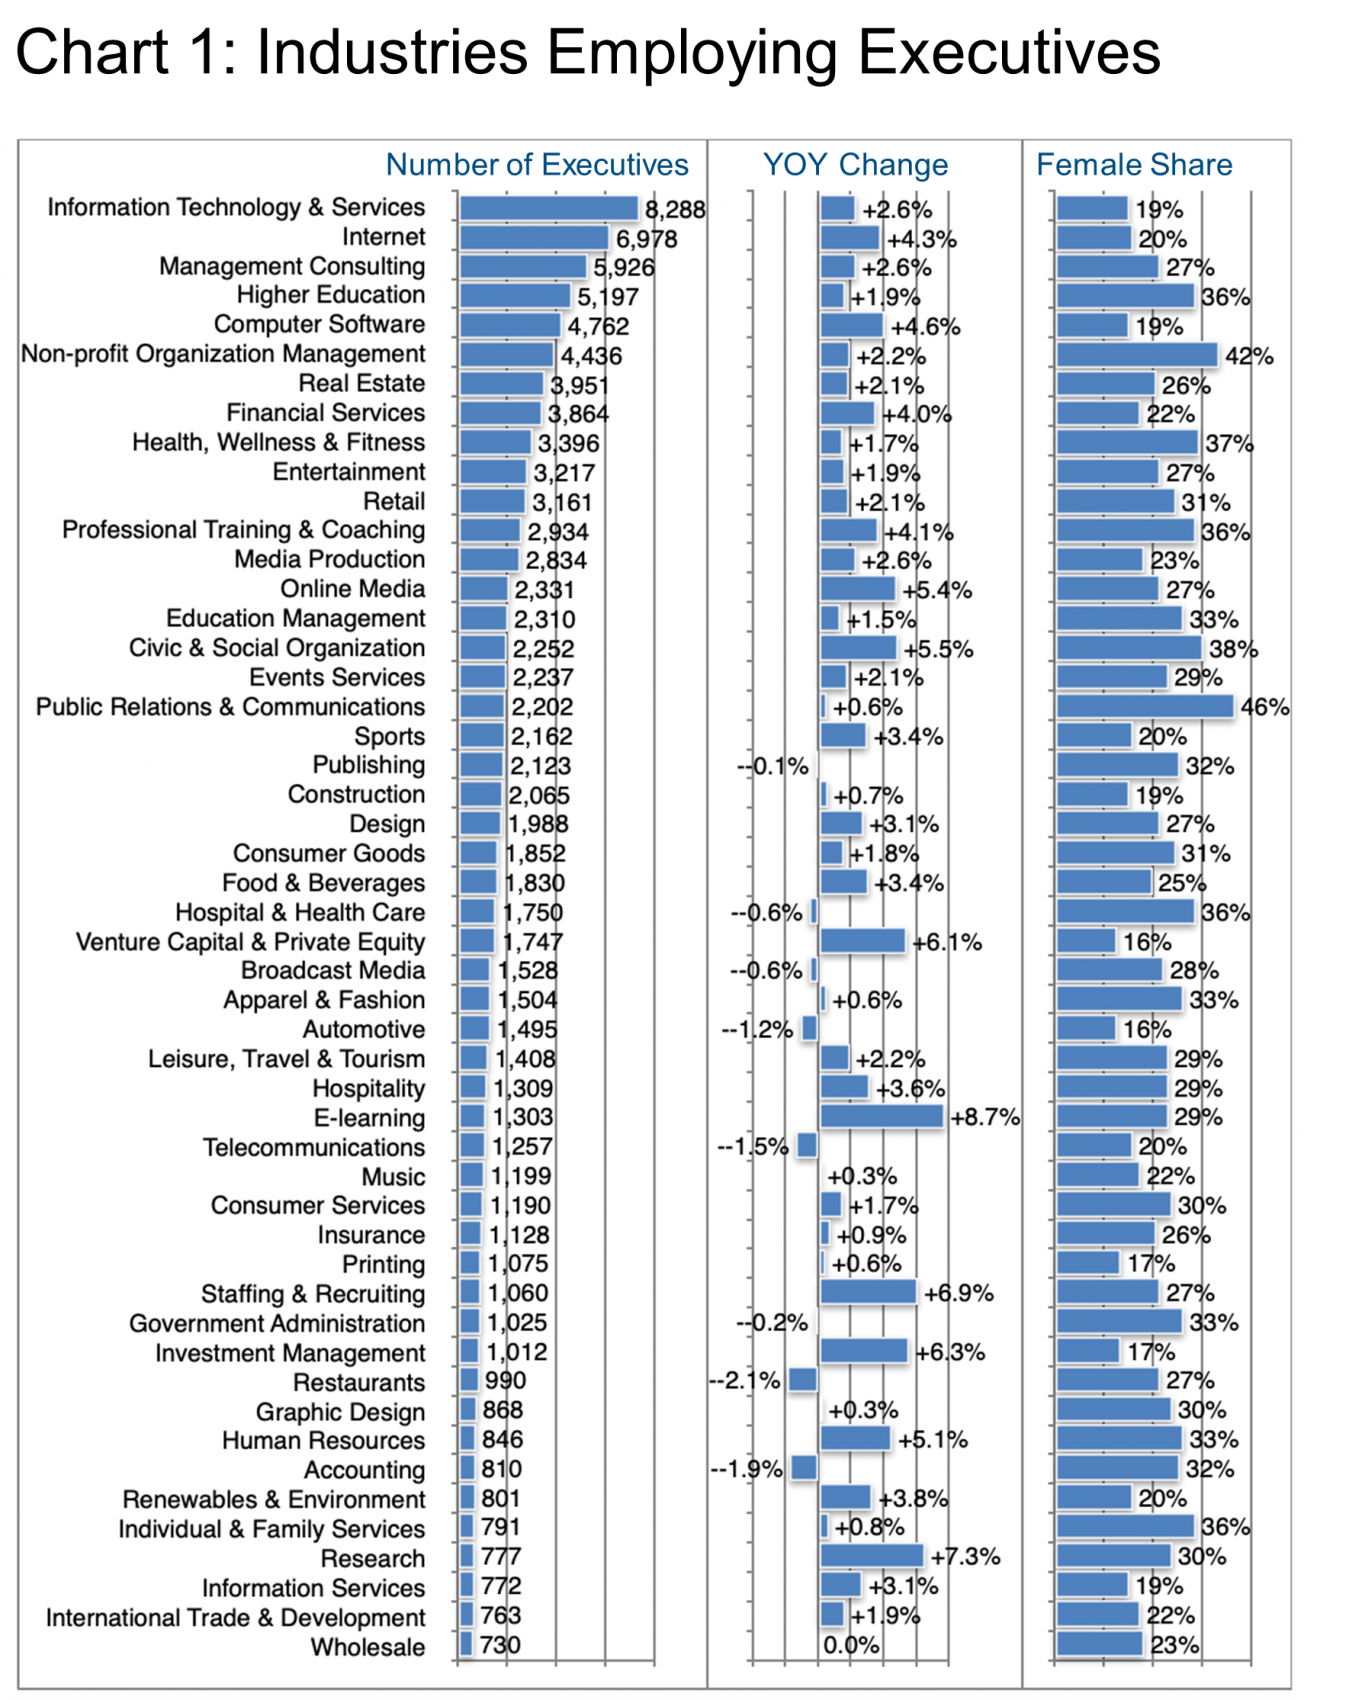
This population also highlighted specific industries of focus. This suggests where the hottest hiring action has been at least in year-on-year (YOY) percentage terms, specifically:
- E-learning (+8.7%)
- Research (+7.3%)
- Staffing & Recruiting (+6.9%)
- Investment Management (+6.3%)
- Venture Capital & Private Equity (+6.1%)
Chart 1 goes on to provide an overview of the top fifty industries’ employing these executives. It includes the number employed, annual growth rates, and female participation. On the latter subject, it is always encouraging to see specific segments with a higher female share such as Public Relations & Communications or Non-profit Organization Management at 46% and 42% female respectively.
Growth is not everything, though, as the absolute largest pockets of opportunity in this industry segment lie in these top hiring verticals:
Marketing Executives Added – Industry Segment
303 – Internet
219 – Information Technology
219 – Computer Software
155 – Financial Services
154 – Management Consulting
125 – On-line Media
123 – Civic & Social Organization
121 – Professional Training & Coaching
113 – E-learning
106 – Venture Capital & Private Equity
1,638 – Subtotal (approximately 20% of total new positions)
As readers can see above, these top ten industrial segments generated about 20% of the new executive positions in the past year. LinkedIn also flags all of these as having “High” or “Very High” hiring demand.
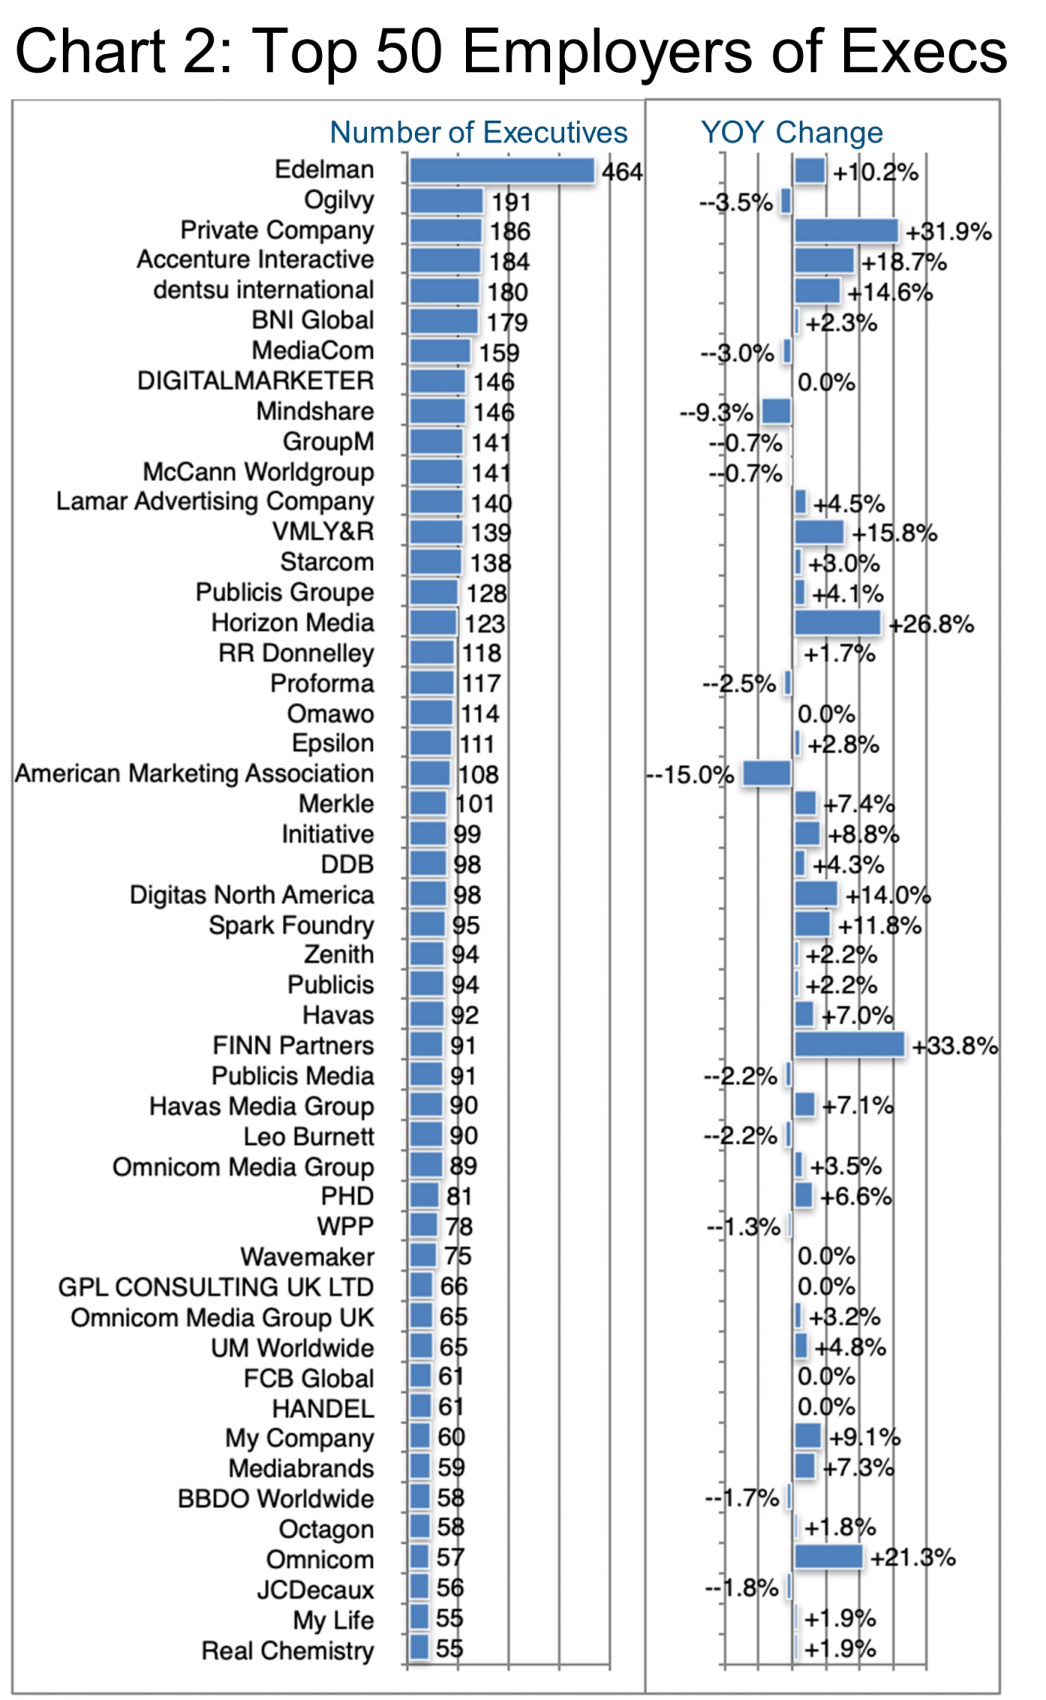
Chart 2 profiles the top 50 employers of executives in this industry and their respective change in the number of executives employed over the past year.
Edelman now stands out at the top of the list, having grown its executive ranks by 10% in the past year. According to LinkedIn, Weber Shandwick, Golin, Ketchum, and Ogilvy were all net donors to Edelman in the past year with a significant pickup in hiring activity from January 2022. On the other hand, BCW Global, FleishmanHillard, and Hill+Knowlton Strategies attracted more talent from Edelman than they provided in the same period.
At number 2 on the list, Ogilvy seems to be retooling its executive ranks with departures outpacing acquisitions over the past year. While gaining from Leo Burnett, McCann Worldgroup, Wunderman Thompson, and MullenLowe Lintas Group, Ogilvy has seen a net loss of talent to VMLY&R and Media Monks among others.
The American Marketing Association on the other hand, apparently reduced its executive ranks by 15%. Overall (not only including executives), LinkedIn reports these reductions as being mainly in the Finance, Community & Social Services, Media & Communication, and Business Development functional areas, specifically in Orlando, Tampa Bay, and Washington DC.
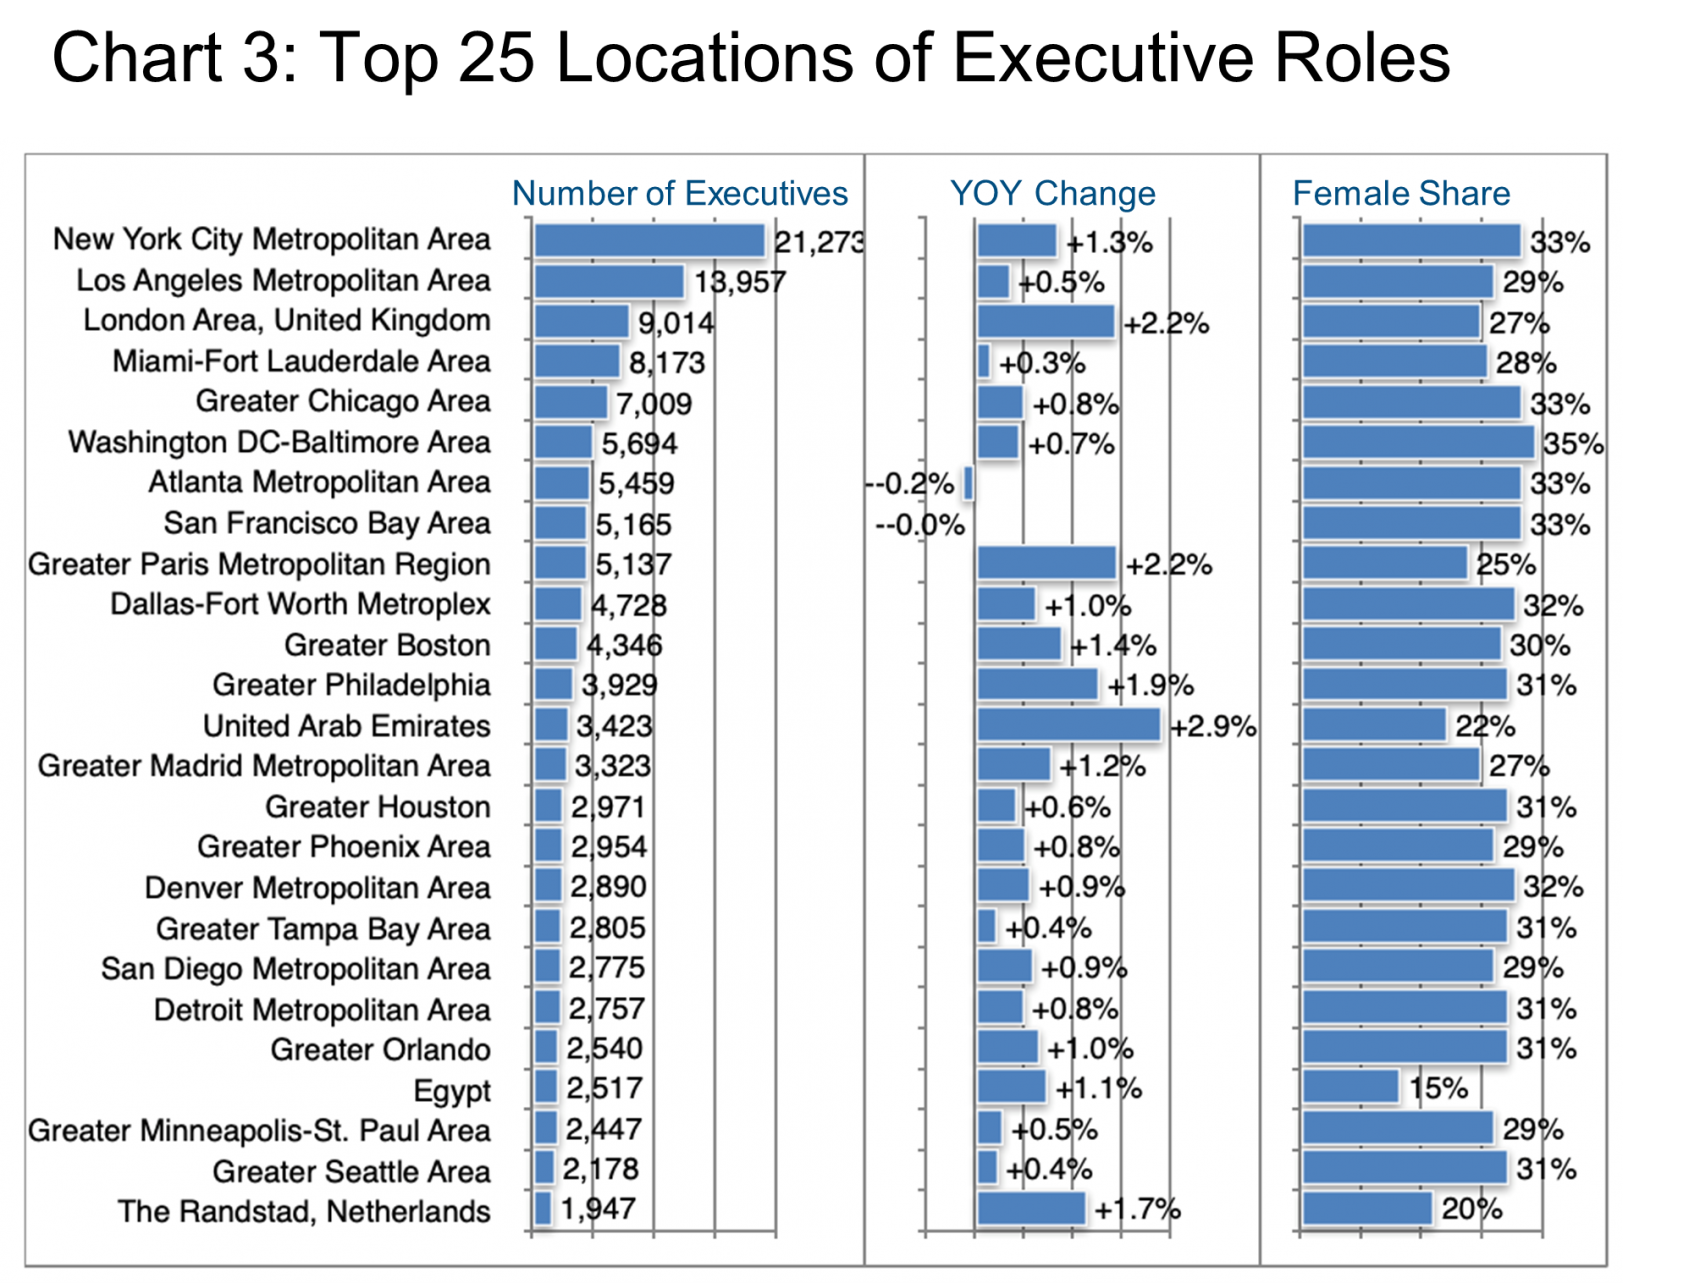
Readers of these Industry Updates will recognize that New York usually ranks number one for executives, though it often sports lower than average growth as a result. Los Angeles also often comes in as number two, however, it is rare for a European location to rank in the top three, but in this case, London comes in third in terms of the total executives employed in this industry.
Growth in the executive ranks as we have seen correlates more to the industry vertical employing the executives and to specific companies than it does to location. However, the highest growth by location seems to be outside of the US as the UAE, London and Paris top the bill at 2.9%, and 2.2% respectively. These are also demonstrating the lowest shares of female executives in the top 25 locations.
What do the Marketing & Advertising executives we are reviewing in this Update actually do? LinkedIn records specializations (Skills) that executives list in their profiles and this data provides considerable insight into how these executives see the content of their roles.
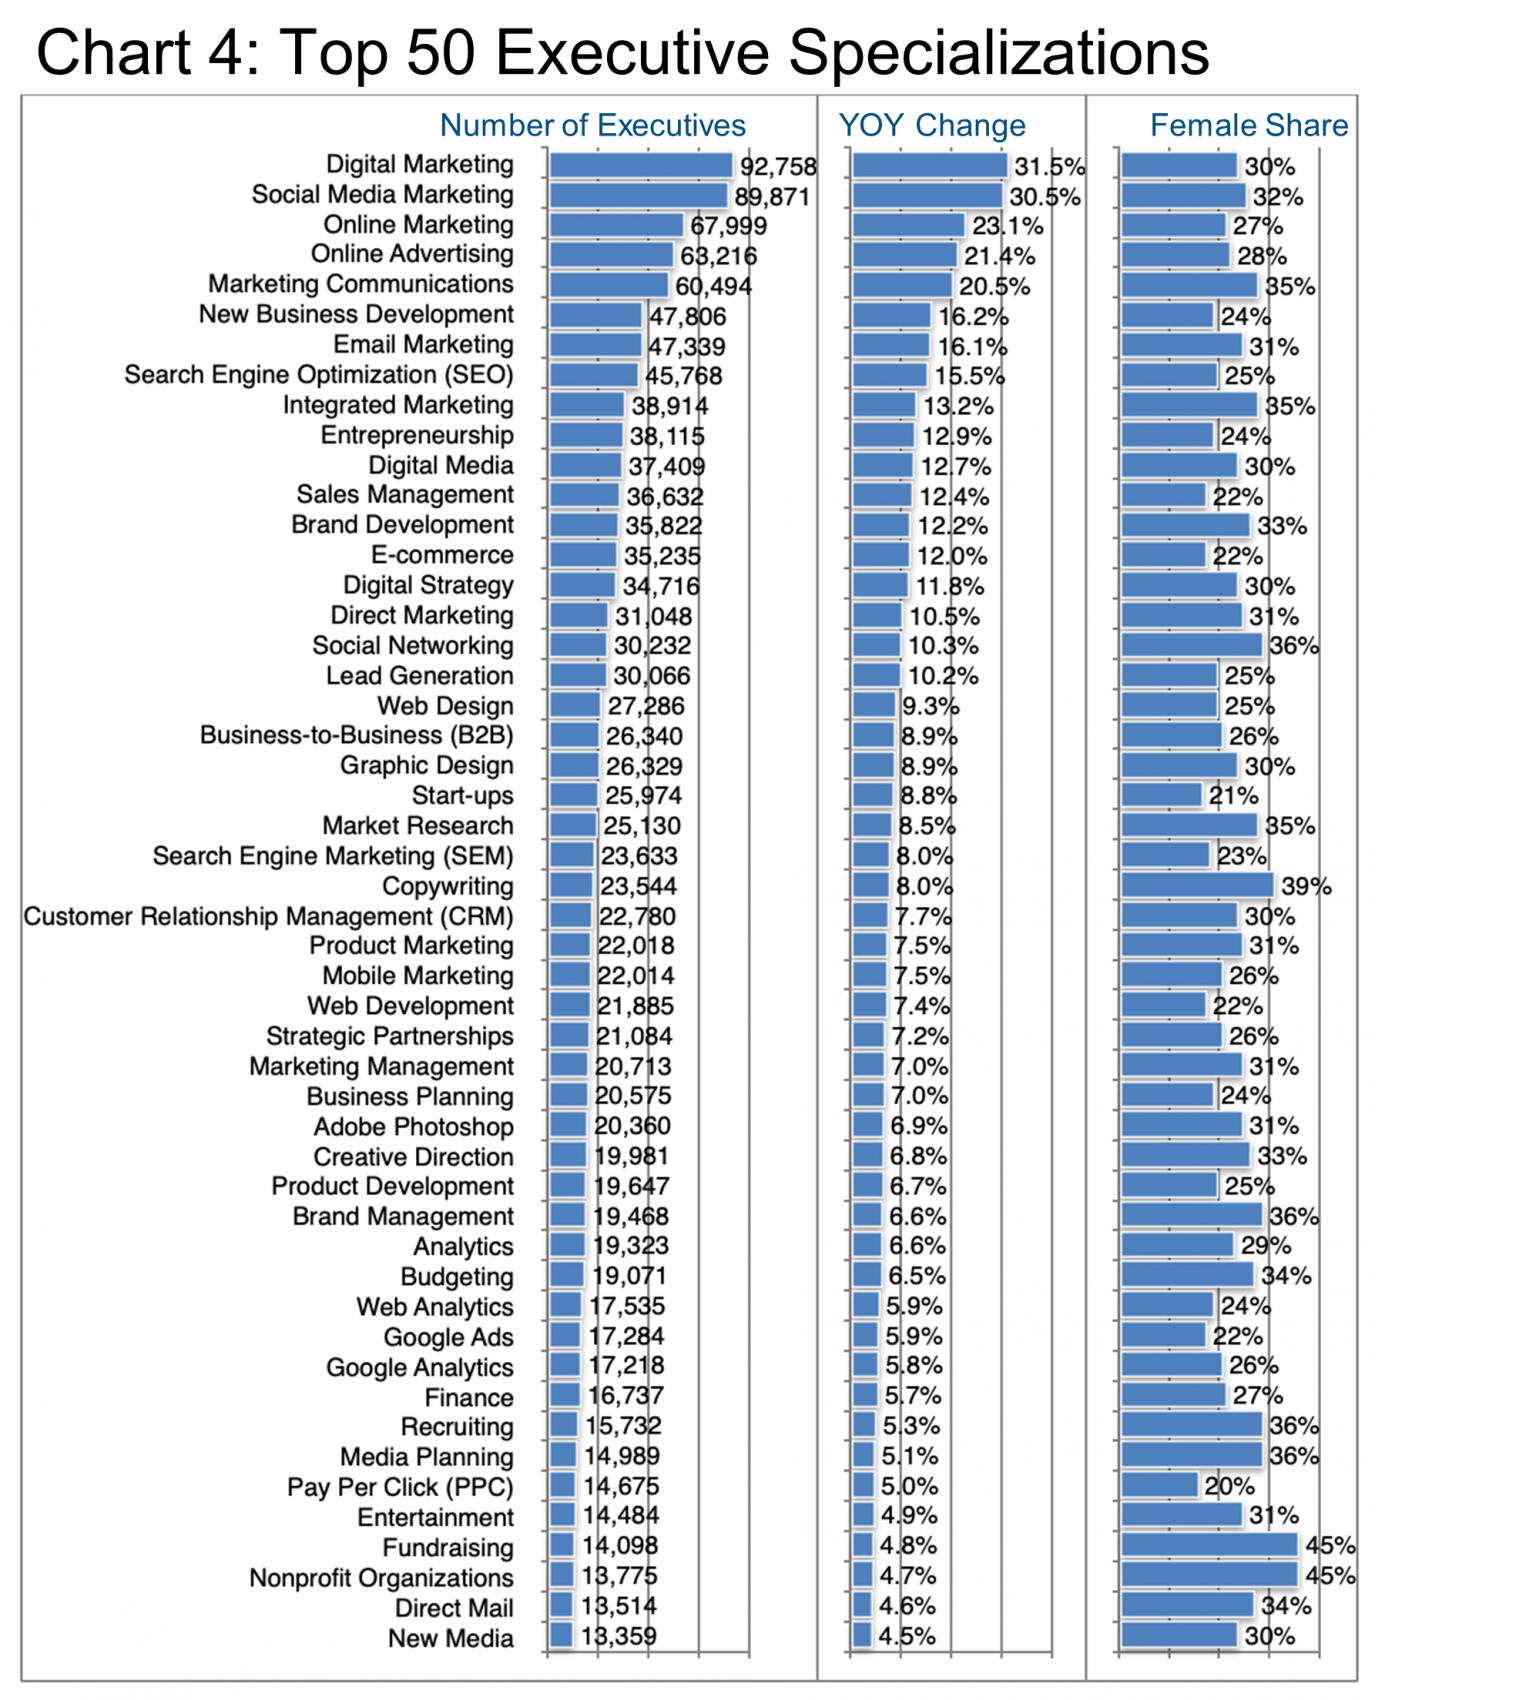
Chart 4 highlights the top 50 such areas of focus. Given the trends we emphasized in the introduction, it is no big surprise to see Digital Marketing, Social Media Marketing, Online Marketing and Online Advertising in the top slots. These post impressive growth as all of these specializations appear to be in high demand. Also, please bear in mind that one executive can and most likely does post multiple skills on his or her LinkedIn profile. These totals will considerably exceed the total number of executives in this study.
Seen through the lens of transferability, it does seem that there is tremendous latitude to take many of these specializations and apply them to roles in other industries. Transferability is a skill that many executives say they are keen to master.
Peter Irish, CEO, The Barrett Group
Click here to download a printable version: Industry Update – Marketing and Advertising
Editor’s Note:
In this particular Industry Update, “executives” will generally refer to the Vice President, Senior Vice President, Chief Operating Officer, Chief Financial Officer, Managing Director, Chief Executive Officer, Chief Human Resources Officer, Chief Marketing Officer, Chief Information Officer, Managing Partner, and President titles. Unless otherwise noted, the data in this Update will largely come from LinkedIn and represents a snapshot of the market as it was at the time of the research.
Is LinkedIn truly representative? Here’s a little data: LinkedIn has approximately 830 million users. (See Source.) It is by far the largest and most robust business database in the world, now in its 19th year. LinkedIn defines the year-over-year change (YOY Change) as the change in the number of professionals divided by the count as of last year. “Attrition” is defined as the departures in the last 12 months divided by the average headcount over the last year.


