
INDUSTRY UPDATE: Construction & Real Estate
In the context of this Industry Update, we recognize a continuous interaction between the real estate and construction markets. We will report on important aspects of each, as well as regional distinctions across our target geography. But overall we regard the construction and real estate executive market as one. They are an intertwined pool of opportunity.
Long-Term Gain, Short Term Pain
Beginning with the US housing market, the volume of sales clearly moves inversely to the price of a home and the cost of a mortgage: “The total value of the U.S. housing market has doubled in the last decade and is now worth $43.4 trillion, according to a Zillow analysis.” (See source.) In the short term, “The median [US] existing-home sales price was down 0.2% to $363,000 in February compared to a year ago, according to the National Association of Realtors (NAR). This ends a record streak of 131 consecutive months of year-over-year increases. Total existing-home sales jumped 14.5% from January to February—ending a run of 12 consecutive months of declining sales—but were still down 22.6% from a year ago, per NAR.” (See source.)
Homes for sale inventory in the US is still very low, though, and likely to remain so despite a short-term uptick. “Housing starts also rose 9.8% in February, according to preliminary data from the U.S. Census Bureau and the U.S. Department of Housing and Urban Development (HUD), helping to provide much-needed inventory.” (See source.)
On commercial real estate, “CBRE forecasts a 15% year-over-year drop in U.S. commercial real estate investment volume in 2023 [to $609.65 billion], although it will exceed the pre-pandemic record annual total in 2019. Investment activity likely will bottom out in the first quarter and then gradually improve.” (See source.) One of several reasons is the hybrid in-office/remote work model: “As companies find an optimal balance over the next few years, office utilization and the space needed per worker will reach a new equilibrium that could ultimately reduce demand for office space per employee by up to 15% from the pre-pandemic norm.” (See source.)
“Demand [will likely be] stronger in Sun Belt markets, life sciences clusters, and best-in-class assets.” “Fast-growing and popular Sun Belt markets, including Austin, Dallas, Miami, and Nashville, will remain in favor. Growing demand among life science tenants, who generally don’t allow remote work, will buoy hubs like Boston, Denver, and Salt Lake City. Best-in-class properties in otherwise hard-hit primary markets, including Manhattan and Los Angeles, will also garner more interest.” (See source.)
In Europe, the “European Central Bank earlier this month [April] warned of “clear signs of vulnerability” in the property sector, citing “declining market liquidity and price corrections” as reasons for the uncertainty, and calling for new curbs on commercial property funds to reduce the risks of an illiquidity crisis. Already in February, European funds invested directly in real estate recorded outflows of £172 million ($215.4 million), according to Morningstar Direct data — a sharp contrast from the inflows of almost £300 million seen in January.” (See source.) A contributing factor here too is the question of where people will actually work.
However, office space occupancy rates are generally much higher in Europe than in the US, so the former market has much less slack. In Europe, a “total of 12.6 million sq m of office space was leased in 2022, a 15% jump on the 10.9 million sq m leased in 2021, and sits well above the fifteen-year average of 10.3 million sq m. The growth in activity was evident across the majority of markets with 23 out of 30 markets tracked reporting year-on-year growth in leasing activity. Major markets including Milan (+37%), Warsaw (+34%), Madrid (+32%), Paris (+26%), and London (+22%) all showed robust levels of activity.” (See source.)
As far as office space in the UK is concerned, “Take-up in the Big Six regions and Central London totaled 3.88 million sq ft in the final quarter of 2022, an increase of 5% on the previous quarter and 4% above the 10-year quarterly average.” “Despite the strong finish to the year, the Big Six markets were 8% below their average take-up with Central London also 1% down in 2022.” (See source.)
In the Middle East, real estate investment in the GCC countries grew at more than twice GDP growth in 2022. “The total value of real estate projects currently planned or under construction currently stands at an estimated $1.36 trillion. Saudi Arabia accounts for 64.5 percent of this total or some $877 billion, followed by the UAE, which at $293 billion, accounts for 21.6 percent of the total.” (See source.)
Shifting our focus to the construction segment, let’s start with Canada. The “Construction industry in Canada is expected to grow by 4.2% to reach CAD 192,205 million in 2023. […] The growth momentum is expected to continue over the forecast period, recording a CAGR of 3.8% during 2023-2027. The construction output in the country is expected to reach CAD 222,882.9 million by 2027.” (See source.)
We already noted the generally rapid growth in the Middle East above. There is one segment that is literally and figuratively “hot.” That segment is data centers. “The Middle East data center construction market size was valued at USD 1.84 Billion in 2022 and is expected to reach USD 2.86 Billion by 2028, growing at a CAGR of 7.59%.” (See source.)
In the UK, the construction market value is expected to grow from £326.94 to £476.6 Billion between 2022 and 2027. (See source.) While office space may take a breather, “infrastructure and energy and utilities investment will be a key area of construction spending in the coming years, offsetting weakness in the buildings sectors.” (See source.)
The “construction industry in Europe is expected to record a CAGR of 3.7% to reach USD 2,839.7 billion by 2024. The residential construction industry in value terms increased at a CAGR of 4.2% during 2015-2019. The commercial building construction market in value terms is expected to record a CAGR of 3.0% over the forecast period.” (See source.)
For the US, the “market size, measured by revenue, of the Construction industry is $2.6tr in 2023.” This means a 4.2% decline versus prior year and an average shrinkage of 1.3% per annum between 2018 and 2023. (See source.) Government spending from programs such as the Inflation Reduction Act and others may well affect the direction of this trend going forward.
However, one important barrier is unlikely to evaporate any time soon: “The US currently lacks around 430,000 construction workers and the industry has only recovered 67% of the jobs lost in March and April 2020.” (See source.) “The biggest concern in the construction sector of the European Union (EU-27) was the shortage of labor. Approximately 30 percent of respondents as of March 2023 mentioning that it was limiting their activities.” (See source.) Numerous apparently intractable factors contribute to this phenomenon including an aging workforce, better pay in other sectors, a lack of immigrants, etc.
Innovations Transforming the Industry
So far we have presented a mixed picture between real estate and construction. Both industries are certainly impacted by the rising cost of capital and an acute labor shortage, particularly in the US and Europe. However, there are also numerous interesting trends seething under the surface, trends that can bring major benefits—especially to executives who have the right skill set. Here are a few of the most intriguing developments.
- Prefab and modular construction reduces the effect of construction labor shortages.
- Virtual design is accelerating and streamlining previously manual and highly specialized pre-construction processes, also perhaps reducing the preeminent role of architects.
- Living or otherwise advanced materials such as biocement, “aerogel, graphene, spider silk, carbon composites, hydroceramics, and nanomaterials” offer intriguing benefits, including enhancing sustainability, the ability to hold more water, higher strength with lower weight, etc.
- Drones also simplify both pre-construction processes as well as project monitoring during the actual build.
- Construction robots can contribute by autonomously digging foundations, moving materials, tying rebar, inspecting, and otherwise supplementing human crews.
- (See source 1. See source 2. See source 3.)
The Market for Executives
Although we serve clients worldwide, we focus on the US, Canada, the EU, the UK, and the Middle East. In these markets, more than 1 million executives work in this segment. This is a group that has grown just 0.5% in the past year although almost 23,000 executives have also changed jobs. This means that there were some 28,000 new or re-filled executive opportunities in this industry over the last 12 months. The US & Canada employed 667,000 (+0.03%) and the EU, UK, and the Middle East employed 336,000 (+0.8%). In other words, even in a slow-growing market, there can be plenty of opportunity if you know where to look. Based on their LinkedIn declarations, some 614,000 of these execs worked mainly in Construction while 430,000 (+0.4%) hailed mainly from Real Estate (+0.7%).
In both cases, the female share of executives is relatively low at 12% and 24% respectively. LinkedIn further typifies the overall demand as rather low for these profiles.
There are numerous pockets of higher growth, too. Chart 1 examines the specific industrial focus declared by executives in this overall segment whereby Venture Capital & Private Equity (+4.8%), Non-profit Management (+2.8%), Staffing & Recruiting (+2.4%), Financial Services (+1.9%), Investment Management (+1.4%), and Food & Beverage (+1.3%) all stand out as exhibiting both higher growth and a continuing “very high” hiring demand according to LinkedIn.
Clients of the Barrett Group, of course, have access to much more detailed information first at the industry level, then at the target company level, and lastly often at the hiring manager level.
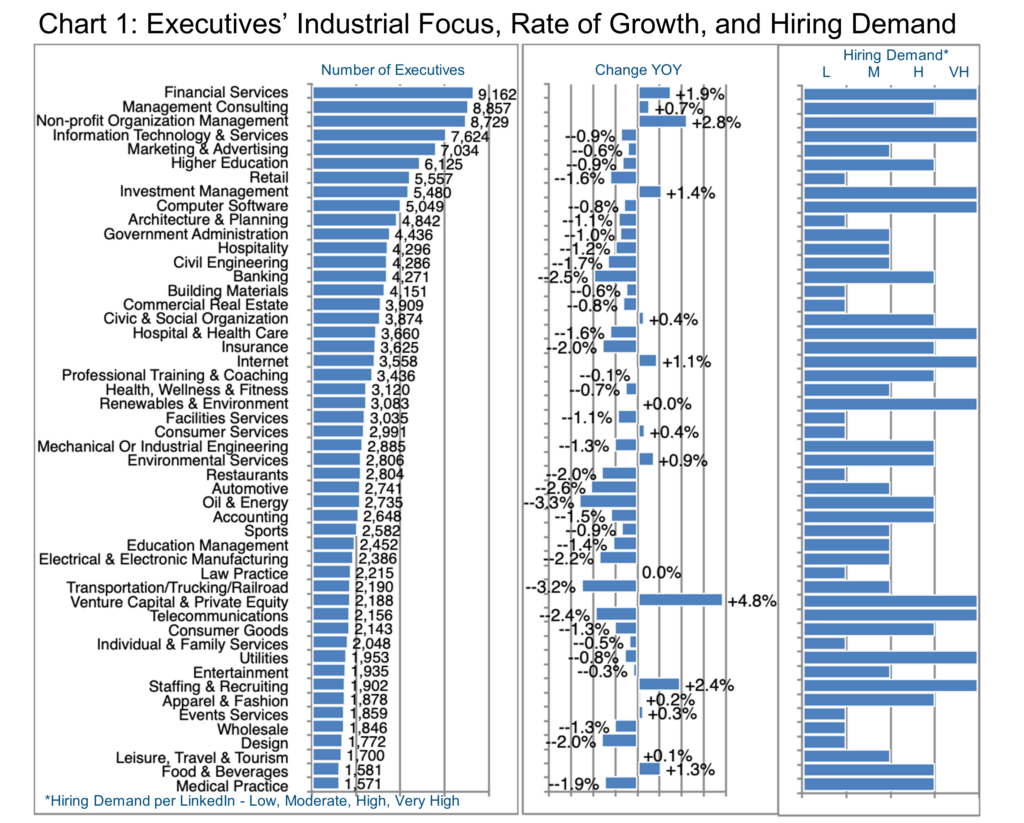
Note, too, that some segments with low growth still have a high hiring demand, presumably due to the difficulty of sourcing and retaining appropriate candidates. Utilities, Telecommunications, Renewables & Environment, Hospital & Health Care, Computer Software, and Information Technology & Services all fit this pattern per Chart 1.
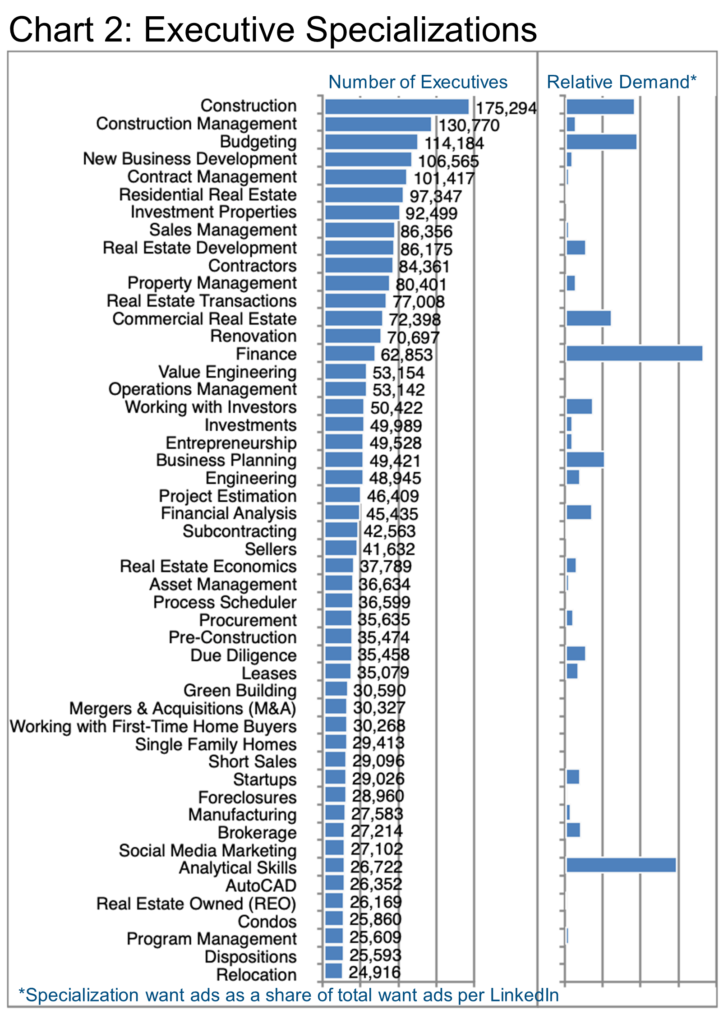
Chart 2 opens the aperture on specializations in this industrial segment, and their relative frequency. This chart also provides a perspective on the relative demand for one skill set versus another.
Bear in mind that the cohort we are examining has declared an overall principal participation in the Construction and Real Estate industry. Within that context, most have also highlighted multiple specializations. These are addressed in Chart 2 which allows us to distinguish Construction Management from Construction, for example, or Residential Real Estate from Commercial Real Estate.
As we often point out in these Updates, some of these specializations are quite unique to the segment. Those specialties such as Property Management, Renovation, Project Estimation, etc. These are perhaps less transferrable specialties. If candidates want to move into or out of this field, many other specialties are highly transferable.
Budgeting, New Business Development, Sales Management, Finance, Business Planning, etc. are all examples of skills that can be repositioned to or from other industries—something the Barrett Group helps clients with regularly as they decide to change their professional trajectories and we help them chart their new course.
On the demand side of the equation, LinkedIn also provides some transparency on the number of want ads published seeking various specializations. Those with the highest frequency stand out in the right half of Chart 2, particularly Construction, Budgeting, Finance, and Analytical Skills. Where there is no apparent data, this simply means that the number of want ads was quite low, though not necessarily zero.
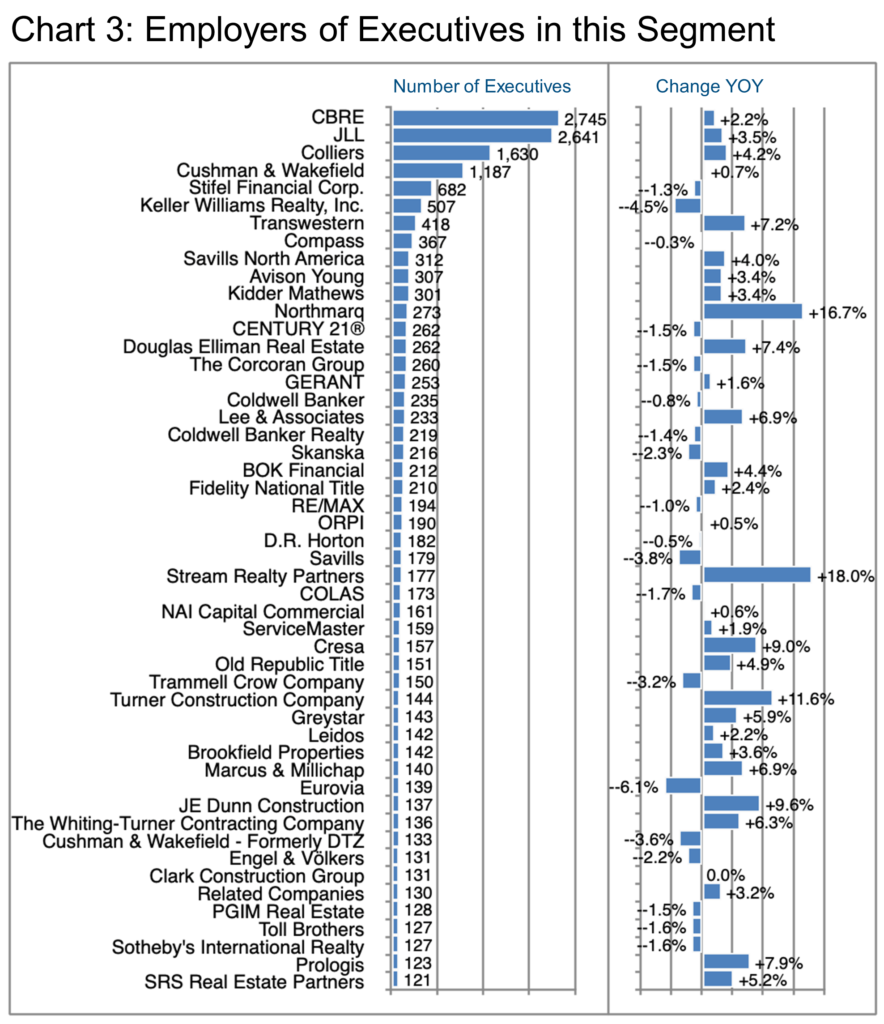
Chart 3 delves into the actual employers of executives in this industry. CRBE tops the chart as far as the number of executives goes, but the company is also showing impressive growth for its size and industry (+7% total staff, 11,120 hires in the last 12 months). Speaking about total staff, CRBE has hired extensively from JLL, Cushman & Wakefield, Colliers, and Amazon over the past year. Their teams are distributed widely in New York, London, Dallas (their headquarters), Los Angeles, San Francisco, Seattle, Delhi, Singapore, and Sydney to name a selection of locations.
Farther down the ranking but showing very high growth are Northmarq (+16.7%) and Stream Realty Partners (+18%). Northmarq hails from Minneapolis and has completed the acquisition of the Stan Johnson company within the past year which accounts for much of their recent growth. Here’s what the industry press had to say about the deal:
“Commercial real estate capital markets platform Northmarq has agreed to acquire Stan Johnson Co., a Tulsa-based real estate brokerage and advisory firm, for an undisclosed price. The acquisition will include Stan Johnson’s affiliated debt services company, Four Pillars Capital Markets.” (See source.)
Stream Realty Partners bills itself as one of the fastest-growing full-service commercial realtors in the US. Stream Realty Partners has grown organically, hiring mainly from CBRE, Cushman & Wakefield, JLL, and Transwestern. Most of their staff is based in Texas.
Another fast grower is Turner Construction (+11.6%), based in New York: “Turner is a North America-based, international construction services company and is a leading builder in diverse and numerous market segments.” The company’s talent acquisition appears to be broad-based with significant hiring from Kiewit and Clark Construction in the past 12 months, however, the firm is also expanding to new markets including the UAE, Nigeria, and India among others.
Based in Missouri, US, JE Dunn (+9.6%) is also expanding rapidly though only on a US basis so far, acquiring talent organically and mainly from DPR Construction, Turner Construction, and Kiewit.
Prologis (+7.9%) focuses on logistics real estate saying, “Prologis, Inc. is the global leader in logistics real estate. In partnership with our customers and our communities, we develop modern, high-quality properties that set the standard for innovative building design and sustainability. Prologis owns or has investments in properties and development projects of ~1.2 billion square feet in 19 countries and enables 2.8% of the world’s GDP.”
Clearly, there are different strategies in play for the fastest-growing companies we have just reviewed. Location remains an important component.
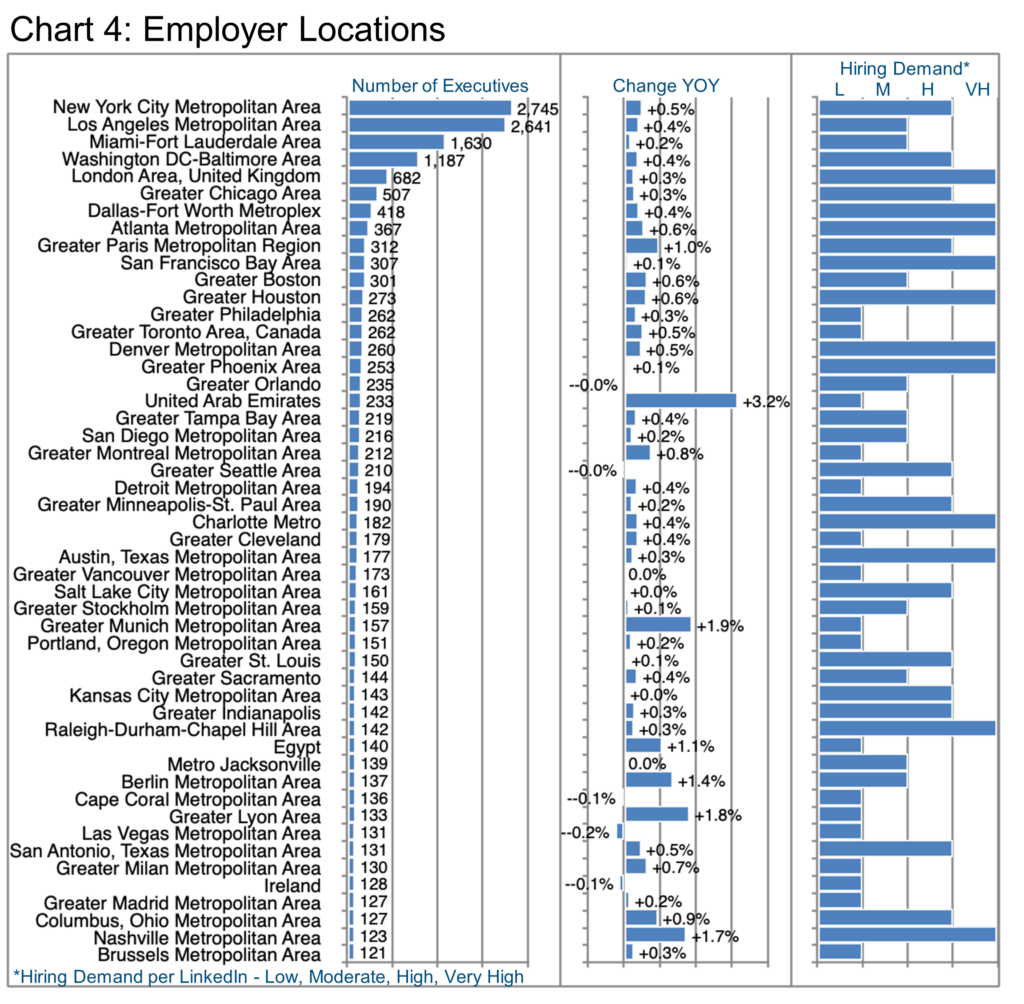
Chart 4 explores the employment locations for executives in this industry. We encourage readers to bear in mind the high opportunity to work remotely these days. It is important to remember that where you are employed may not influence where you actually work.
The major locations in the US all show growth levels representative of the industry as a whole. The only real exceptions are perhaps Columbus (+0.9%) and Nashville (+1.7%). Hiring demand appears to be high or very high in numerous locations such as Dallas, Atlanta, San Francisco, Houston, etc.
Paris tops London in terms of growth. Hiring demand seems to be higher in London. Other international locations worth mentioning follow.
In the UAE, three employers appear prominently in Dubai. These are namely, ALDAR, Emaar, and DAMAC Properties.
Munich shows significant growth. Linder, Colliers, and Künzel Group employ the largest numbers of industry execs there.
Lyon shows some life. LinkedIn cites Orpi, Gerant, and Guy Hoquet L’Immobilier as the largest employers in this sector in Lyon.
Peter Irish, CEO
The Barrett Group
Click here for a printable version of Industry Update – Construction & Real Estate 2023
Editor’s Note:
In this particular Update, “executives” generally refers to the Vice President, Senior Vice President, Chief Operating Officer, Chief Financial Officer, Managing Director, Chief Executive Officer, Chief Human Resources Officer, Chief Marketing Officer, Chief Information Officer, Managing Partner, General Counsel, Head, and President titles. Unless otherwise noted, the data in this Update largely came from LinkedIn and represents a snapshot of the market as it was at the time of the research.
Is LinkedIn truly representative? Here’s a little data: LinkedIn has more than 900 million users. (See source.) It is by far the largest and most robust business database in the world, now in its 20th year. LinkedIn defines the year-over-year change (YOY Change) as the change in the number of professionals divided by the count as of last year. “Attrition” is defined as the departures in the last 12 months divided by the average headcount over the last year.


